SAP Focused Run security baseline validation

With the help of Security and Configuration validation you can quickly get an overview of the security compliance of your systems.

Questions that will be answered in the blog are:

  • How to convert your security baseline into a SAP Focused Run Policy XML file?
  • Does SAP provide best practices for security baseline?
  • How can I run a check against many systems?
  • How can I see which security parameters are ok and which ones are not ok in one overview?
  • Can I apply a temporary exemption to the policy?
  • Can I be alerted if a security parameter is changed from compliant to non-compliant value?
  • How many security policies should I create?

SAP Security baseline

SAP publishes a generic SAP security baseline template. For more information on this template, read this blog.

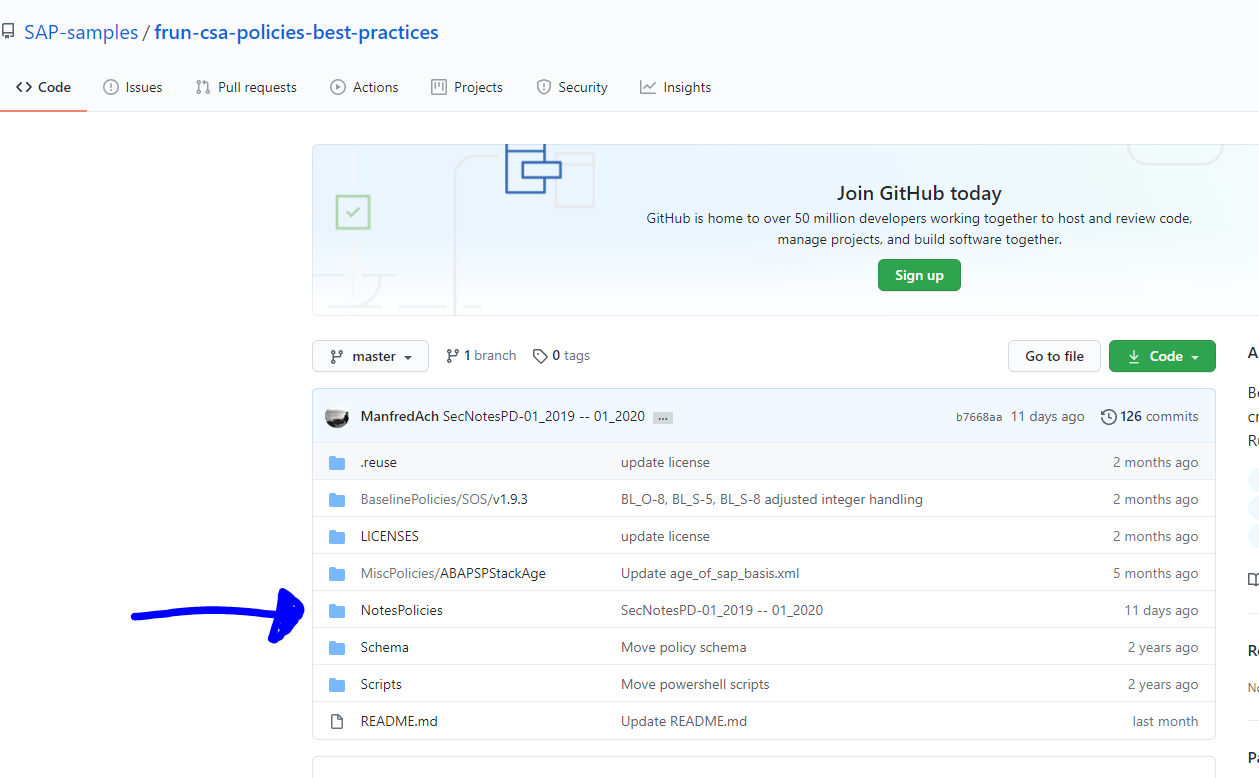
On the SAP github for Focused Run, SAP has put the XML policy files that correspond to this security baseline:

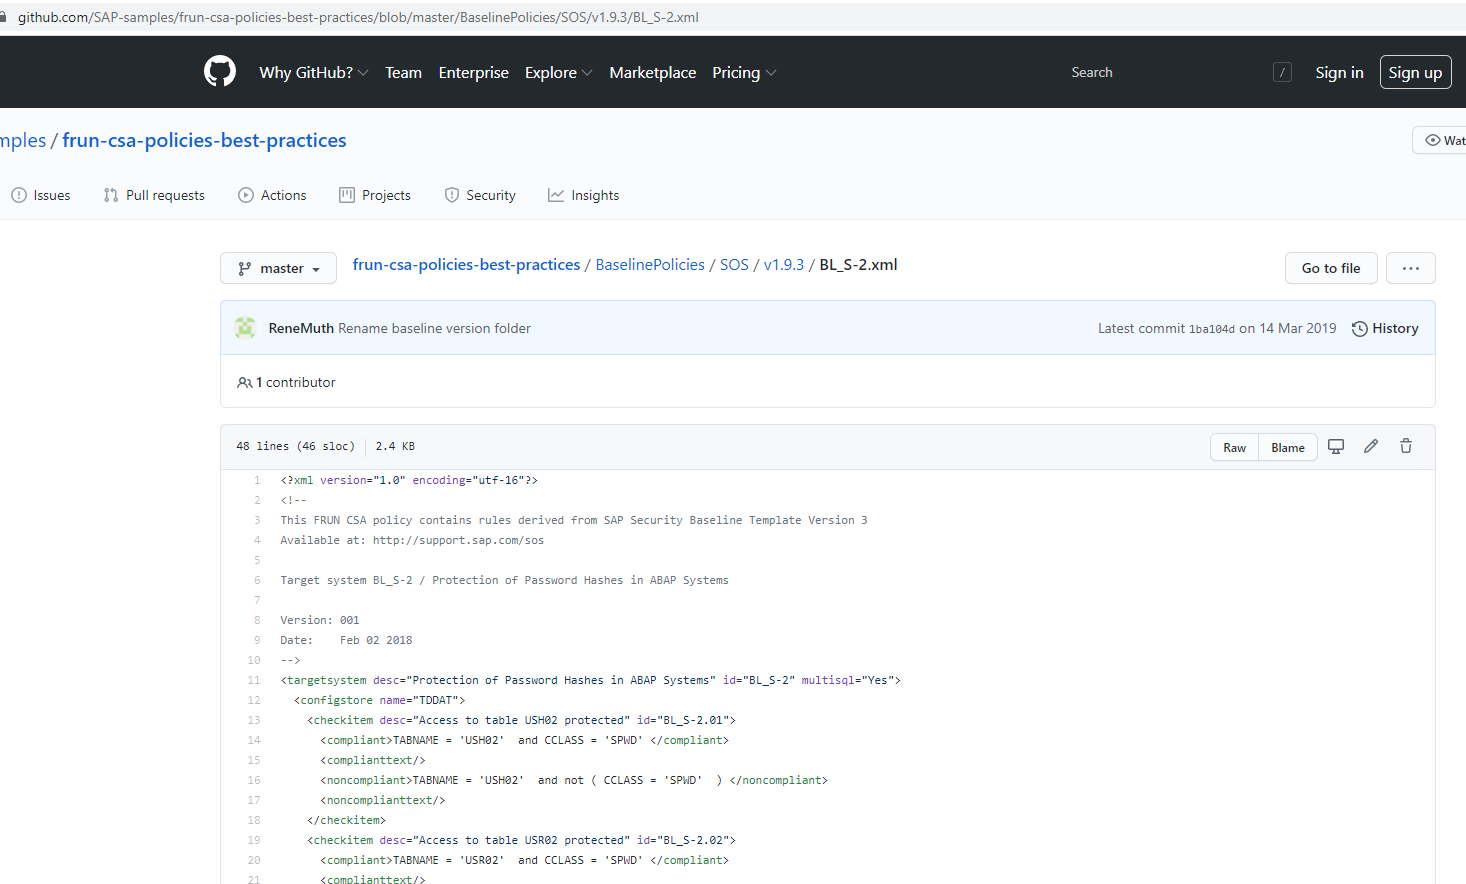
The formally published version of the SAP security baseline is version 2.4.1. The published github files are only updated until version 2.4.0.

Company security baseline

The SAP security baseline can be used as a quick start. But it still needs to be tailored to your company:

  • Values might need to be altered (example; length of password)
  • Values might not be relevant for you (this normally not the case, but it could be)
  • Extra checks that are not in the SAP baseline need to be added

Exemptions

We will explain later below in the blog how to deal with exemptions. A good example of an exemption is that you have a rule, but cannot apply it to all systems. Example is the login/disable_multi_gui_login parameter. By definition you want to set it to 1 to forbid multiple logons. But for 1 older system this is not possible and you have agreed with security team on an exemption. In this case, you don’t want to have a new policy. You keep the single policy but apply the exemption.

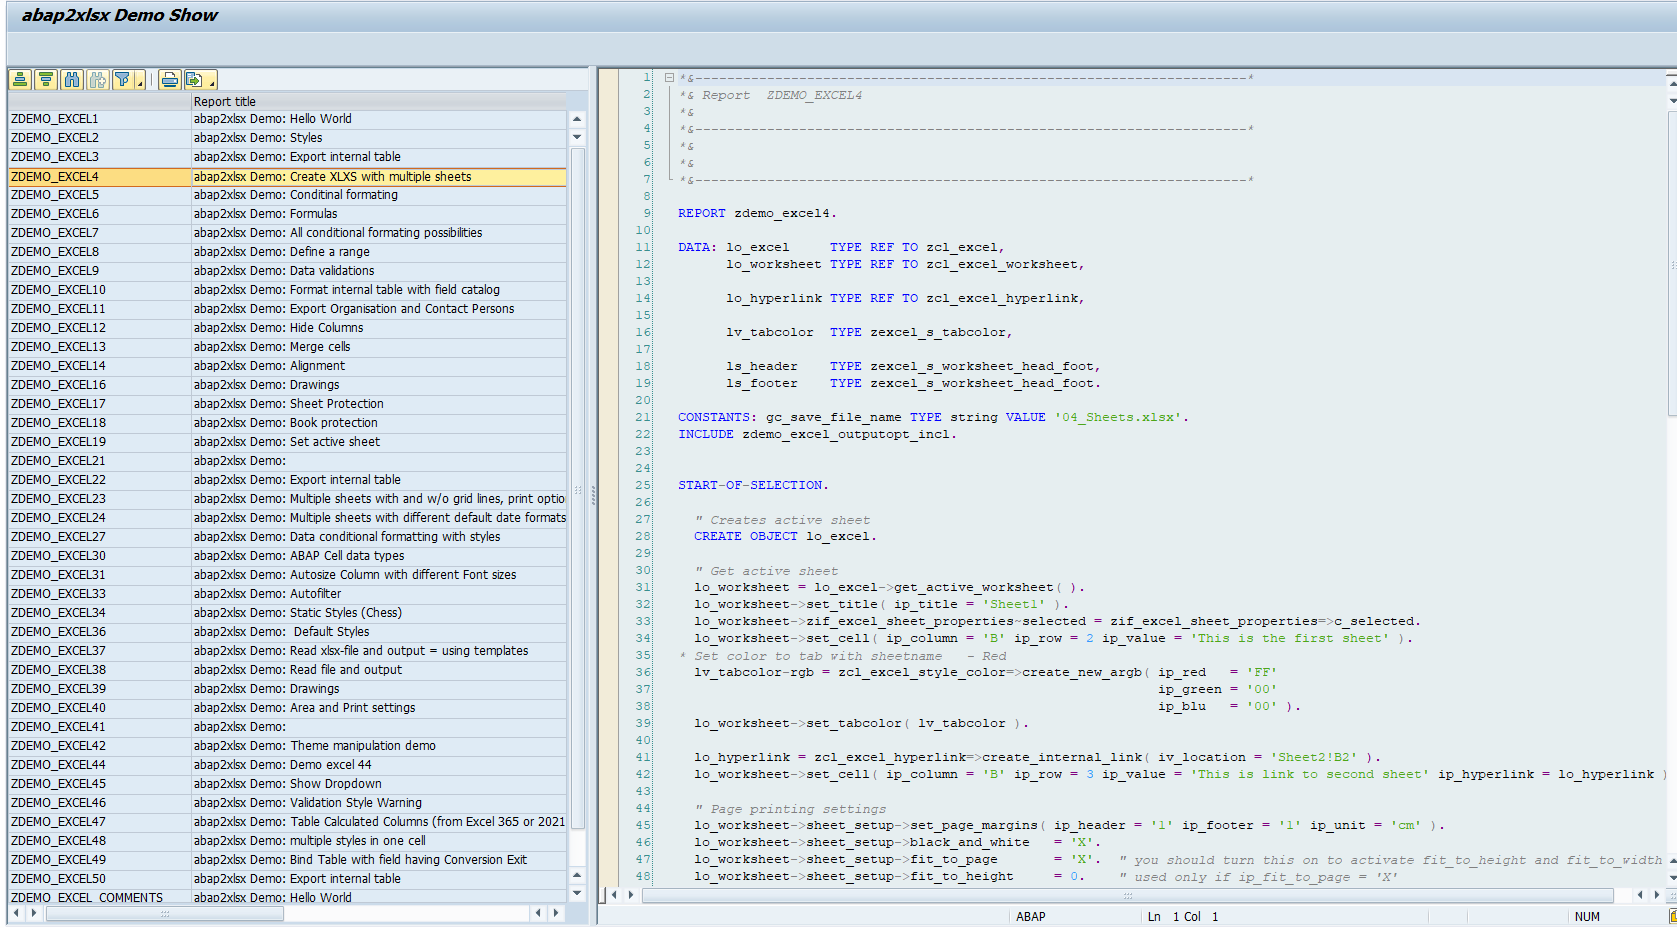
Creating the policy file(s)

With the help of the examples in the SAP security baseline, you can build your own company security baseline policy XML file.

In this file I have made an example which contains a lot of password and logon parameter related checks for the ABAP stack:

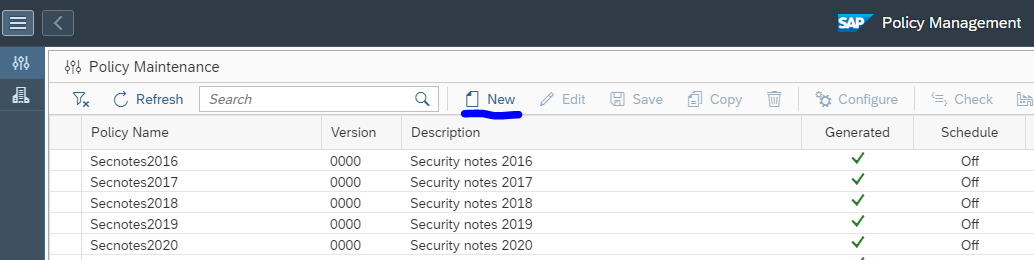
Goto the Policy Management FIORI tile:

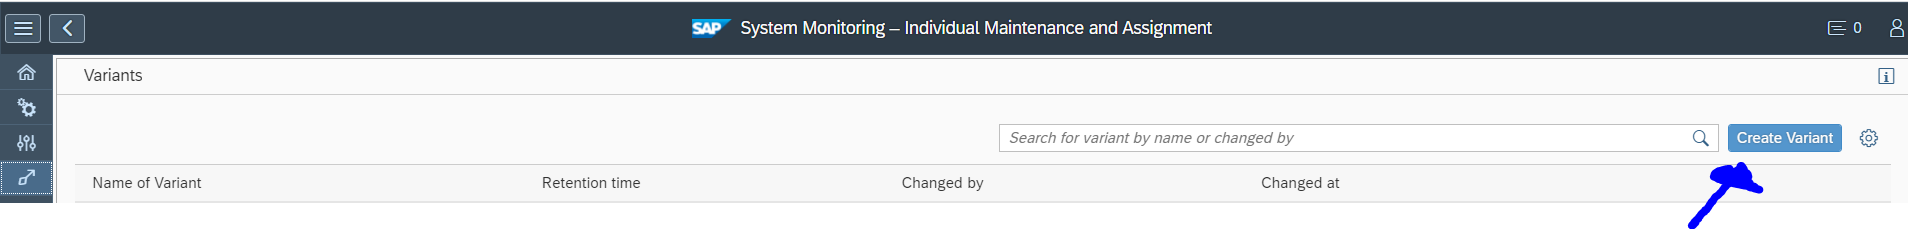
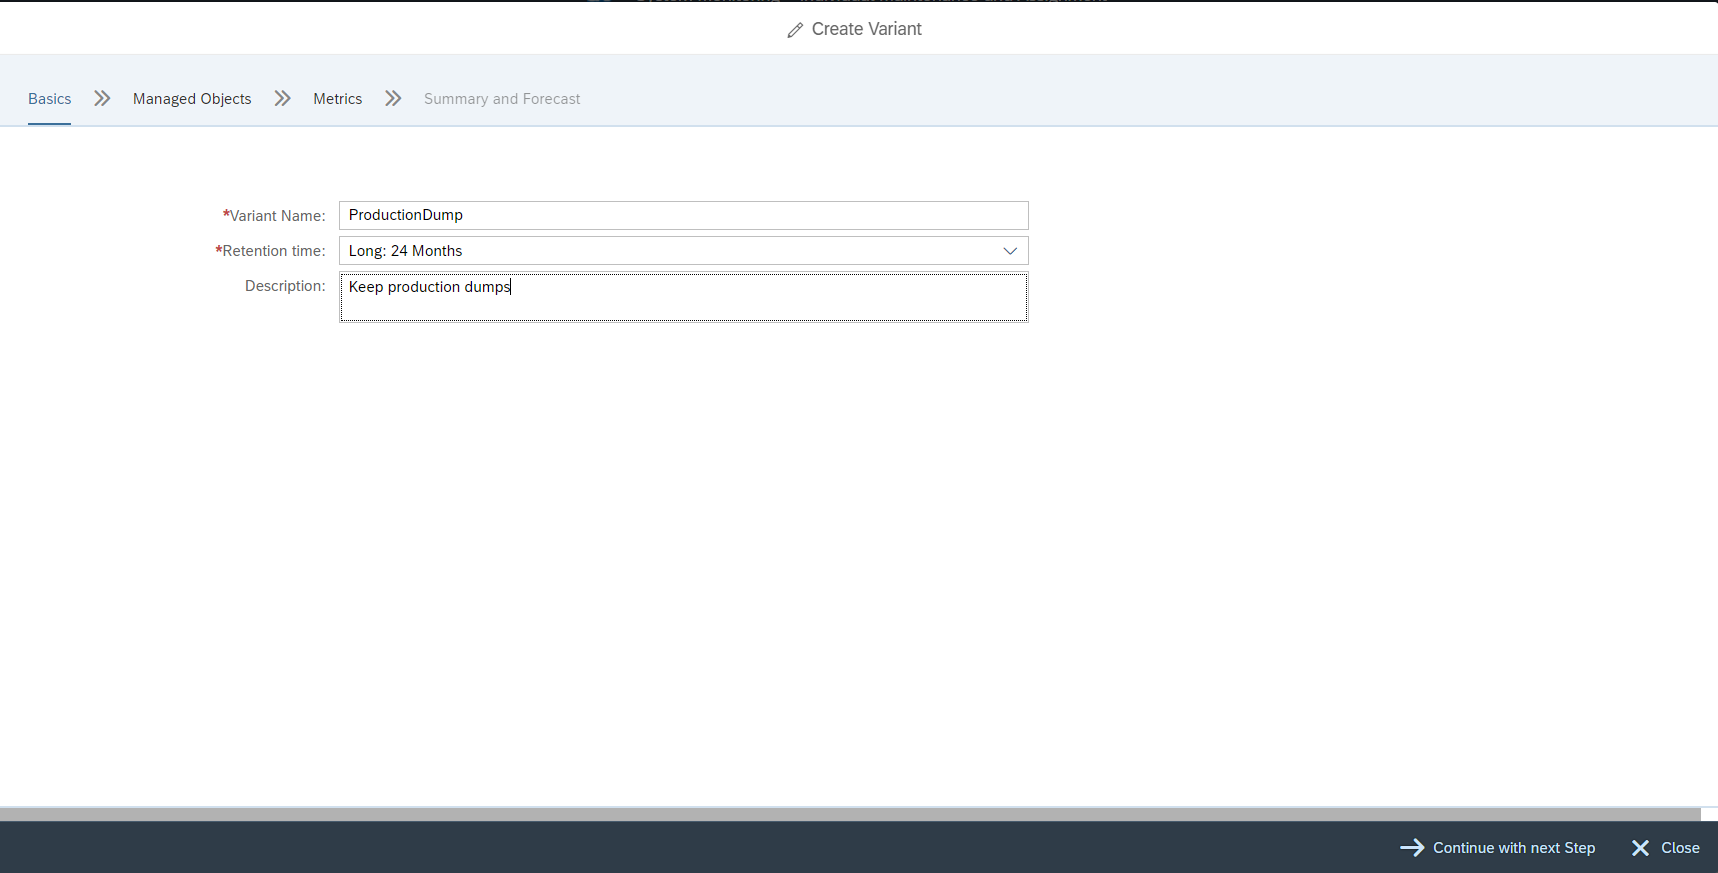
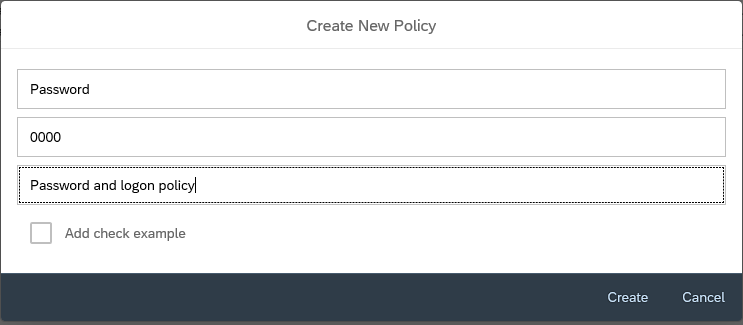
Create a new policy and give it a meaningful name and description:

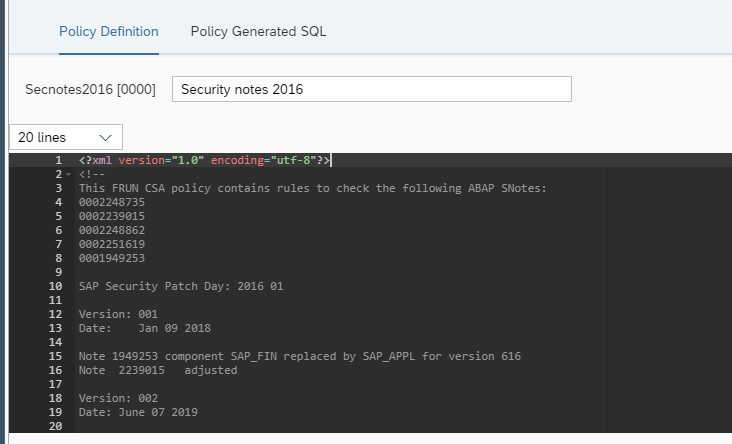
Now press the edit button and copy and paste the content:

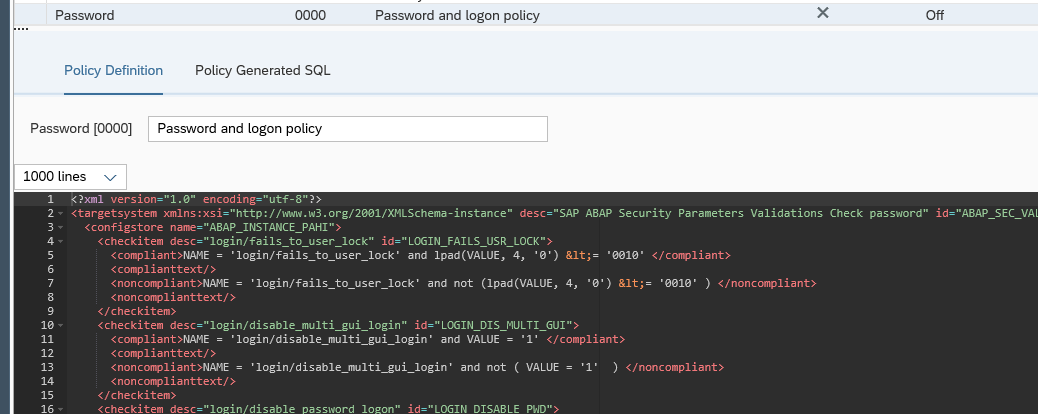
Now Save the policy, Check and Generate. Now you are ready to run.

You can modify the existing values in the XML sample to your need. After it is changed, Save, Check and Generate again.

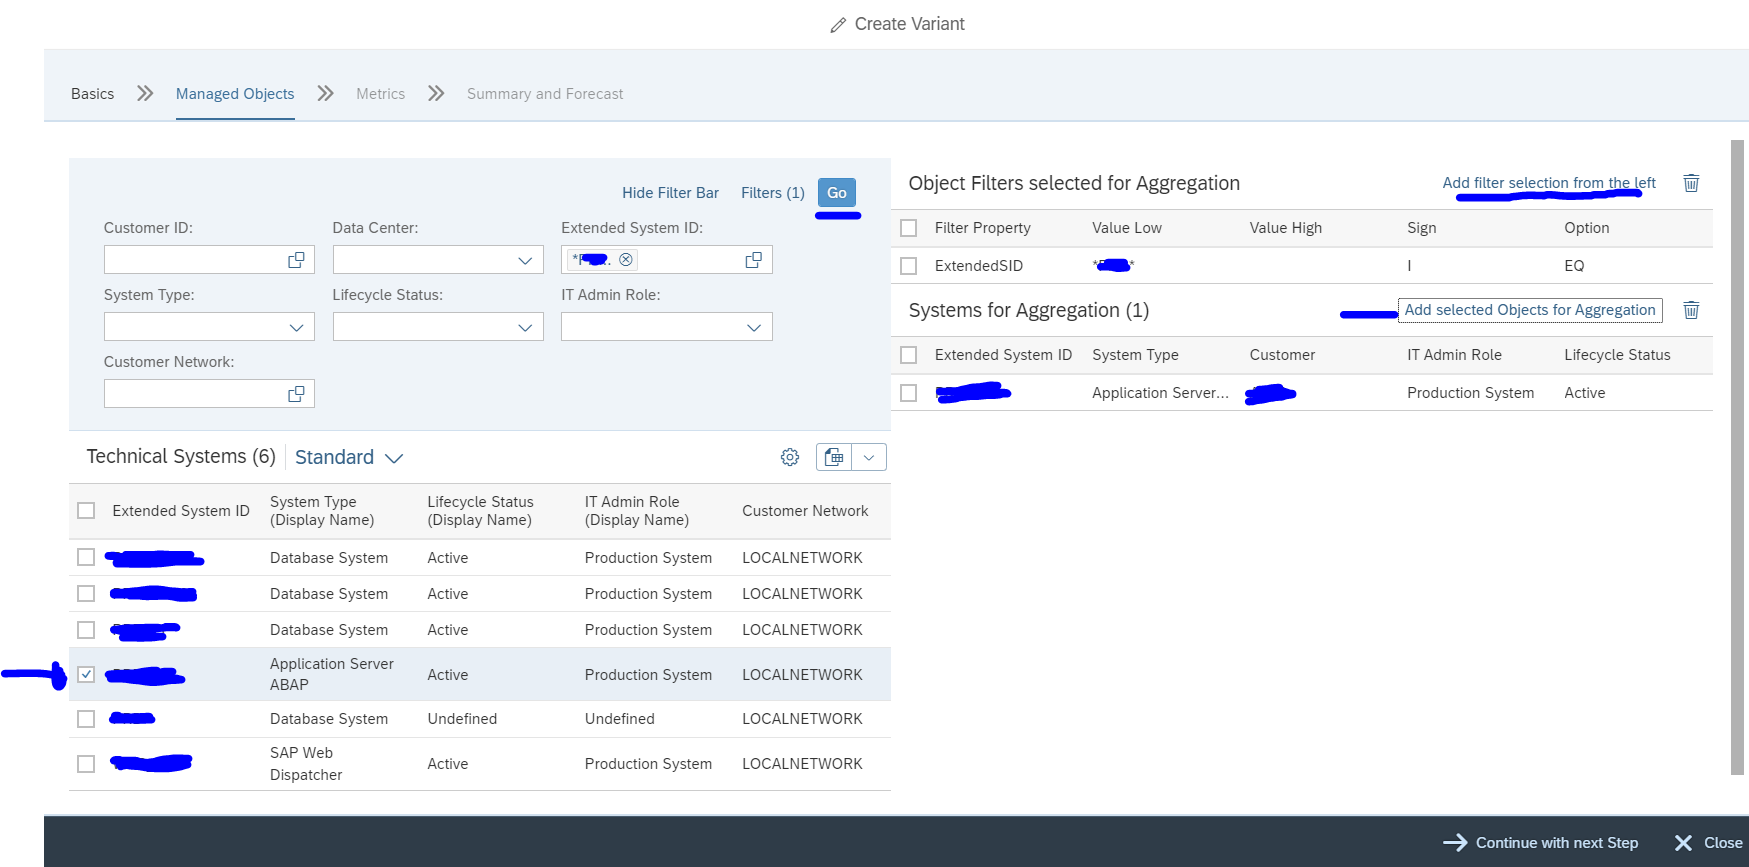
Running the baseline policy

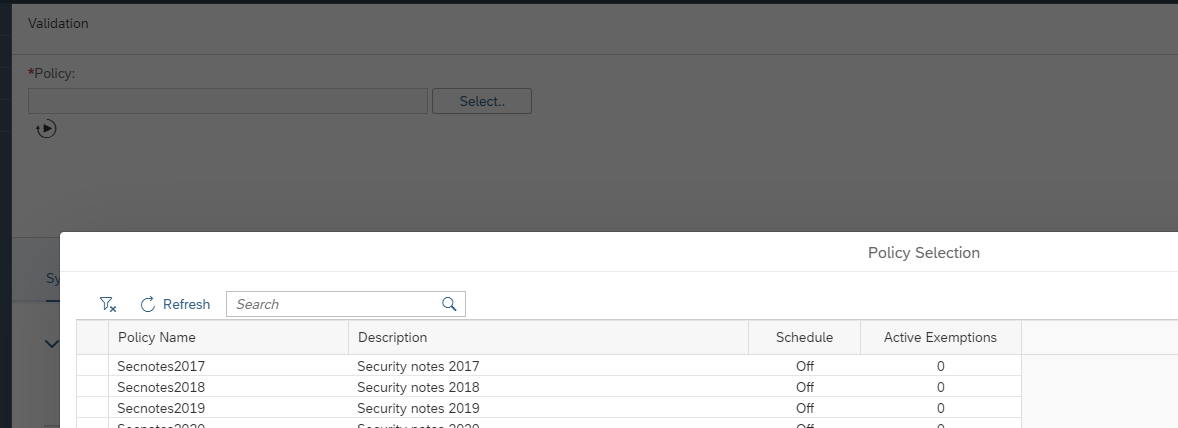
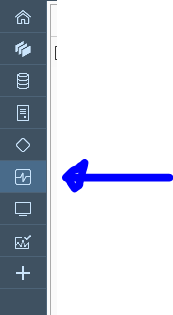
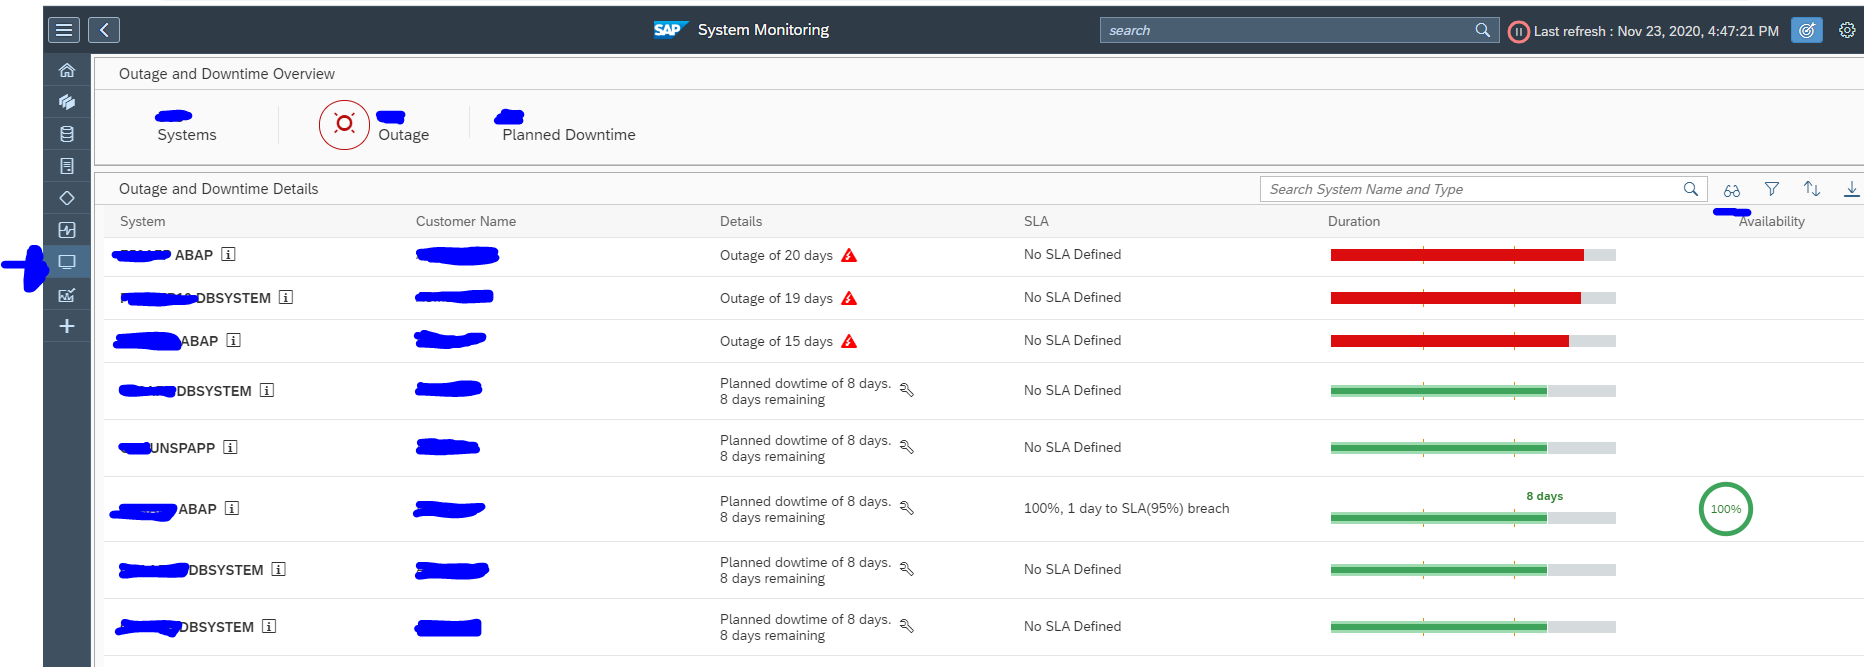
Start the Configuration and Security Analytics tile:

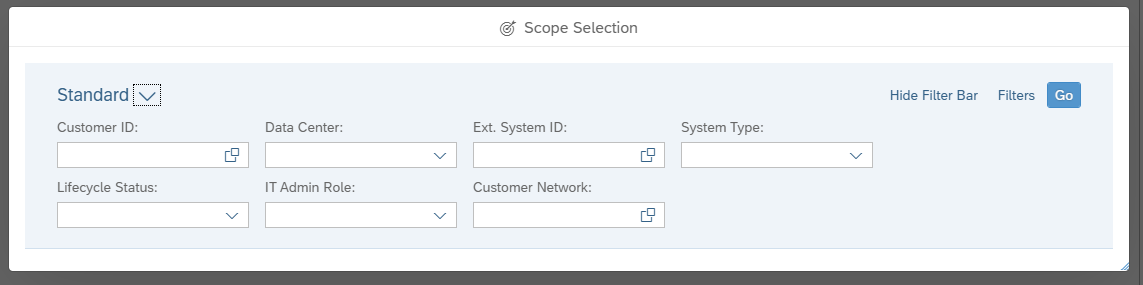
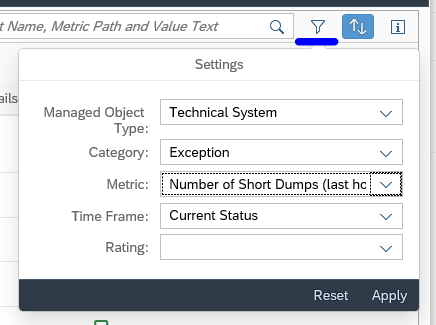
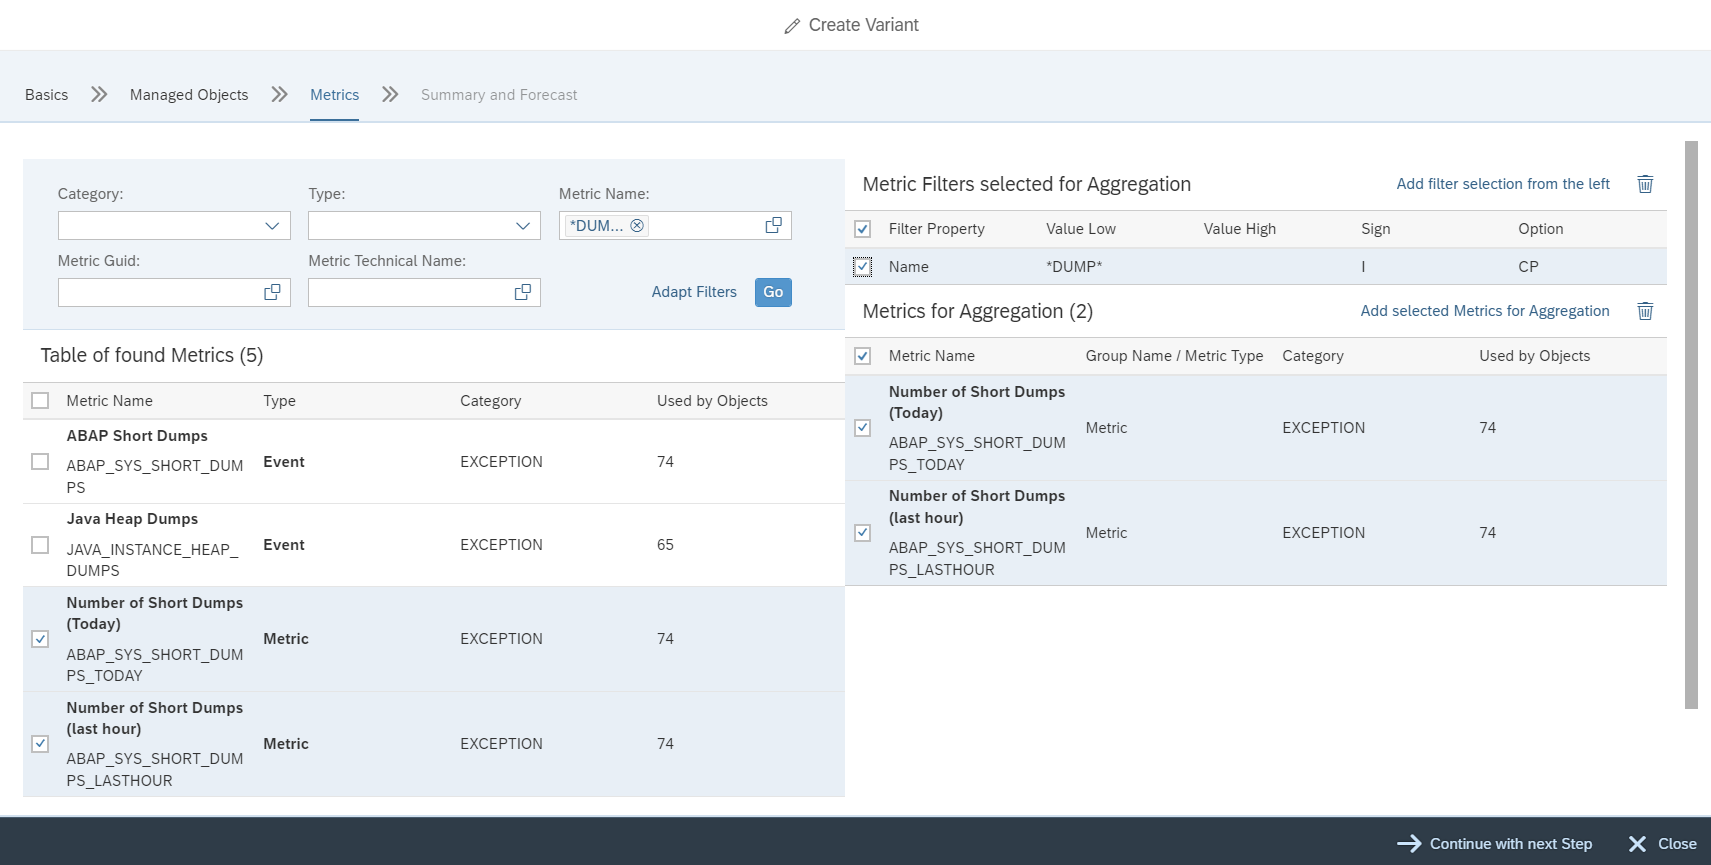
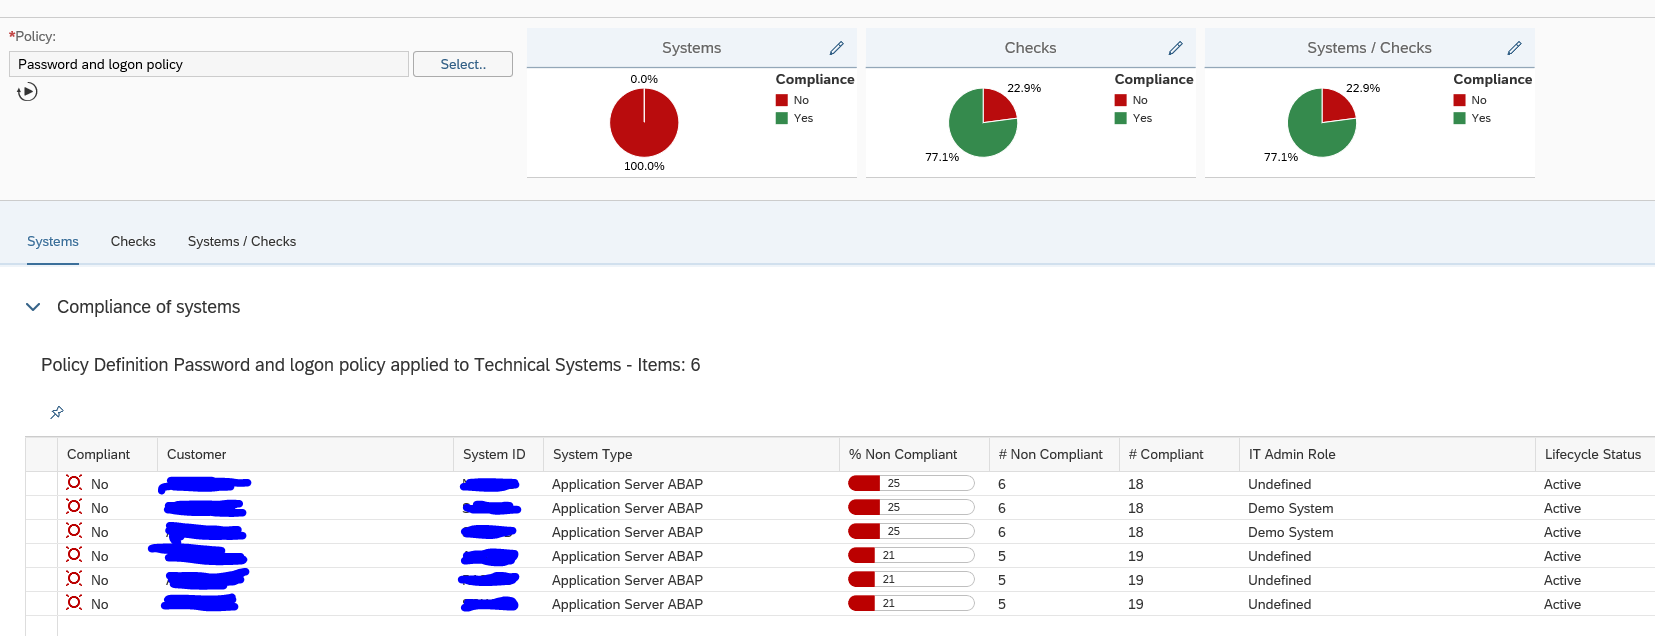
Select the Policy, and let the system run to get the results:

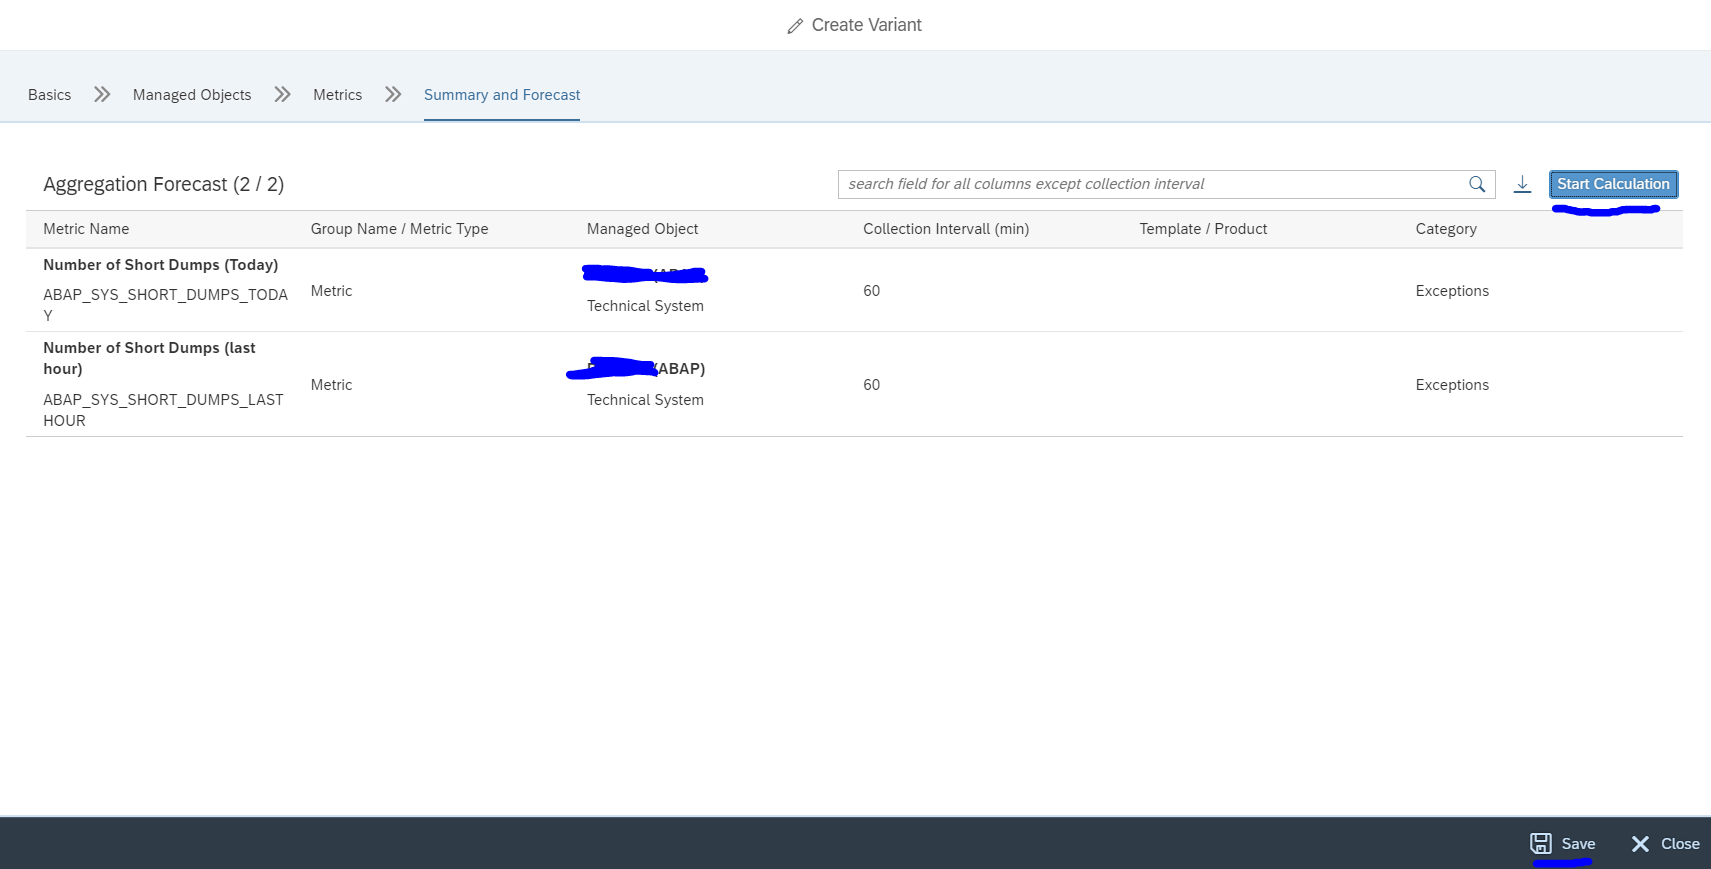
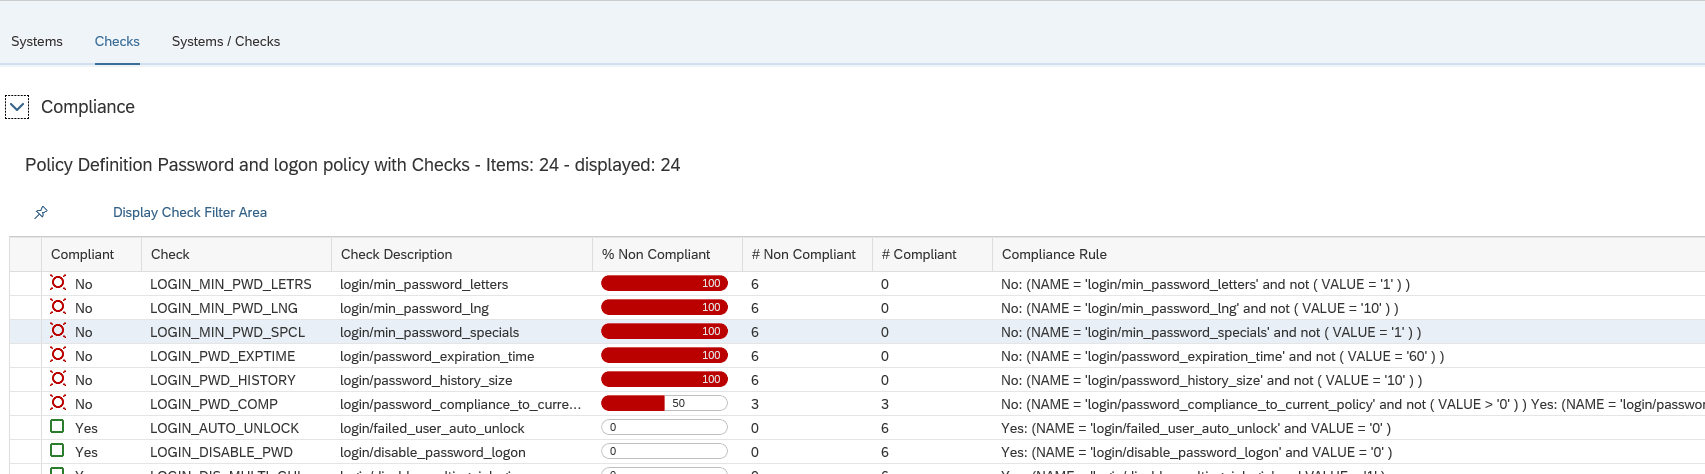
By clicking on the tab Checks you can zoom in on which items are not ok:

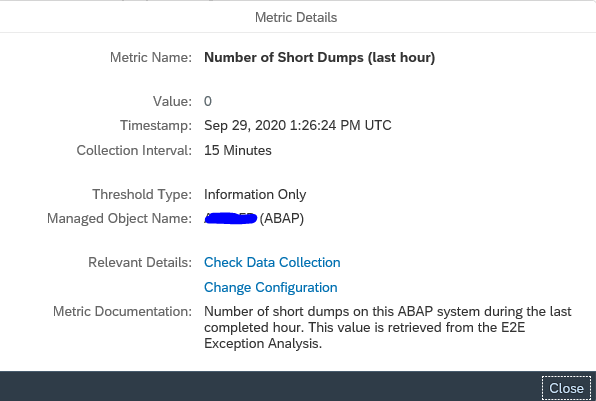
By clicking on a specific check you get the details for that check, which systems are not ok, and what the current value is in the system:

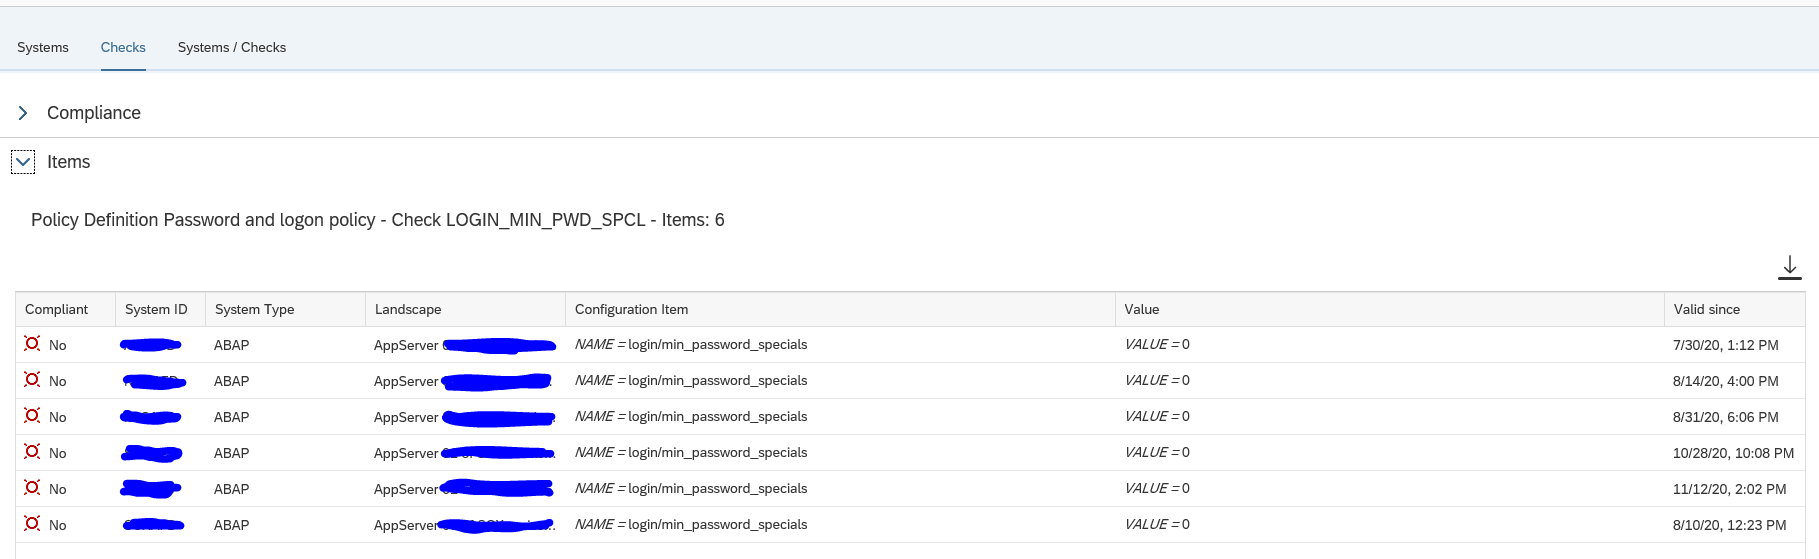
In this case the value 0 for special character is not ok. It should have been 1.

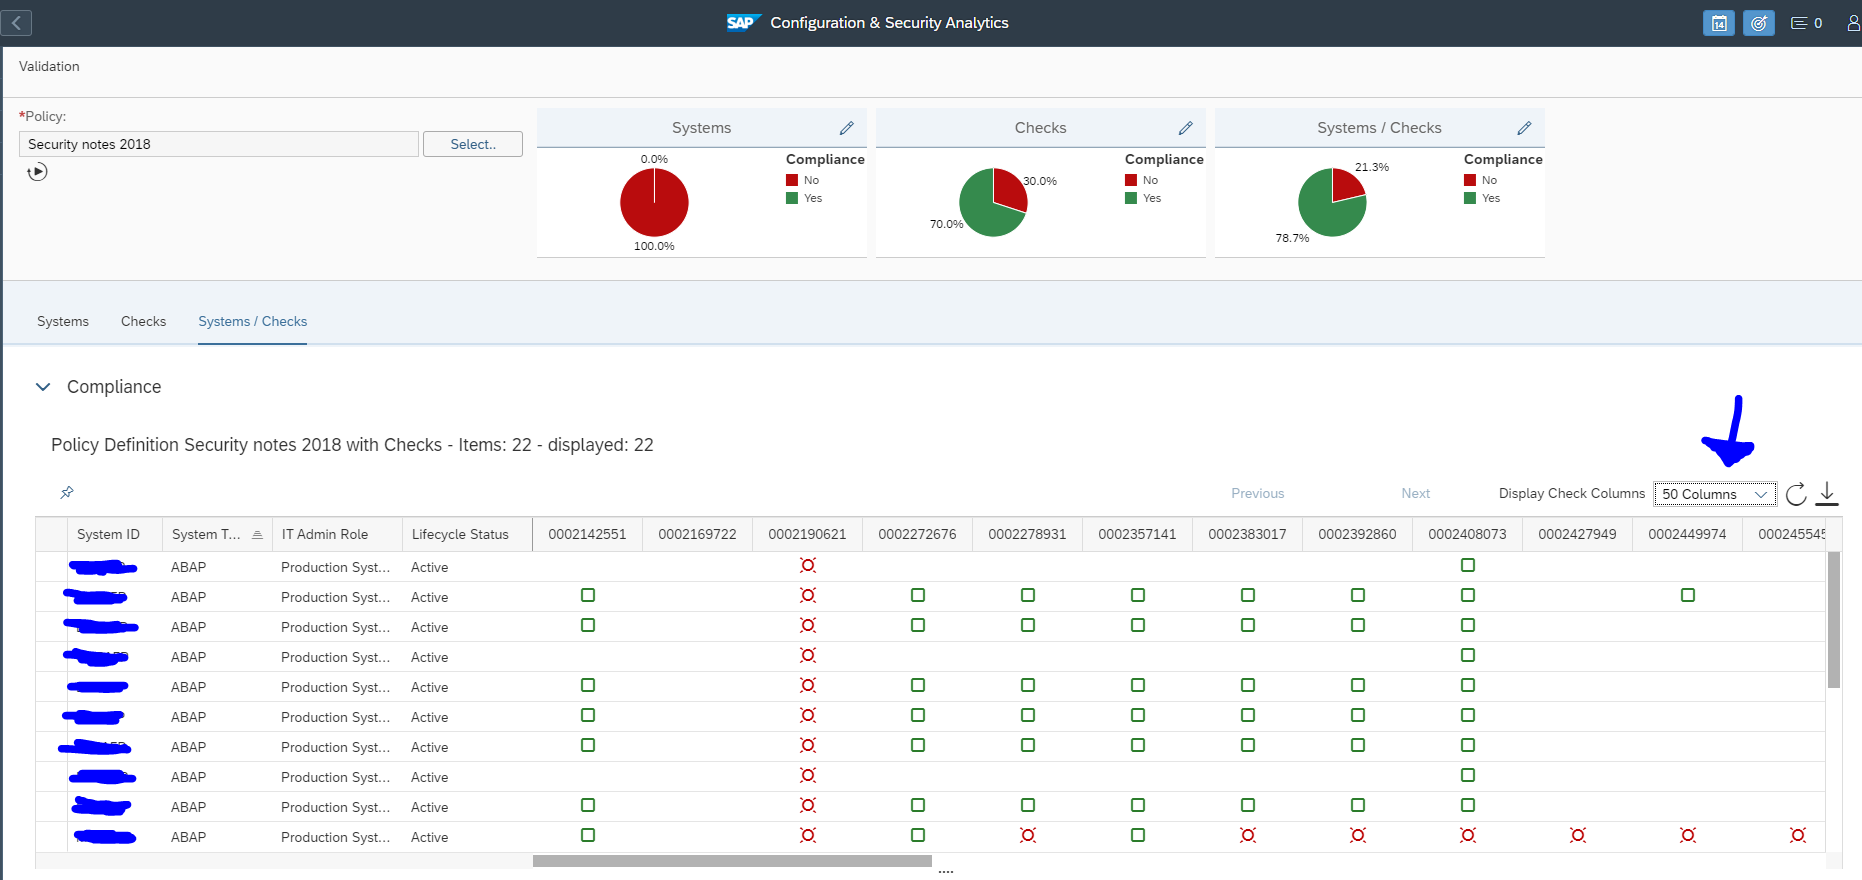
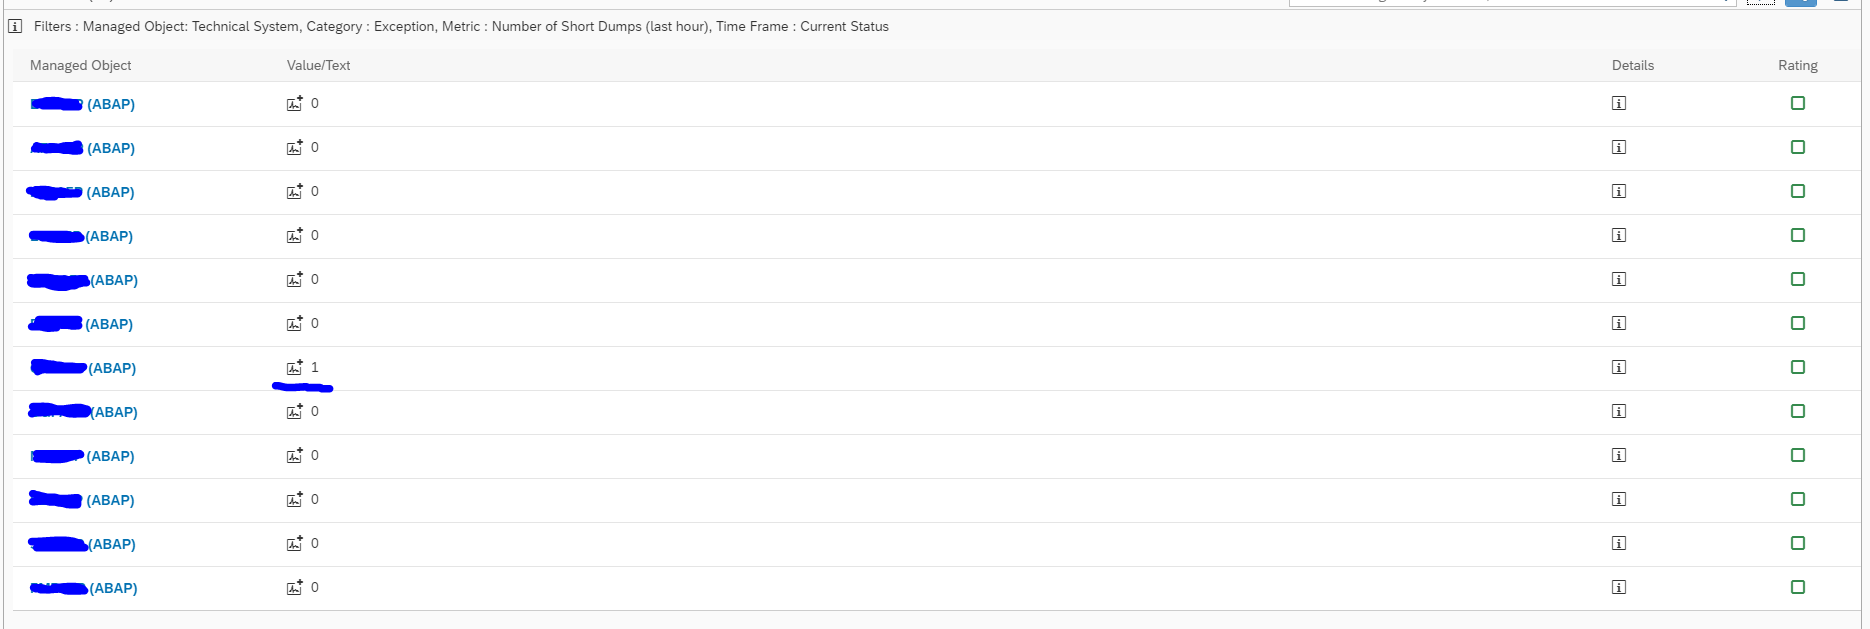
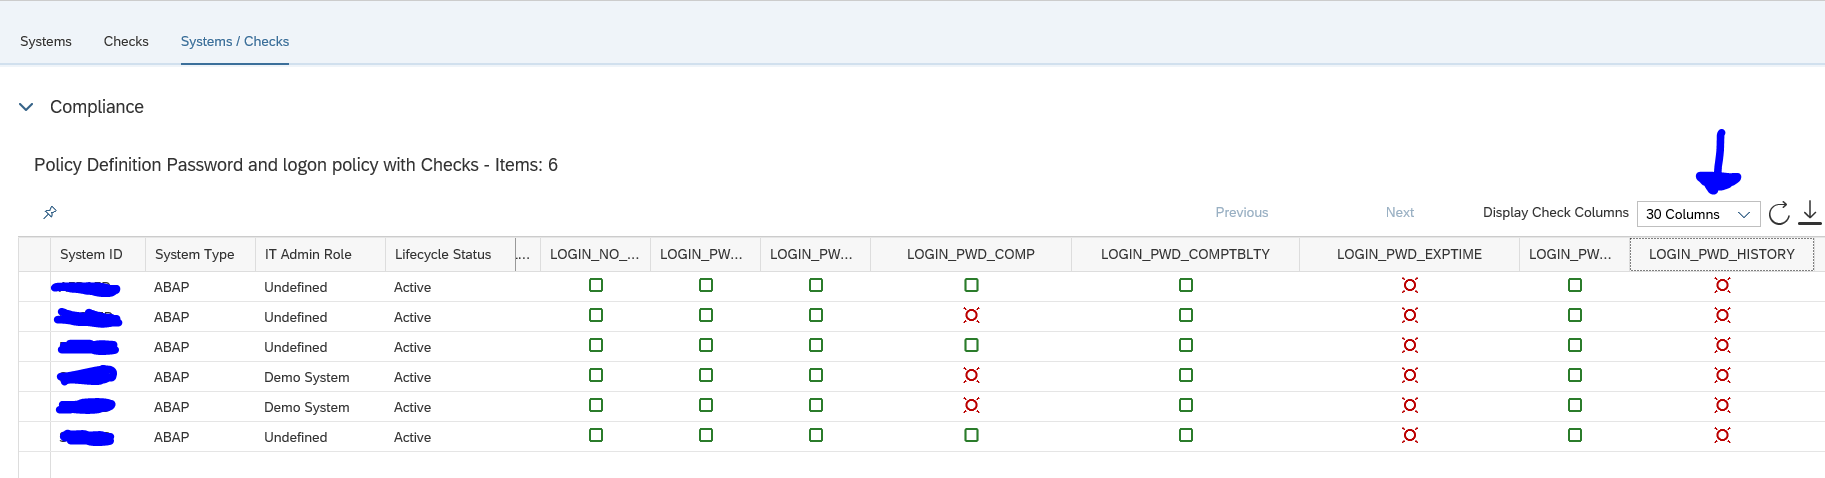
The tab System/Checks gives you an overview of all systems and all checks in one shot (you do need to expand the columns to more values):

Applying an exemption

Ideally you want to solve all the issue by changing the security parameters to meet the security baseline. This is not always possible. After agreement with your security team an exemption can be applied.

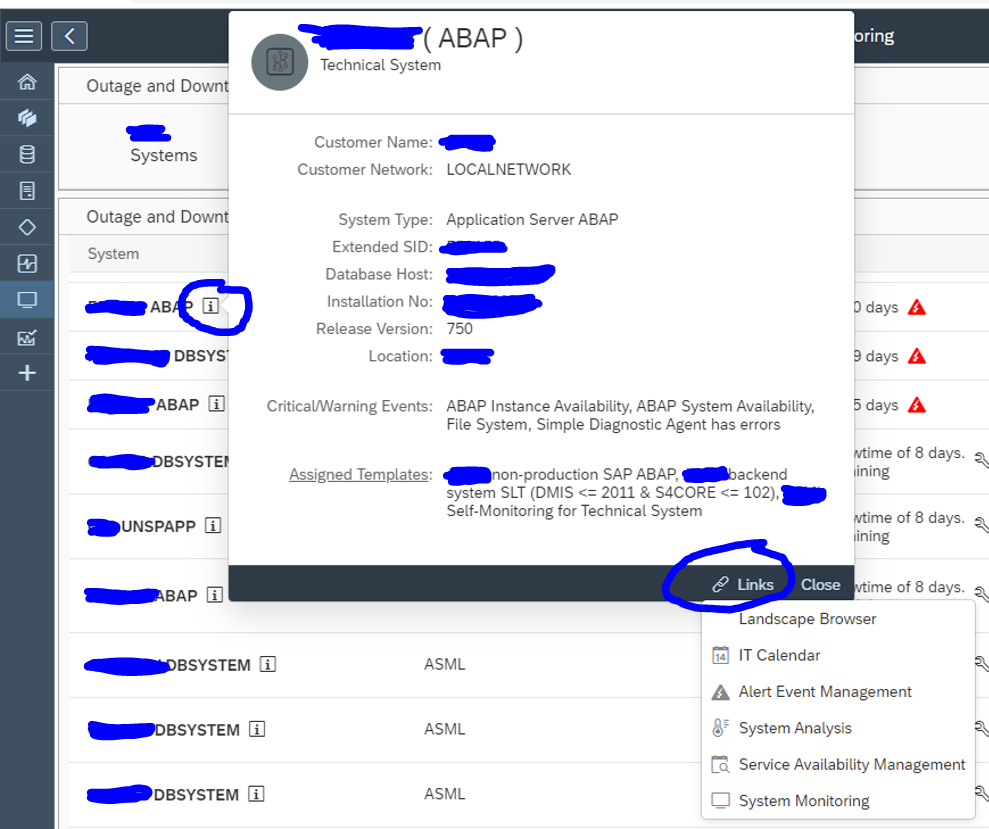
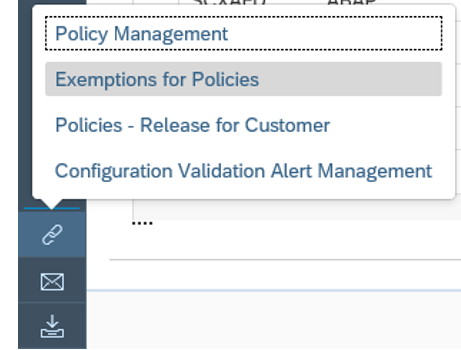
When you have done the security baseline run, click on the bottom left the Links icon and select Exemptions for Policies:

In the next screen press the create button to create an exemption:

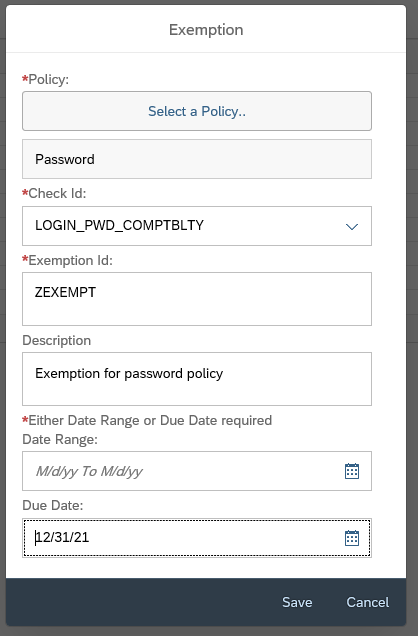
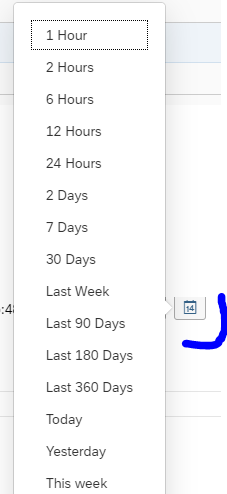
Select the policy and the specific check you want to exempt (in our case we use the logon password compatibility as example) and set a due date or date range for which the exemption is valid. By setting the due date, it is valid for all systems.

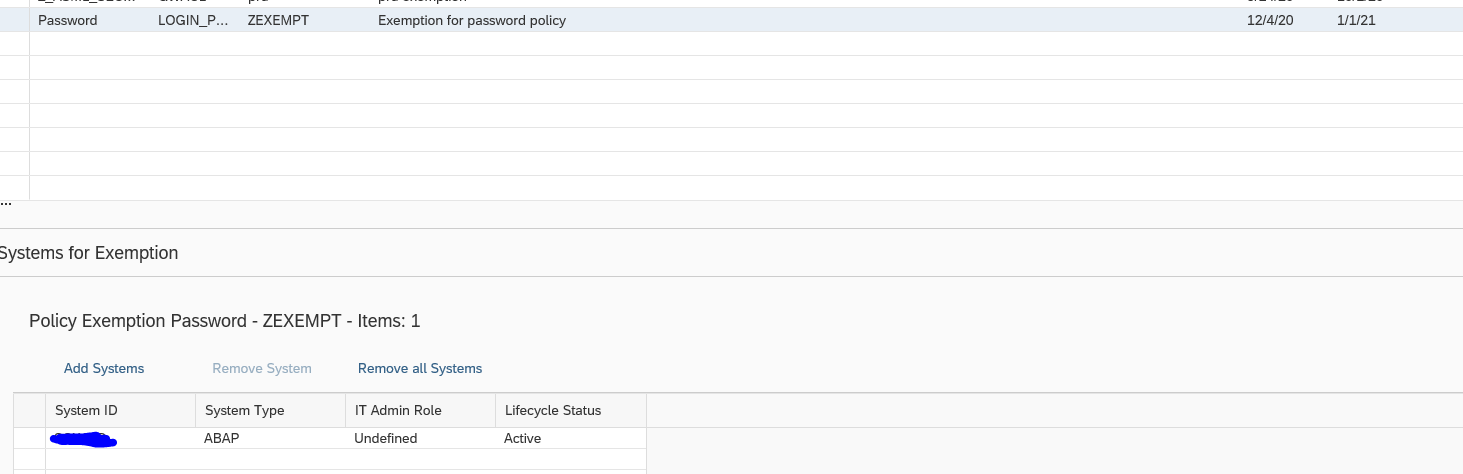
With a date range, you can make the exemption applicable for selected system(s):

Remark: this one is using date range!

Now you can run the security policy again:

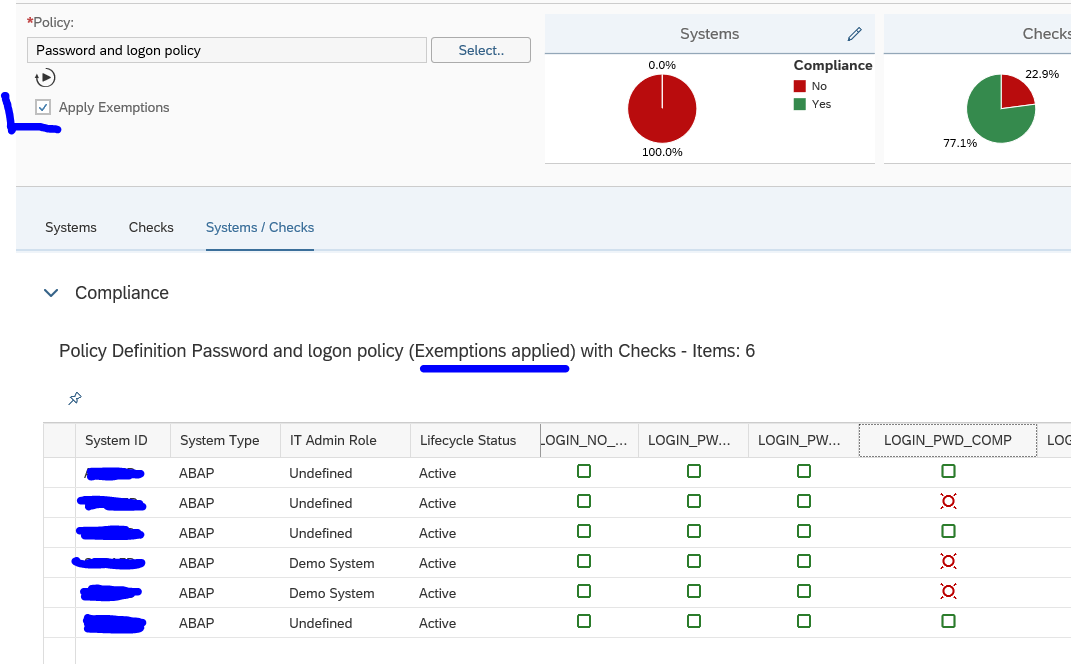
You can see in the text exemption have been applied. Also the tick box for Apply Exemptions has appeared. You can untick the box to run the policy without the exemptions.

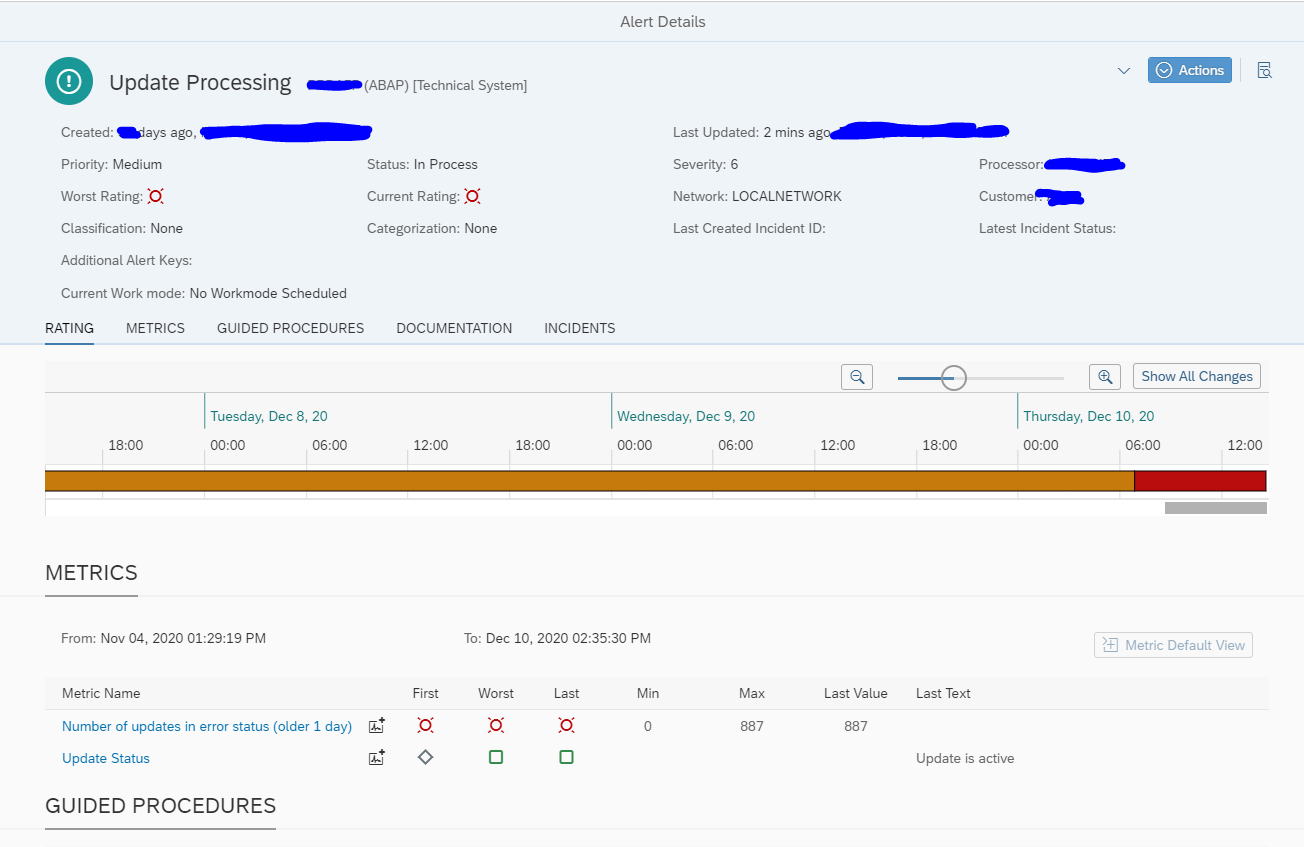
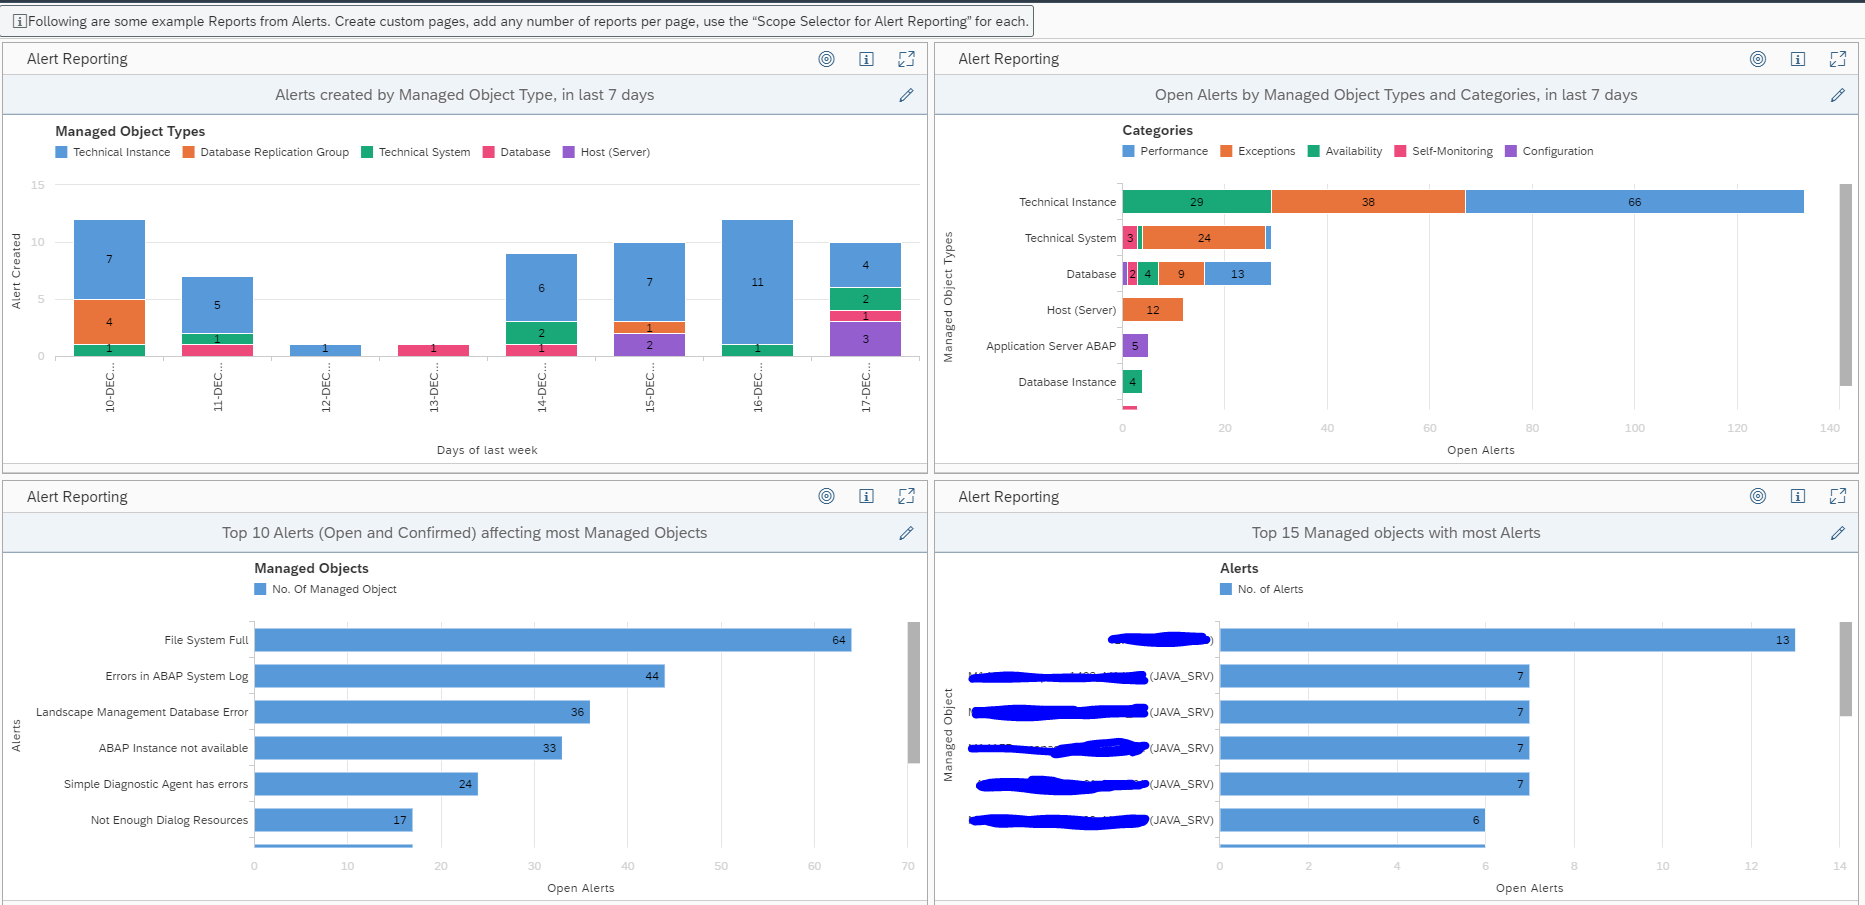
Alerting on non-compliant changes

Once you have everything under control and all green (meaning all systems are compliant to baseline, or exemptions are applied), you can set up alerting to inform you that a security parameter was changed into a non-compliant value.

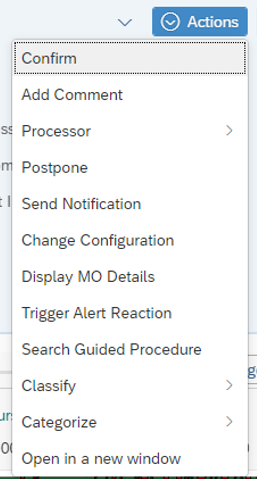
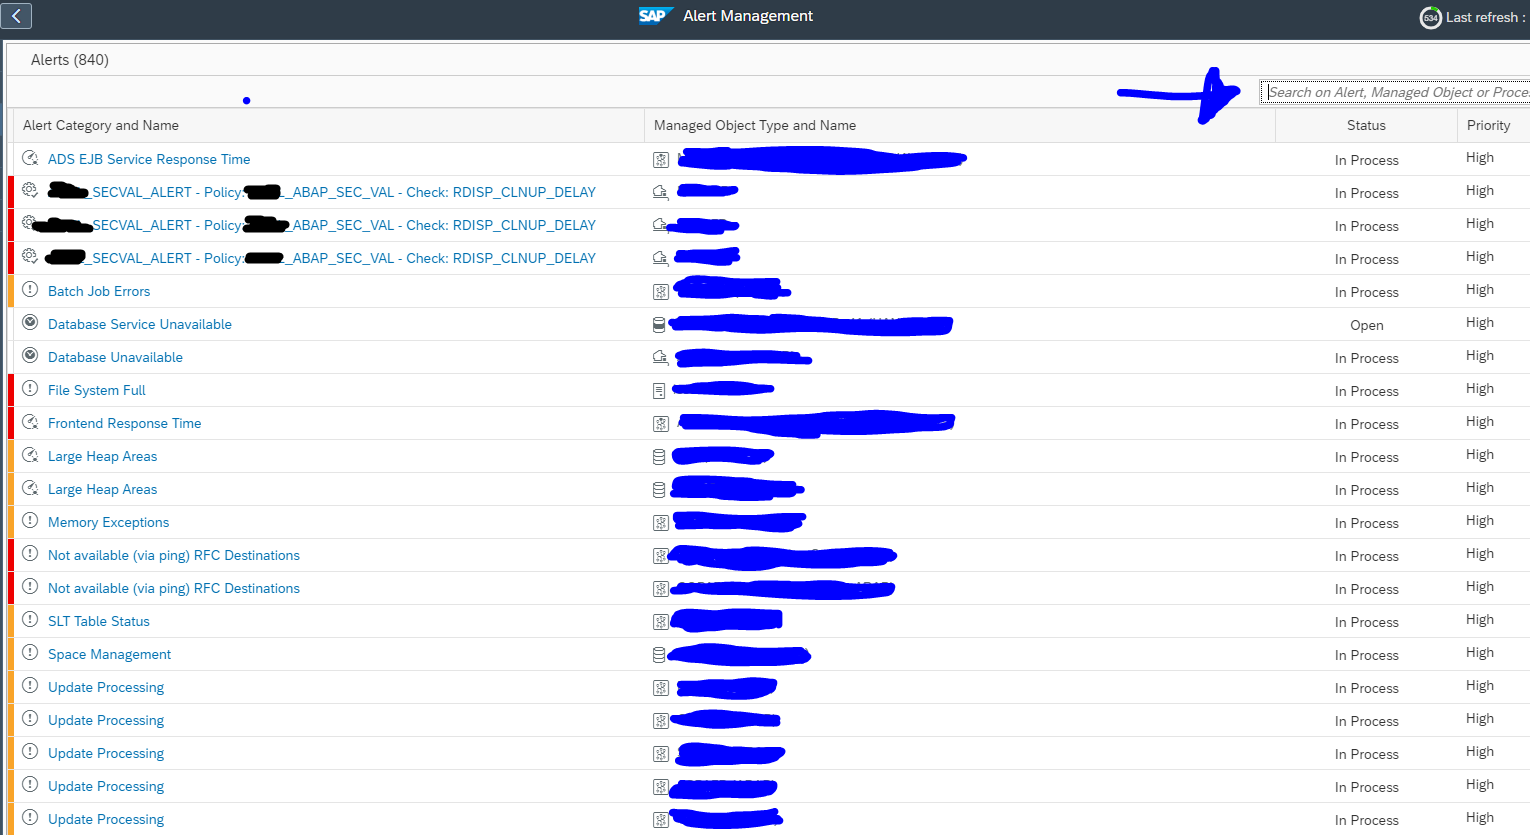
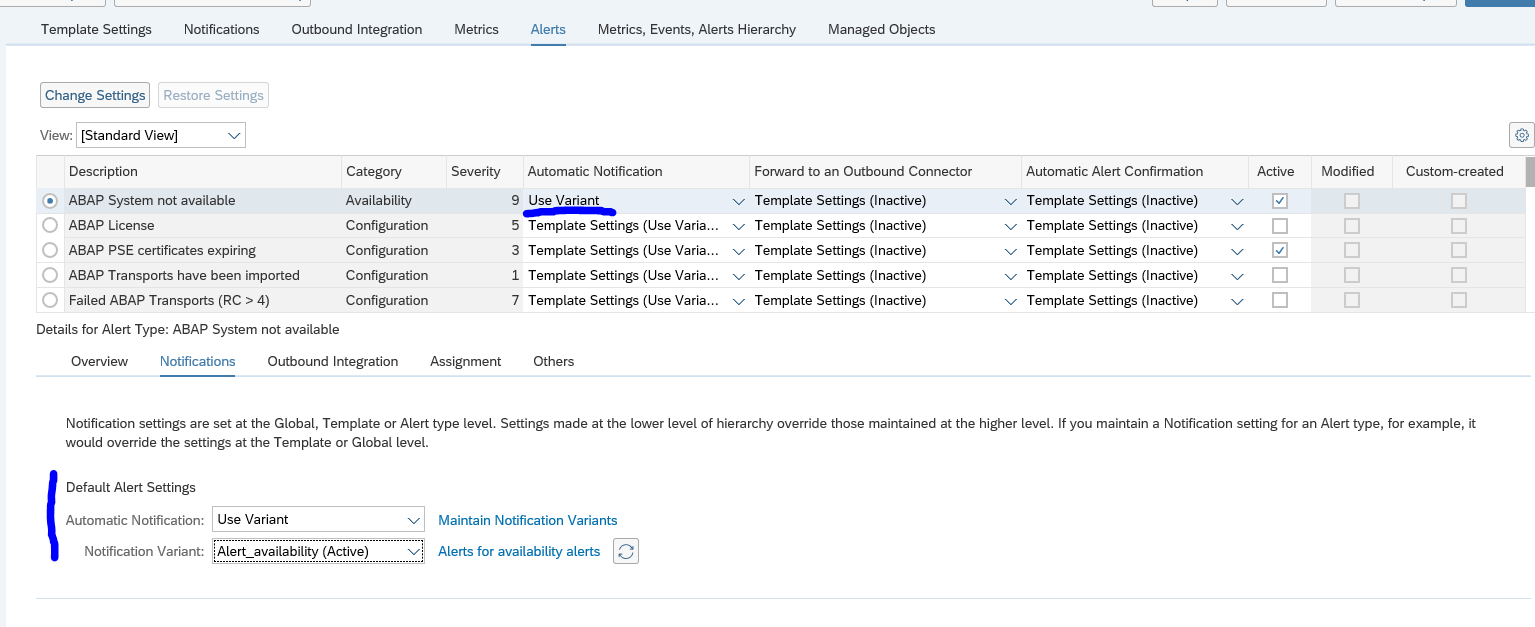
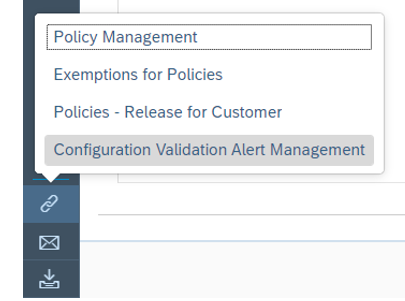
When running the check, go to Links on bottom left of the screen and select the Configuration Validation Alert Management option:

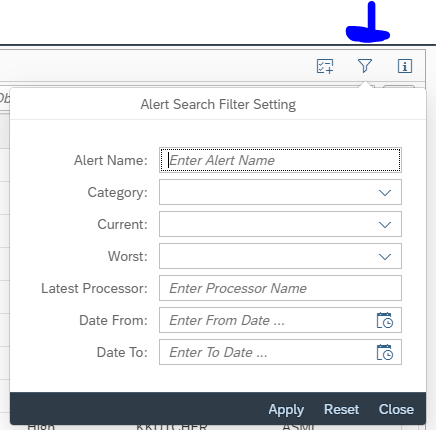
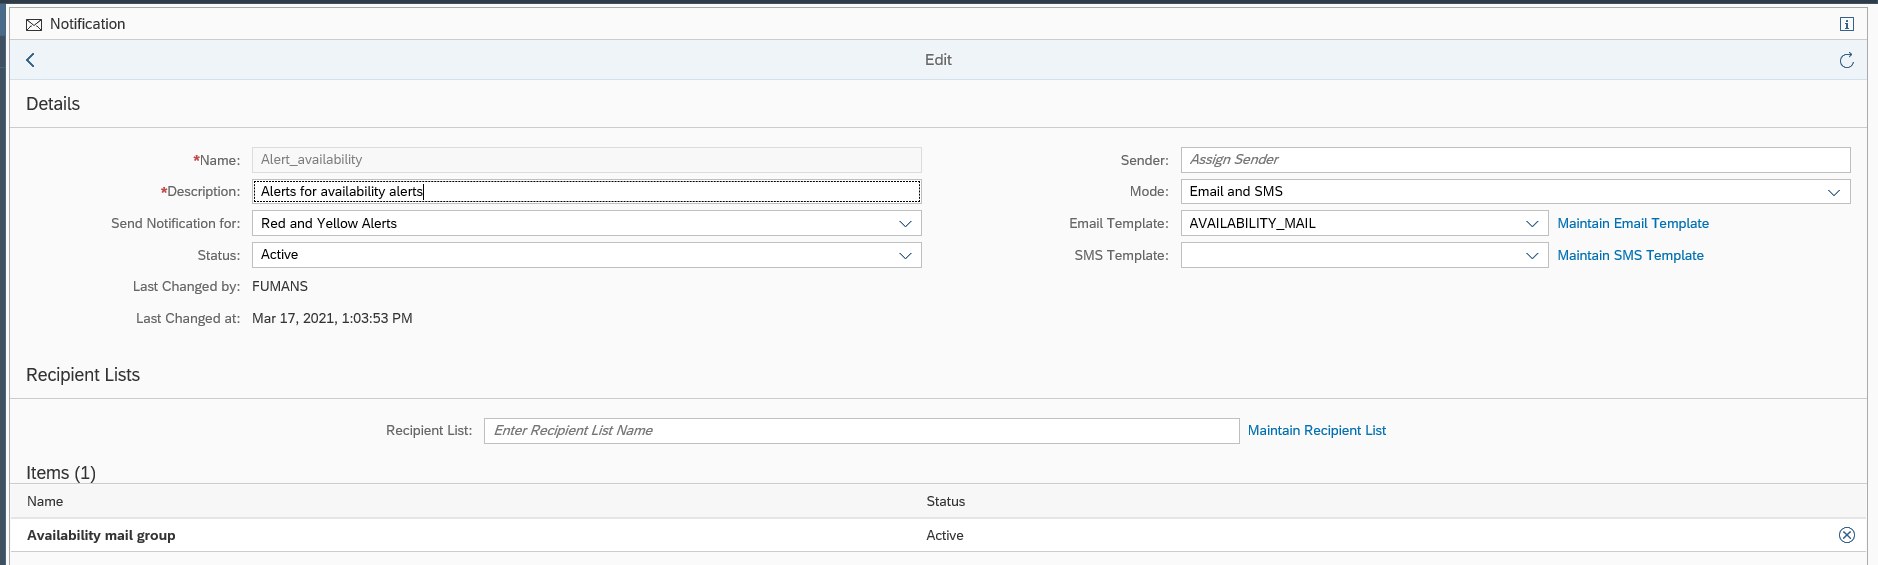
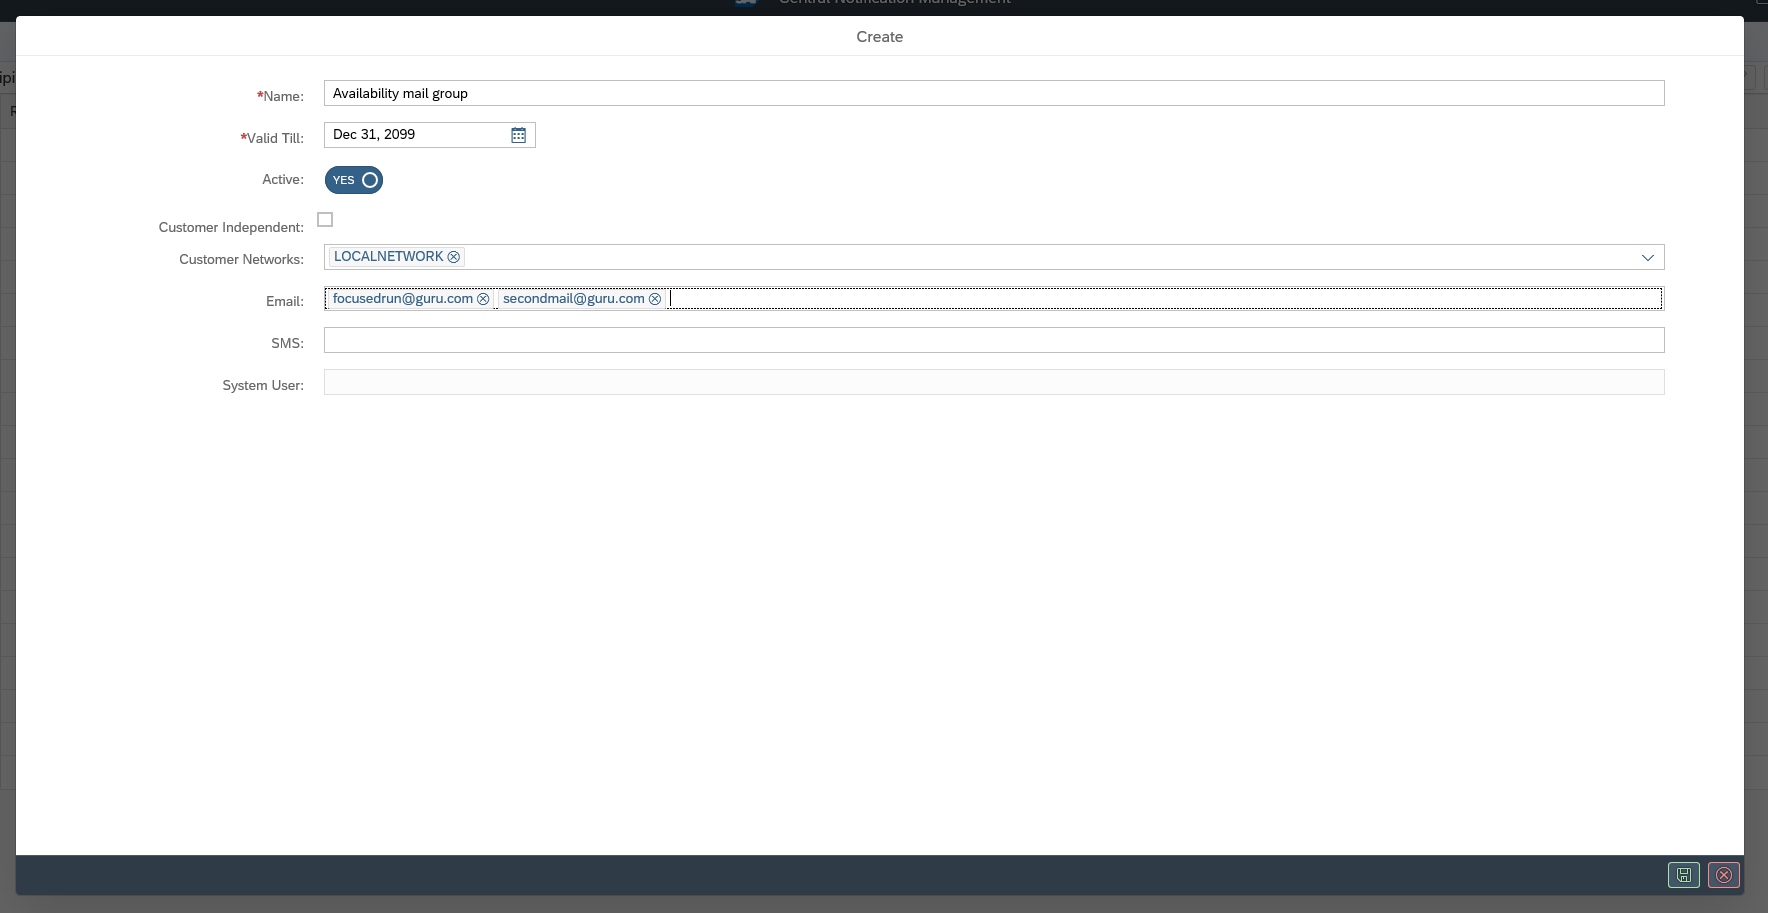
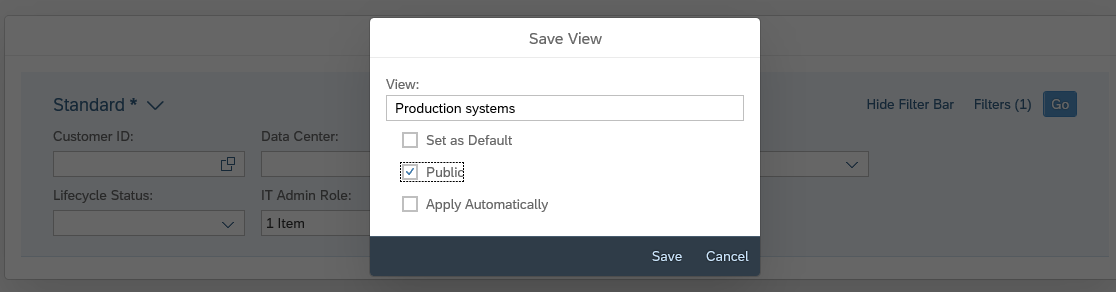
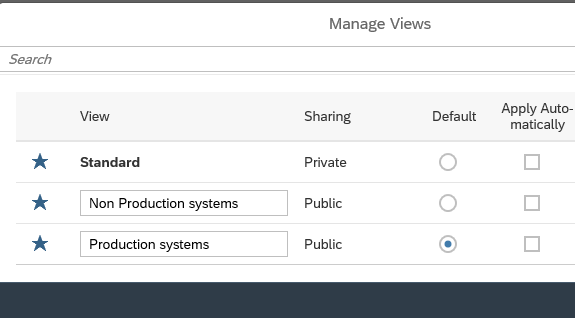
In the next screen now create a new alert:

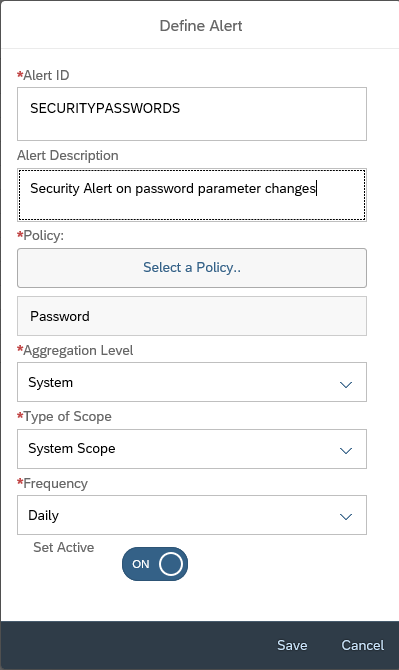
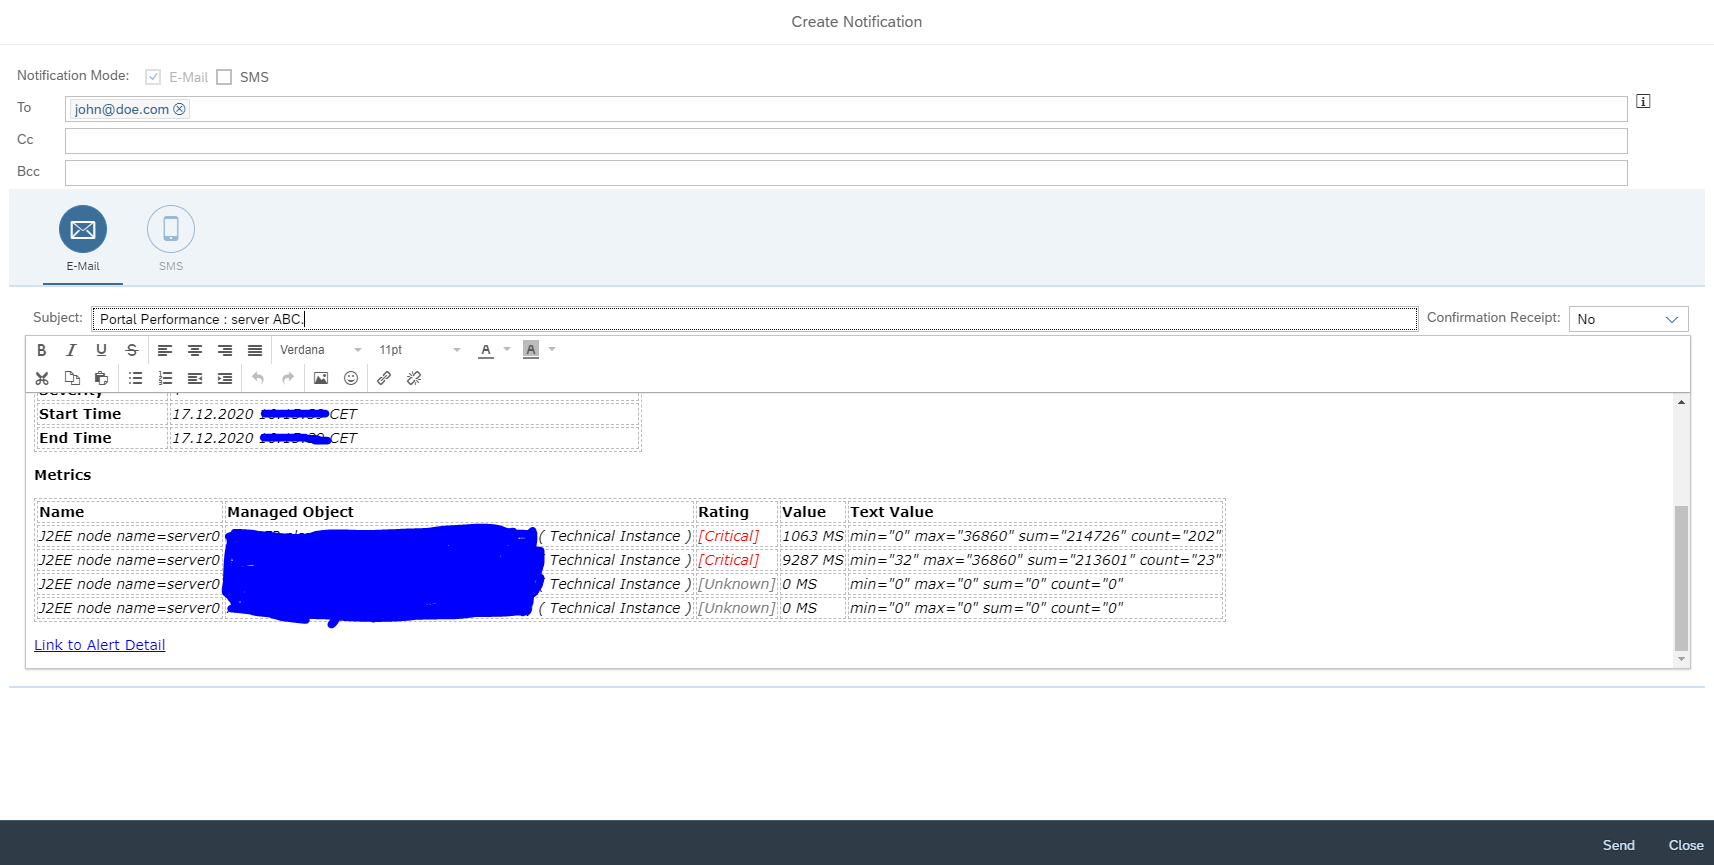
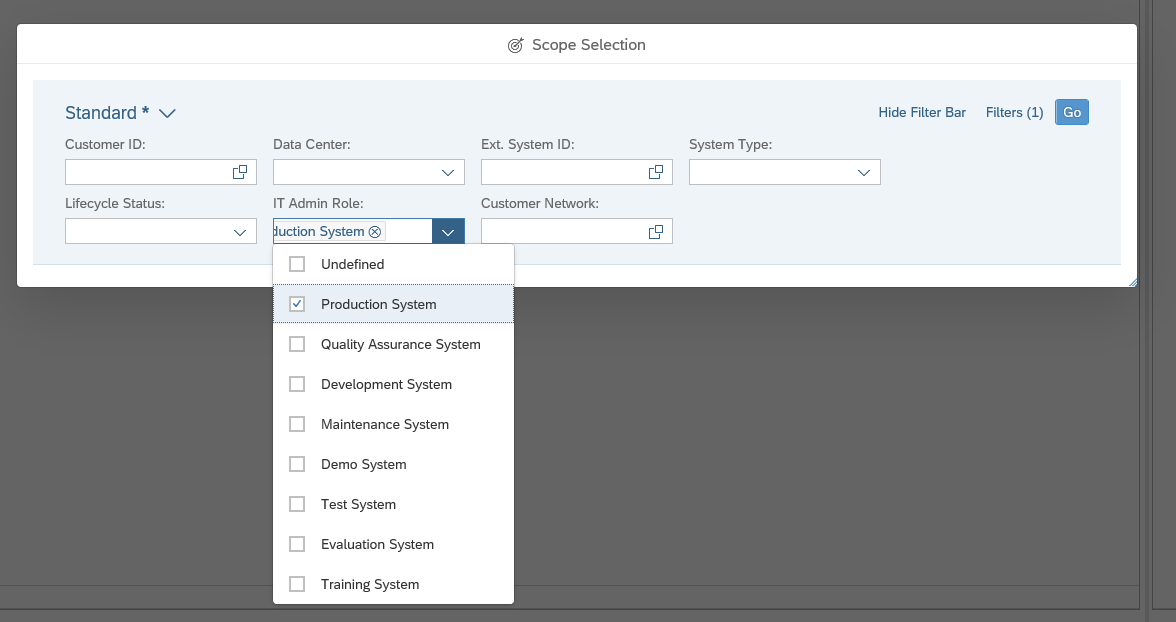
Important here: carefully set the frequency. Do select the System Scope. If you want to check ABAP systems for production only, do set this into the scope section. And Set it to Active. And Save.

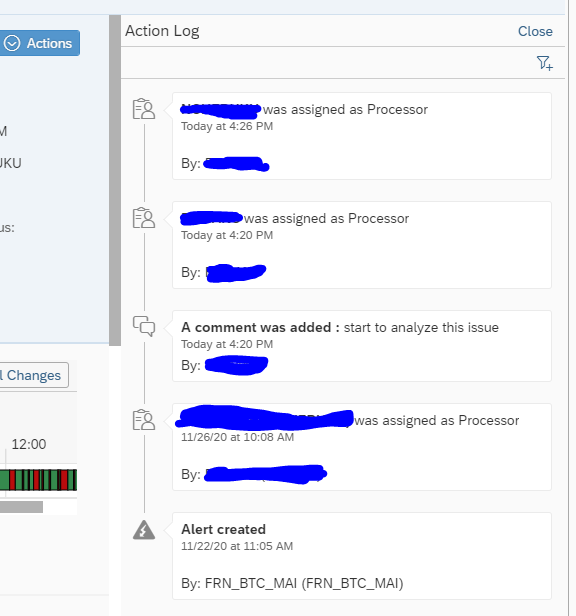
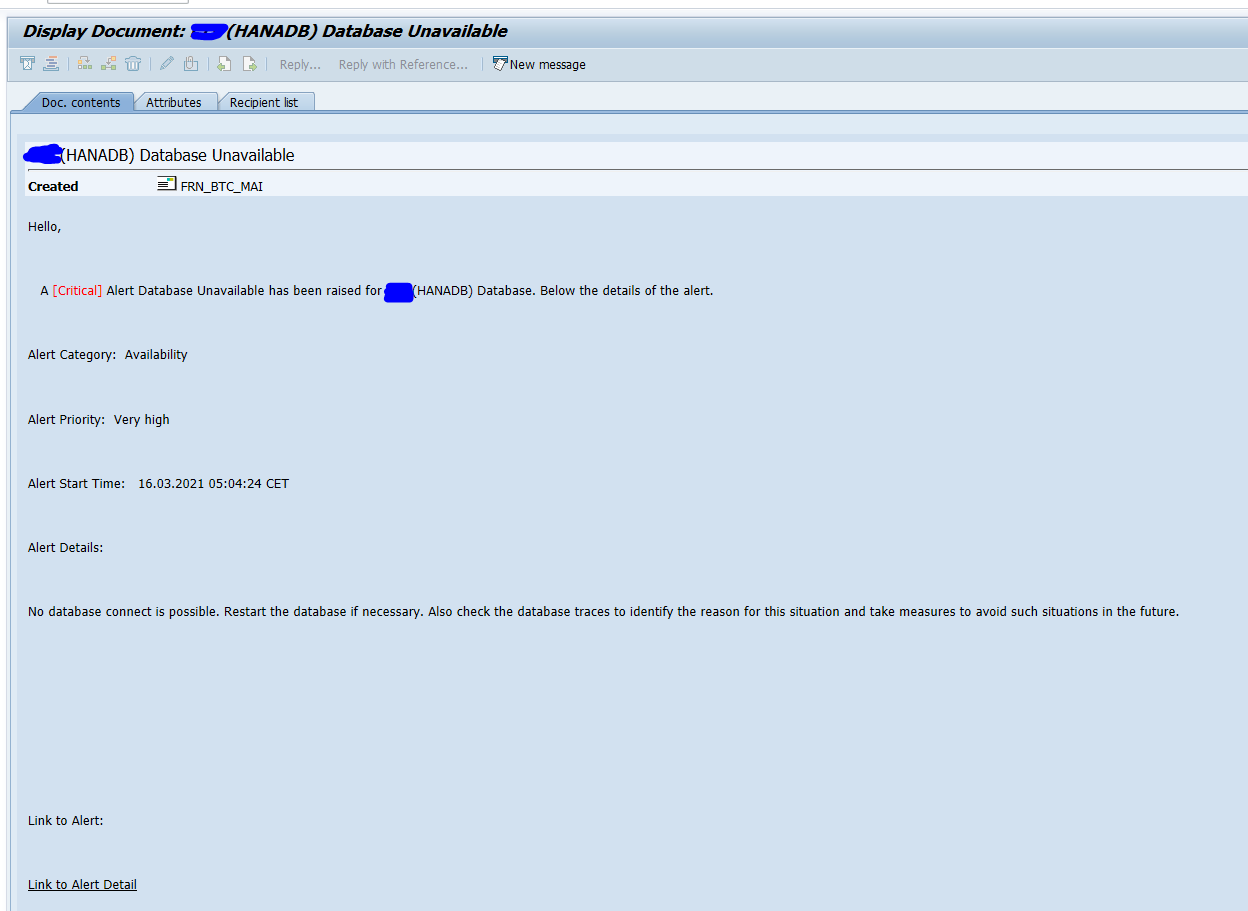
Every day the check will run and you will get an alert upon detecting a new non-compliant item for this policy.

More information on using the alert management function can be read in this blog.

How much policies should I create?

You can have as much policies as you like.

As a best practice, create one big one for your companies security baseline per system type:

  • All ABAP security parameters
  • All JAVA security parameters
  • All HANA security parameters

The initial setup might be quite some work, but once setup and cleaned up, the system will do all the work for you, and you need to check the alerts only.

For ABAP OSS notes you can also create policy files. See this dedicated blog.

For special cases you can create dedicated policies.

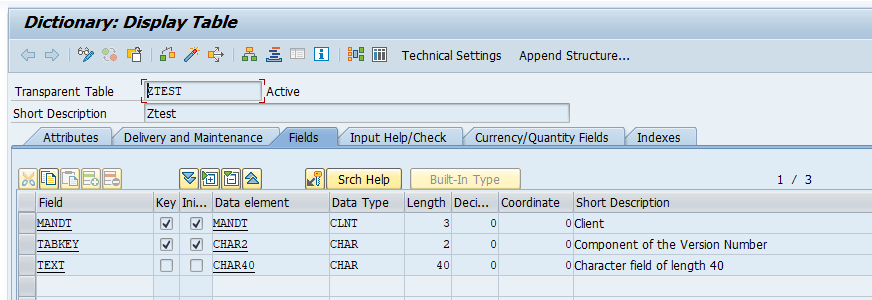
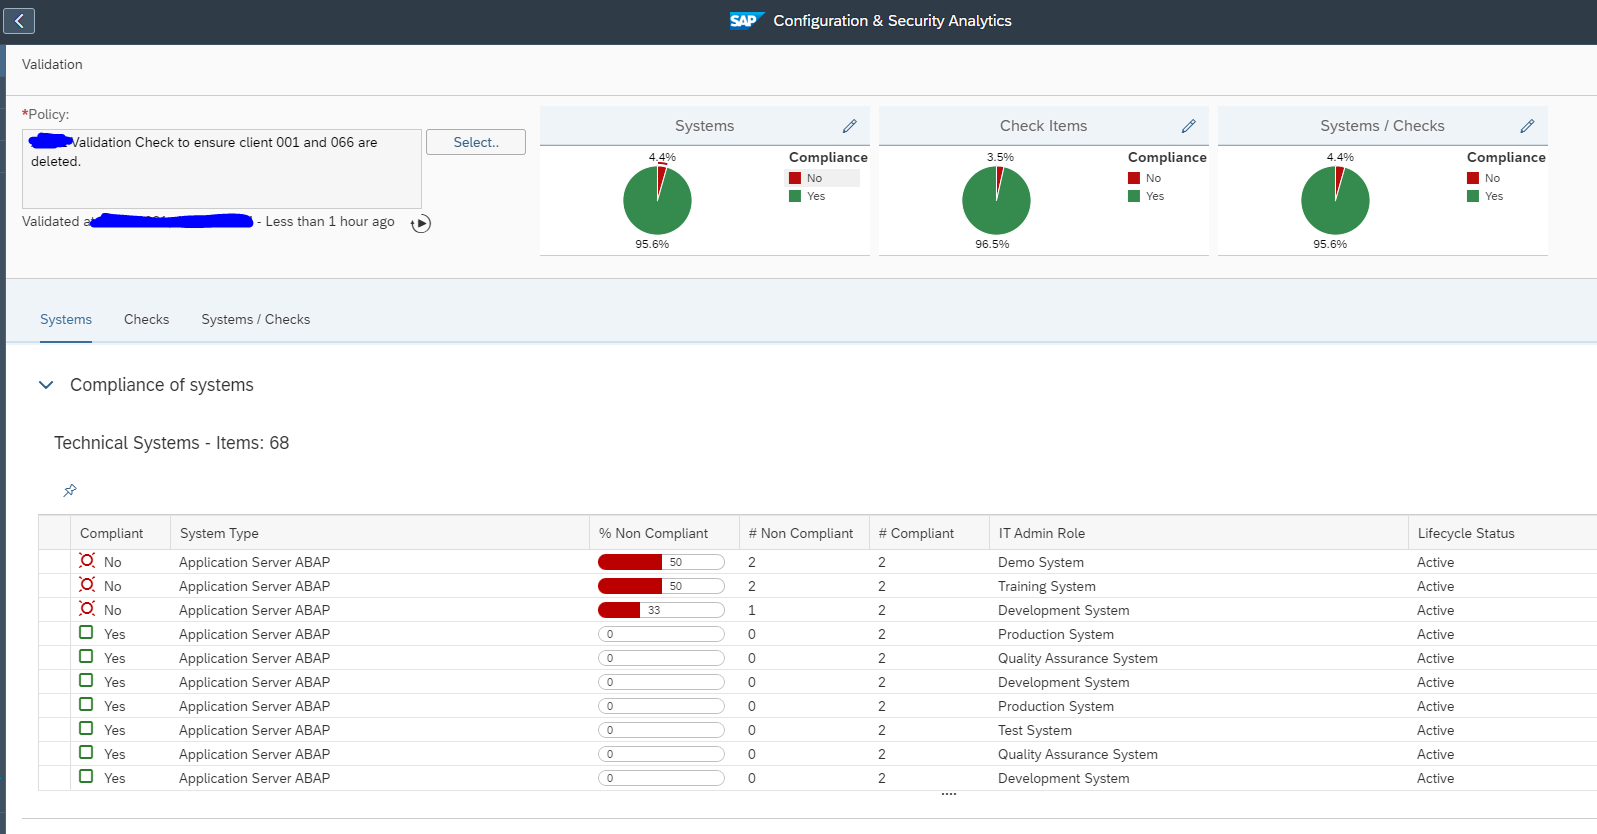
Use case for checking existance of client 001 and 066

Security & configuration validation can be used to check for the existence of clients 001 and 066.

The 066 early watch client and old delivery clients 001 are only security risks (unless in rare cases 001 has been chosen as execution client). Best to delete them from security point of view (see reference blog).

<?xml version="1.0" encoding="utf-8"?> 
<targetsystem xmlns:xsi="http://www.w3.org/2001/XMLSchema-instance" desc="Test CLIENTS Store" id="TEST_CLIENTS" multisql="Yes" version="0000" xsi:schemaLocation="csa_policy.xsd"> 
  <configstore name="CLIENTS"> 
    <checkitem desc="CLIENTS_CHECK" id="1.0.0.0"> 
      <compliant>
        MANDT = '000' or MANDT = '010' or MANDT = '100'
      </compliant> 
      <noncompliant> 
        MANDT = '001' or MANDT = '066' 
      </noncompliant> 
    </checkitem> 
  </configstore> 
</targetsystem>

In the compliant section add more clients that are valid and/or change the numbers to your own situation.

Basically the rule says: 001 and main client(s) listed are compliant. 001 and 066 are not compliant.

Result:

<< This blog was originally posted on SAP Focused Run Guru by Frank Umans. Repost done with permission. >>

SAP Focused Run security notes validation

In the blog on security and configuration validation overview, we have explained to run a validation of ABAP security notes against your systems using Focused Run configuration and security validation.

Questions that will be answered in this blog are:

  • How can I quickly run an entire year of security OSS notes versus my systems?

SAP github with security policy source files

SAP publishes files for the ABAP security notes each month on the SAP Focused Run Best Practices GitHub:

Here the policy files for the ABAP security notes are stored per year and per month.

Not all security notes for ABAP stack are in these files: only the ABAP notes which can be applied via SNOTE. Security notes for ABAP stacks which require parameter changes or patches are not part of this check!

For convenience I have collected the files per year.

These files are for convenience only. It can be I made a mistake in assembling them.

Uploading the files

Goto the Configuration validation policy maintenance Fiori tile:

Create new policy and copy paste the text from the file:

Do this by choosing Edit and copy and paste the text in the editing section:

Now Save the policy. Check the XML. Generate the policy and check it by pressing Test Policy. Note that these are large files with many checks, so the testing can take some time. Run can be done via the Validate button or by following the instructions below.

Running the Security notes checks against the connected systems

To run the checks, goto the Configuration and Security Analytics Fiori tile:

Select the policy file to run:

Now be patient until the results are ready.

Make sure you expand the amount of columns.

If an ABAP notes is not applied it does not mean your system is not safe. You have define for which CVSS score and which systems you want to apply the security OSS notes, within which timeframe.

More on CVSS score see OSS note 2463332 – Security Note CVSS vector computation – SAP Solution Manager 7.1 and 7.2 and this SAP blog explaining the CVSS scoring in general.

<< This blog was originally posted on SAP Focused Run Guru by Frank Umans. Repost done with permission. >>

SAP Focused Run alert management overview

The alert management function is a central alert inbox function for SAP Focused Run. All alerts from all tools are coming together in the alert inbox.

Questions that will be answered in this blog are:

  • How does the alert inbox work?
  • How can I get a good overview of all the alerts?
  • How can I mail an alert?
  • Which actions can I perform on an alert?
  • Can I set up my own alert dashboard?
  • Can I have Focused Run automatically confirm some of the alerts, when the system detects all is ok again?
  • Which alerts are sent to the Alert inbox?
  • How to organize alert handling?
  • How to execute alert review?
  • How to reduce the amount of open alerts?
  • How can I configure Focused Run to send mails for specific alert situations?
  • How can I setup multiple mail receivers?
  • How can I setup multiple mail groups?
  • How can I change the layout of the mail?

Alert inbox

To open the Alert Inbox, click on the Fiori tile:

Don't let yourself be distracted by the high number. This is the total unfiltered amount of alerts. It will contain alerts from production and non-production systems. It will be important and non-important alerts.

Now the open alert overview dashboard will open:

There is a lot of information on this screen.

Top left are the open alerts by source. This means the open alerts by application, instance, database. In the middle top are the open alerts by category (like availability, exceptions, etc). Top right is the open alerts by current rating. Bottom left is the top type of open alert by type of metric that is causing the alert. Bottom right is the distribution of open alerts by age.

The alerts are centralized and can have diverse sources:

Processing an alert

From the overview you can choose two ways to start:

  1. On the top right section click on the Critical alerts that are currently still open.
  2. On the left, select the open alert list icon:

Both options will bring you to the list of open important alerts:

The sorting is done from Very High and then High, etc, already. The most important open current alerts are on top. This list can also be exported to Excel.

Clicking on an alert will open the details:

Here you can see the history and current status. It can be that the alert is till red, but it can also be that Focused Run detects that the current situation is now ok. It will still leave the alert open for you to analyse and confirm.

You can click on the Actions button to get the follow up action menu:

  • Confirm the alert will close the alert.
  • Add a comment: add text to the alert.
  • Add or change a processor: assign a user ID who should pick up the alert and is responsible for the alert.
  • Trigger an alert reaction (for example to SAP solution manager IT service desk or outbound integration to for example ServiceNow)
  • Send notification will give you the option to mail the alert:

Using the action log button:

you can see the action log for the alert:

Alert handling

An alert is sent to the alert inbox. But for each alert you can configure as well if an alert is e-mailed, and/or send to external tool like ServiceNow.

The alert inbox has a scope filter just like all the other Focused Run tools. Use it to filter the alerts for you most important systems (most likely the productive systems, or even filter on the core S4HANA and/or ECC systems).

Depending on your organizational structure and amounts of systems, you need to agree on how you handle the alerts. Aspects to be taken care of:

  • Prioritization of alerts; which ones go first? Solutions:
    • Use filters for important systems
    • First red alerts, then yellow alerts
      • Fine tune alert thresholds to reduce invalid red alerts
  • Assign processor or not: for larger teams do assign a processor to keep track
  • Fill out comments for alerts that take longer to solve, so you track what has been done
  • Consider to postpone alerts that require a change to get fixed (and the change takes a longer time to implement)
  • Using the SLA functions or not?
  • Who is allowed to confirm an alert?

Alert review

You can use the initial alert dashboard, or the alert reporting overview, or create your own dashboards:

The overview shows the open alerts:

Clicking on any colored bar will bring you to the detailed list. From the list you can filter down to the details.

At the start of your SAP Focused Run implementation you should at least weekly review this. It gives you insights into:

  • The type of alerts most frequently popping up
  • The systems that generate the most alerts
  • The average time an alert is open

When you are getting more mature and used to solving the issues

Open alert reduction

To reduce the open alerts consider this sequence:

  • Solve the issues in the systems: clean up, apply permanent solutions
  • Fine tune the metric thresholds for false alerts, and classify not so important alerts as yellow: keep red for the important alerts
  • Work on the resolution time: also here, focus on the red alerts which are important

Bad practices (often deployed by KPI drive service providers):

  • Increase thresholds, without clean up or without solving the issues permanently
  • Simply close each repetitive alert fast without checking and solving the root cause for repetitive failure
  • Only look at subsection of the alerts
  • Don’t look at self monitoring items (without solving self monitoring issues)
  • Blame Focused Run for having bugs (without looking for OSS notes and without reporting issues)
  • Don’t confirm the alerts (so they keep open and don’t send new mails, or don’t create new ServiceNow tickets)

If you are confronted with such a service provider, use the alerting reporting tools also for the closed alerts to find evidences of such behaviors.

Missed alerts

After incidents you have (mainly in your productive system), check if Focused Run generated the proper alert or not.

Cases that can happen:

  • Focused Run did alert the situation, but it was not picked up fast enough by the processors: organizational measures, or consider the mail sending option
  • Focused Run did measure the situation, but the alert was not configured (for example batch job alert was not set)
  • Focused Run did measure the situation, but the threshold was not reached: lower the threshold in the template
  • Focused Run did measure the situation, but it was not specific enough. This can happen with SM21 system messages. Consider creation of very specific custom metrics for specific messages (for example for application server connectivity loss to database).
  • Focused Run did not measure the situation: check if you can activate an out-of-the-box monitoring item for the situation. Not all measurements are active in the templates by default. If no out-of-the box exists, consider creating a custom metric. Or check if you can monitor side-effects of occurring bad situations.

The goal of this analysis is to keep improving the alerting accuracy: alerts should not be missed and valid (not false).

Automatic confirmation of alerts

For some type of alerts, you might want to activate the automatic confirmation. This automatic confirmation is set at template level. Read this blog on the details. If it is set, the alert will still be created. The alert will remain open until the system detects the issue is gone. If gone, the system will automatically close the alert.

Alert management search

With the looking glass left you goto the Alert search overview. Here you can search in any way you want on the alerts, including free text search:

Top right you select extra specific filter criteria:

Custom alert page

By clicking on the + icon on the left button bar, you can add your own alert page:

The UI is the same as for the tactical dashboards.

Mailing alerts

Setting up alert consumer

First we will set up the alert consumer. Goto the Alert Consumer Variant configuration tile:

In the next screen click on the Plus symbol to create a new Alert Consumer:

Initially there is no mail template and no recipient list.

We will create these in the steps below. When these are created, they can be used in the drop downs. Save the consumer and don’t forget to put the status to Active.

Maintain recipient list

From the alert consumer screen create a new recepient list:

Give it a name and add the e-mail addresses for the group. There can be one or multiple. Save the list.

Maintain e-mail template

Create a new e-mail template:

On the left hand side you can see the variables you can use. On the right hand side you construct the mail template. Preview is possible but shows limited functionality only. Save after you are happy with the mail.

Using the alert consumer

Now we have created the alert consumer with the mail template and recipient list. We can goto the monitoring template maintenance to assign the alert consumer. In the alerts tab of the template that you want to alert on, goto the Alerts tab:

For the type of alert switch the Automatic notification to Use Variant. In the Notifications tab below, you can now assign the created variant. Save the settings.

After the template change: do not forget to Apply and Activate the template for use.

Testing and mail sending

To test your settings: use a development system or sandbox to test your event. Then check in SOST that the mail is properly created:

<< This blog was originally posted on SAP Focused Run Guru by Frank Umans. Repost done with permission. >>

SAP Focused Run system monitoring overview

This blog will give you and overview of the functional capabilities of the System Monitoring in SAP Focused Run.

Questions that will be answered in this blog are:

  • What are the main functions of System Monitoring?
  • How to zoom in on systems and specific metrics?
  • How to optimize the scope selection?
  • How to use the tabular view?
  • How to check a specific metric across multiple systems?
  • How can I quickly get an overview of all my systems that are down?

System monitoring top down approach

From the Advanced System monitoring group in Fiori launchpad, select the System Monitoring tile:

Now select the systems in the Scope Selection block, for which you want to see the monitoring data:

Select Go when you finished your filtering. You now reach the overview screen:

If you want to zoom in click on one of the numbers, or select the Systems button from the left hand toolbar:

The traffic lights indicate where the issue or issues are: availability, performance, configuration or exceptions. If you want to go directly to an alert click on the alert number. Alerts are explained in full in this blog.

Click on a single system in the left column to open the system monitoring view for a single system:

On the left hand side, you can see the application (in this case ABAP) on top. You can also see the database (HANA) and application server, CI and their hosts. On the right hand side in a tree structure you can see the diverse checkpoints and issues in the system. The checkpoints are called metrics and they are clubbed together into logical blocks (like system exceptions, performance, availability). In this case there is a system exception due to too many short dumps today.

You can open the graph for this metric to see the details in time:

By clicking on the start and to date, you can select the date/time range or use the Select Time Frame button for a predefined time range:

Optimizing scope selection

In the scope selection of systems, you can create a few variants to speed up your work.

In this example we will setup a variant to quickly select all productive systems. In the scope selection block select the IT Admin Role for Productive System:

Now select the down arrow next to Standard in the top left corner and select Save As:

You can choose to set this variant as default. Setting it as public will make the variant available for all users. Selecting the Apply Automatically tickbox will apply this specific variant immediately. This might be preferable, or annoying. Just try it.

Upon pressing Save you will get a request for transport popup or save it as local request.

You can also create a similar view for non-production systems.

In the end you can always press the Manage button to change the variants and texts:

Now you can easily switch between scopes for production and non-production:

How to set IT admin role of systems in LMDB

This chapter will show how you can set the IT Admin role of a system in LMDB. Goals is that you can use it easily as described above in the scope selection.

Go to the LMDB Object Maintenance Fiori tile:

Search for your system:

Select the system and press Display to open the detail screen:

Press Edit to change. Now change the IT Admin Role and press Save.

Using the tabular view

In stead of using the hierarchy view, you can also switch to the Tabular View:

In this view you can for example sort the items on a column like the traffic light:

Or you can apply a text filter to search for a specific metric:

Checking a metric across multiple systems

If you have an issue in one system, you might want to quickly validate if you have similar issue in different systems, or you simple want to compare with different systems. From the monitoring of a system select the metric.

For this example we selected Short Dumps:

Select the i button to get the explanation text:

This gives the exact name:

Now goto the metric tool:

If you don’t see the correct metric, use the metric selection filter on the top right of the screen:

Press Apply, and you get the overview of this specific metric across all systems in your selected scope:

Storing metric data longer

Focused Run stores the monitoring data 28 days. If you need the data for specific metrics and systems longer, you can make use of the aggregation framework.

Start the Fiori application for Advanced Configuration of System Monitoring:

On the left hand side choose the option Aggregation Framework:

Choose the button Create Variant to create a new variant:

Fill out the name and basic description and press the Continue with next step button:

The next screen is bit more complex:

In sequence: first search for the extended system ID and press go in the top left section. In the bottom left section, select the system you want. In the top right section now select Add filter from the left button. And press the Add selected objects for aggregation button on the bottom right part. Now press the Continue with next step button:

Select the metrics on the left hand side and add the filters on the right hand side. When done press the Continue with next step button:

Using the aggregation framework

For using the aggregation framework there are no special requirements. Whenever you use an aggregated metric in system monitoring, you can simply use the details with a long period.

Settings for the aggregation framework

In the aggregation framework configuration screen, you can click on the configuration wheel top right to set the retention period for Short/Medium/Long:

System down monitor

A special function is System Monitoring is the System Down Monitor. This overview directly gives an overview of the systems that are considered down by SAP Focused Run and the systems which are set to having maintenance.

In the system monitoring screen select the System Down monitoring icon on the left icon bar (here indicated with the arrow):

You can see systems that are down and which ones that are having planned maintenance. If you have set up the SLA management, it will also show that aspect.

If you want to zoom in on the issues, press the i icon right of the system. Then select Links to go to the respective tool for further investigation:

For systems down the best tools are usually the System Analysis and the Alert Event management.

Changing settings

You can change the layout settings with the glasses icon:

You can show/hide the SLA and charts section as per your need.

Definition of down

The definition of down is in Focused Run: any red alert in the availability metrics. This can be:

  • Complete system down
  • One of the application servers is down
  • A core function is down (for example ABAP stack is up and running, but the Https port is not available)
  • Important subfunctions are not working (for example in the SLT system 1 or more source systems can not be reached)

Summary

The overview above gives the top – down approach in full: from the total landscape, to single system, to group of metrics to single metric.

<< This blog was originally posted on SAP Focused Run Guru by Frank Umans. Repost done with permission. >>

SAP password hash hacking Part VI: extended wordlists

As explained in the previous blogs many people use a word followed by a rule like add special and digit. Or use a word and replace character with digit or special character.

In the first blog the 10.000 word list was used.

This blog will make you aware of the existence of far more word lists and how to counter these.

Wordlists

Wordlists available:

  • Dictionaries for each language, like Webster for English. Each language has their own preferred dictionary
  • Keyboard walk list: contains fragments like QWER, UIOP, ASDF etc. These fragments are used in so-called combination attacks by using multiple fragments like: Qwer1234!@#$ (which is 3 keyboard walks)
  • Wikipedia list; this list is huge and simply contains a list of ALL words ever used on Wikipedia
  • Public site or intranet site keywords; comparable to Wikipedia, but targeted towards a single organization. Many people use the company name, department name, project name or another internal name as part of their password
  • All placenames (cities, provinces, states, countries, rivers, etc) in the world
  • All movies, actors, actrices, characters
  • Sport names and sports players
  • Lists from previous password hacks: like the LinkedIn list, RockYou list, etc.

The creator of John The Ripper offers them for money on their site (for cracking, still use hascat…).

Counter measures for attacks done by word lists

Counter measures:

  • User education to use not a single word, but two or more words in the password
  • Use single sign on in stead of passwords
  • Use generated passwords in secure storage

ABAP2XLS framework

The ABAP2XLS framework is a nice framework to speed up the development time and options to work with XLS from ABAP.

Installation

Follow the instructions on the ABAP2XLS github site to download and install. Also install the demo programs.

Demo programs

Run program ZABAP2XLSX_DEMO_SHOW to see the demo programs:

Double clicking on a program will show the coding on the right hand side and also start the demo program. In this case generating xls with multiple tabs with just a few lines of coding.

There are many options possible. Just look at the demo programs and re-use the coding.

Data archiving: production order

This blog will explain how to archive production order data via object PP_ORDER. Generic technical setup must have been executed already, and is explained in this blog.

Object PP_ORDER

Go to transaction SARA and select object PP_ORDER.

Dependency schedule is empty, so there are no dependencies:

Main tables that are archived:

  • AFKO (order headers)
  • AFPO (order items)
  • AUFK (order master data)

Technical programs and OSS notes

Preprocessing program: PPARCHP1

Write program: PPARCHA1

Delete program: PPARCHD1

Read from archive: PPARCHR1

Relevant OSS notes:

Guided procedure on production order archiving issues can be found here.

Application specific customizing

For archiving object PP_ORDER there is application specific customizing to perform. Select the order type:

And set the residence times:

Residence time 1 determines the time interval (in calendar months) that must elapse between setting the delete flag (step 1) and setting the deletion indicator (step 2).

Residence time 2 determines the time (in calendar months) that must elapse between setting the deletion indicator (step 2) and reorganizing the object (step 3).

Executing the preprocessing run

In transaction SARA, PP_ORDER select the preprocessing run:

Select your data, save the variant and start the archiving preprocessing run.

The run will show several functional issues: orders that are not completed and could not be marked for deletion with the functional reason.

Executing the write run and delete run

In transaction SARA, PP_ORDER select the write run:

Select your data, save the variant and start the archiving write run.

After the write run is done, check the logs. PP_ORDER archiving has low speed, and medium percentage of archiving (60 to 80%).

Proved a good name for the archive file for later use!

Deletion run is standard by selecting the archive file and starting the deletion run.

Data retrieval

Data retrieval is via program PPARCHR1:

Important here to select the correct archive files.

Output is a list on the left side with details on the right hand side of the screen in table format:

Batch job event triggering

Batch job event triggers can be used in a smart way to trigger a batch job when needed.

Defining the event in SM64

In transaction SM64 you can see the current events and also create a new custom event:

Triggering the event

The event can be triggered from SM64 by selecting the event and pressing the Execute button:

Or you can trigger from an ABAP program with the function module BP_RAISE_EVENT.

FORM RAISE_EVENT. 
  CALL FUNCTION 'BP_EVENT_RAISE' 
    EXPORTING 
      EVENTID = 'ZMYEVENT'  
      EVENTPARM = 'EVENTPARM 'Test'  
      TARGET_INSTANCE = ' ' 
    EXCEPTIONS BAD_EVENTID = 1. 
ENDFORM. " RAISE_EVENT

Or you can trigger from OS level with the sapevt program.

Schedule job with event trigger

Now we will schedule the job in SM36 using a test program ZHELLOEVENT. In the job definition we will run the program ZHELLOEVENT. In the scheduling we will use the start condition After Event:

When you trigger the event now in SM36 you see the job will execute nicely. Go to transaction SM37 and key in the Or after event search option:

You will now find the jobs after the event triggering.

Jobs waiting for a trigger

To find batch jobs that are still waiting for a trigger, use SE11 to see the content of table BTCEVTJOB.

Reorganization of batch jobs events

Settings are done in SM64:

Run background program RSEVTHISTREORG for the clean up.

OSS notes

Relevant OSS notes:

FOR ALL ENTRIES statement tuning on Oracle database

In very weird cases you get performance issues on one system and not on the other. This can happen when running Oracle and using the FOR ALL ENTRIES statement for very large data sets, while it is fine on smaller sets.

The background is Oracle blocking factors. The full background can be read in these 2 SAP notes:

The solution is to give an Oracle hint (see note 129385 – Database hints in Open SQL) with a lower number of blocking factors.

%_HINTS ORACLE '&prefer_in_itab_opt 1&&max_in_blocking_factor 100&'

Performance issue solved…

If you migrate to HANA or different database, you need to remove or redo the hint again.

Using type-ahead and fuzzy search in F4 help

You can use type-ahead and fuzzy search in F4 help in custom ABAP code. Type-ahead will work with any database. Fuzzy search only with a HANA database.

Test table

First we create a simple test table and fill it with some dummy entries:

Set up Search Help

In SE11 now create elementary search help:

Fill the search help reference to the table and mark the Autosuggest (type-ahead) and mark the full text search:

The fuzzy value of 0,8 allows a similar keyword with a typo to popup. 0,9 be more strict, 0,7 will be less strict. You have to play around. 0,8 is a decent value.

Test program

Now you can test with this test program:

REPORT ZTEST_FUZZY.

PARAMETERS P_TEST type ZTEST-TEXT MATCHCODE OBJECT Z_TEST_FUZZY.

The parameter defined is referring to the search help (matchcode is the old term) we just defined.

Result: if the user starts to key, it will already suggest values:

System wide setup

If it is not working, check with transaction SDSH_CONFIG if the system wide setup is activated or not:

See OSS note 1971775 – Functional or Performance Issues Related to the Type-Ahead Search Functionality.

Exit mobile version