SAP has released content server 7.5. Content server can be used to store attachments, documents and archiving files outside of the SAP database.
Questions that will be answered in this blog are:
- Where can I find more information on SAP content server 7.5?
- How to upgrade to SAP content server 7.5?
- What is the support on my SAP content server 6.5 installations?
SAP content server 7.5
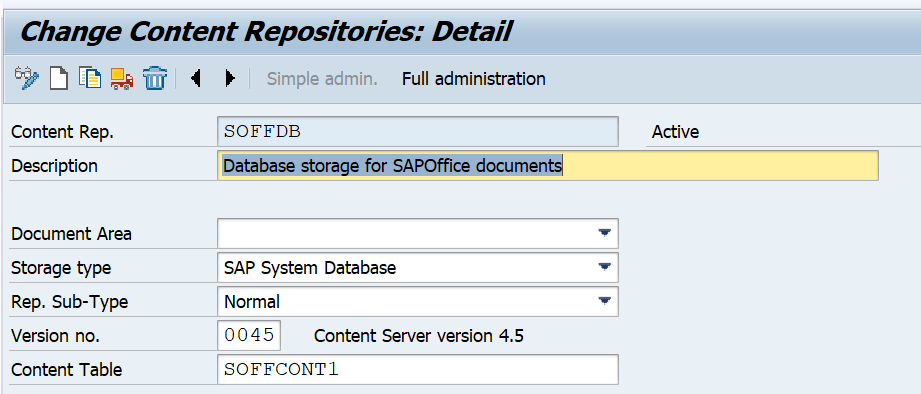
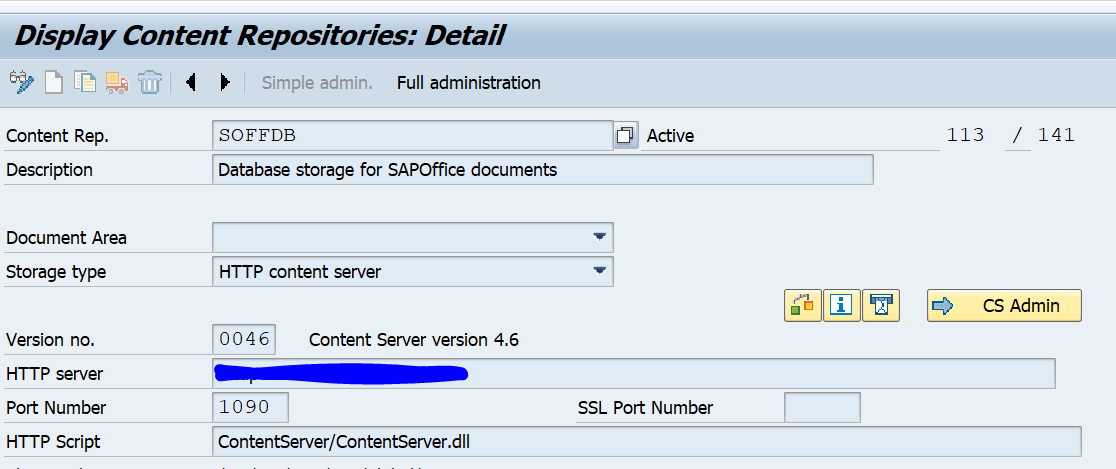
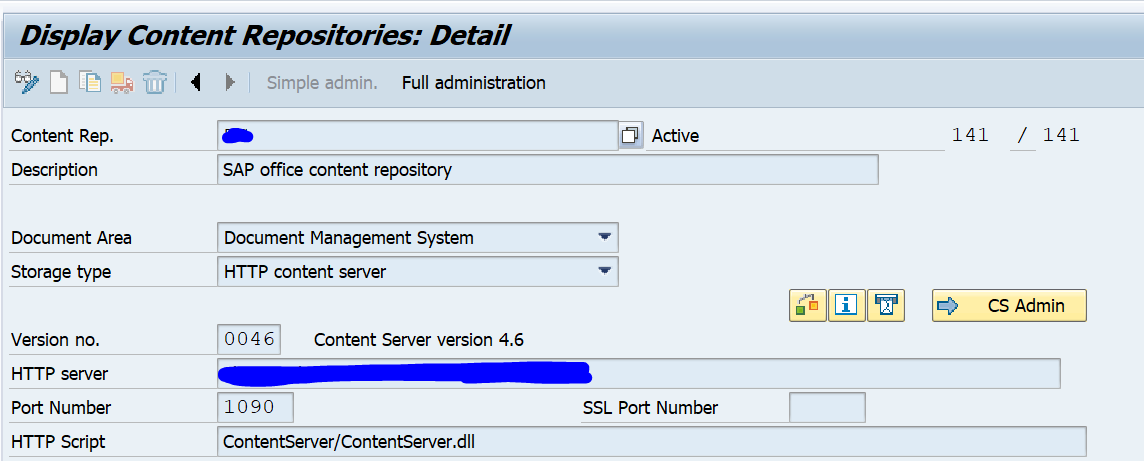
The main OSS note for SAP content server 7.5 is 2786364 – SAP Content Server and Cache Server 7.5 (and higher). This is a major different technology setup: there is no Apache or Microsoft webserver needed any more. The content repository setup itself does not change.
For installation you can follow the instructions from the main OSS note, or follow the steps from the SAP blog on content server 7.5 installation.
Upgrading from 6.5 to 7.5
As mentioned before the technology has changed on how data is put into content server and how it is retrieved, but the data structure itself is the same. Note 2786364 – SAP Content Server and Cache Server 7.5 (and higher) is also describing the migration process. Your database (most of the times MaxDB) remains as is. But you have to install new 7.5 content server. Then you migrate the configuration. You stop the old 6.5 server and start up the new 7.5 server. You test that all works via the content server check programs from this blog (you might need to perform changes in transaction OAC0). SAP recommends after successful migration to clean up the old 6.5 as soon as possible to avoid issues (like an overzealous admin starting it up again…).
Support of SAP content server 6.5
In the main OSS note on SAP content server 6.5 (1983930 – Availability of SAP Content Server 6.50) there is no direct indication of end of support date. SAP content server 6.50 is part of the Netweaver 7.40 stack. The support of this stack ends by 31st of December 2020.
See also OSS notes 761387 – SAP Content Server support information and 719971 – SAP Content Server release strategy.
Before raising SAP message, first read OSS note 3345452 – SAP Content Server – required information for analysis on the information SAP needs for a quick solution to your issue.
Changes to test programs
The content server test programs (for example RSCMST) can respond differently with the new content server. SAP is updating these. For more information see the blog on content server tips & tricks.
Content server license
For using content server from SAP using MaxDB no special licenses is needed. See OSS note 2553449 – Does the SAP Content/Cache Server require a separate license?.