How can I avoid large spool outputs in background jobs?
How can I setup LOCL printing?
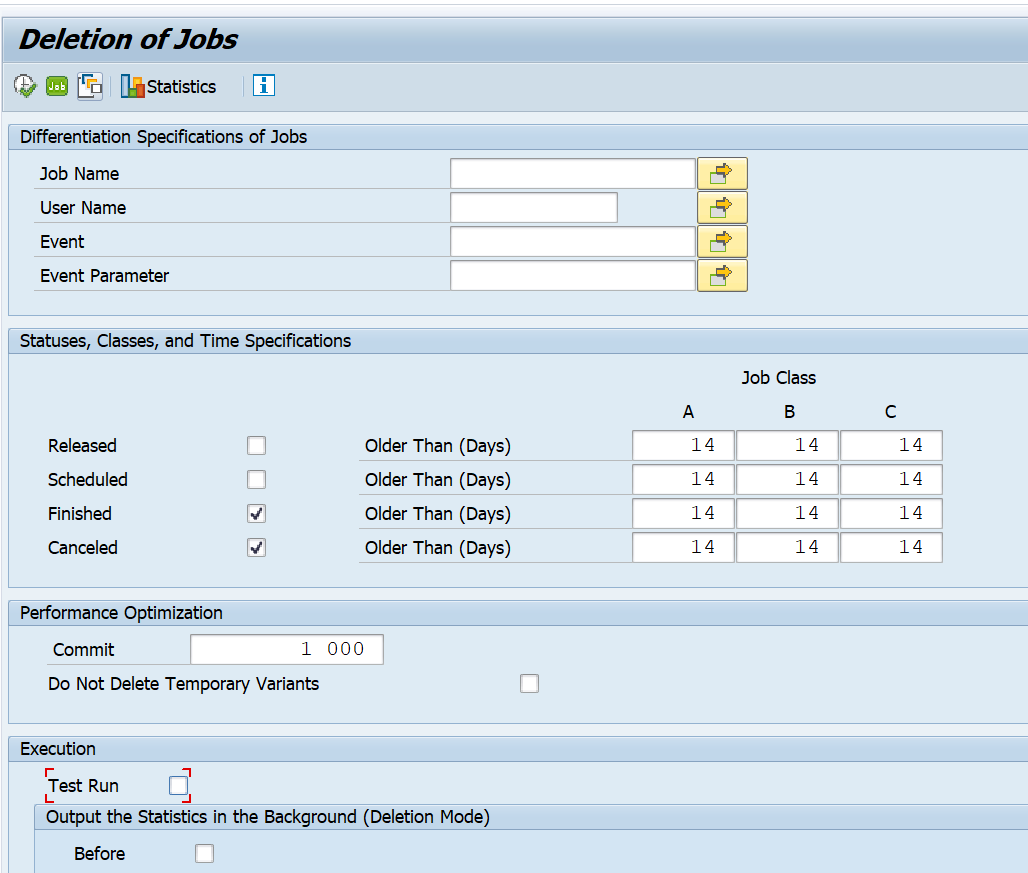
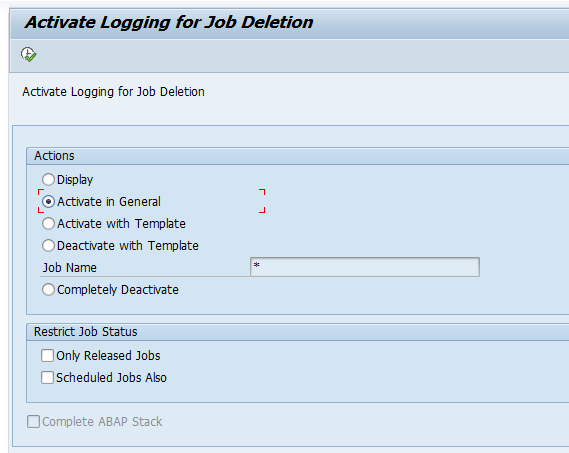
How to delete old spools?
Spool number range and status
If your spool system for printing is getting out of numbers, the printing stops and even endangers your complete system. The signal is shortdump COMPUTE_BCD_OVERFLOW as described in OSS note 2208342 – Shortdump COMPUTE_BCD_OVERFLOW.
You can store a print list in the data archive. For setup see this blog.
Avoiding large spool in background job output
If you have a batch job with large spool output and you never look at it, you can also setup device type NULL to immediately delete the output. This way the spool system is not filled up. For setup see this blog.
Transaction SPOOL
Transaction SPOOL contains links to most important spool transactions. See this dedicated blog.
Setup of LOCL printing
For setup of LOCL printing, read this dedicated blog.
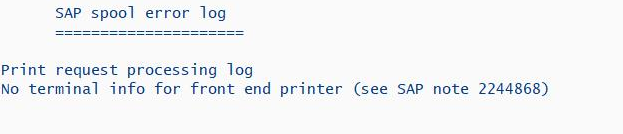
Spool error for LOCL printing
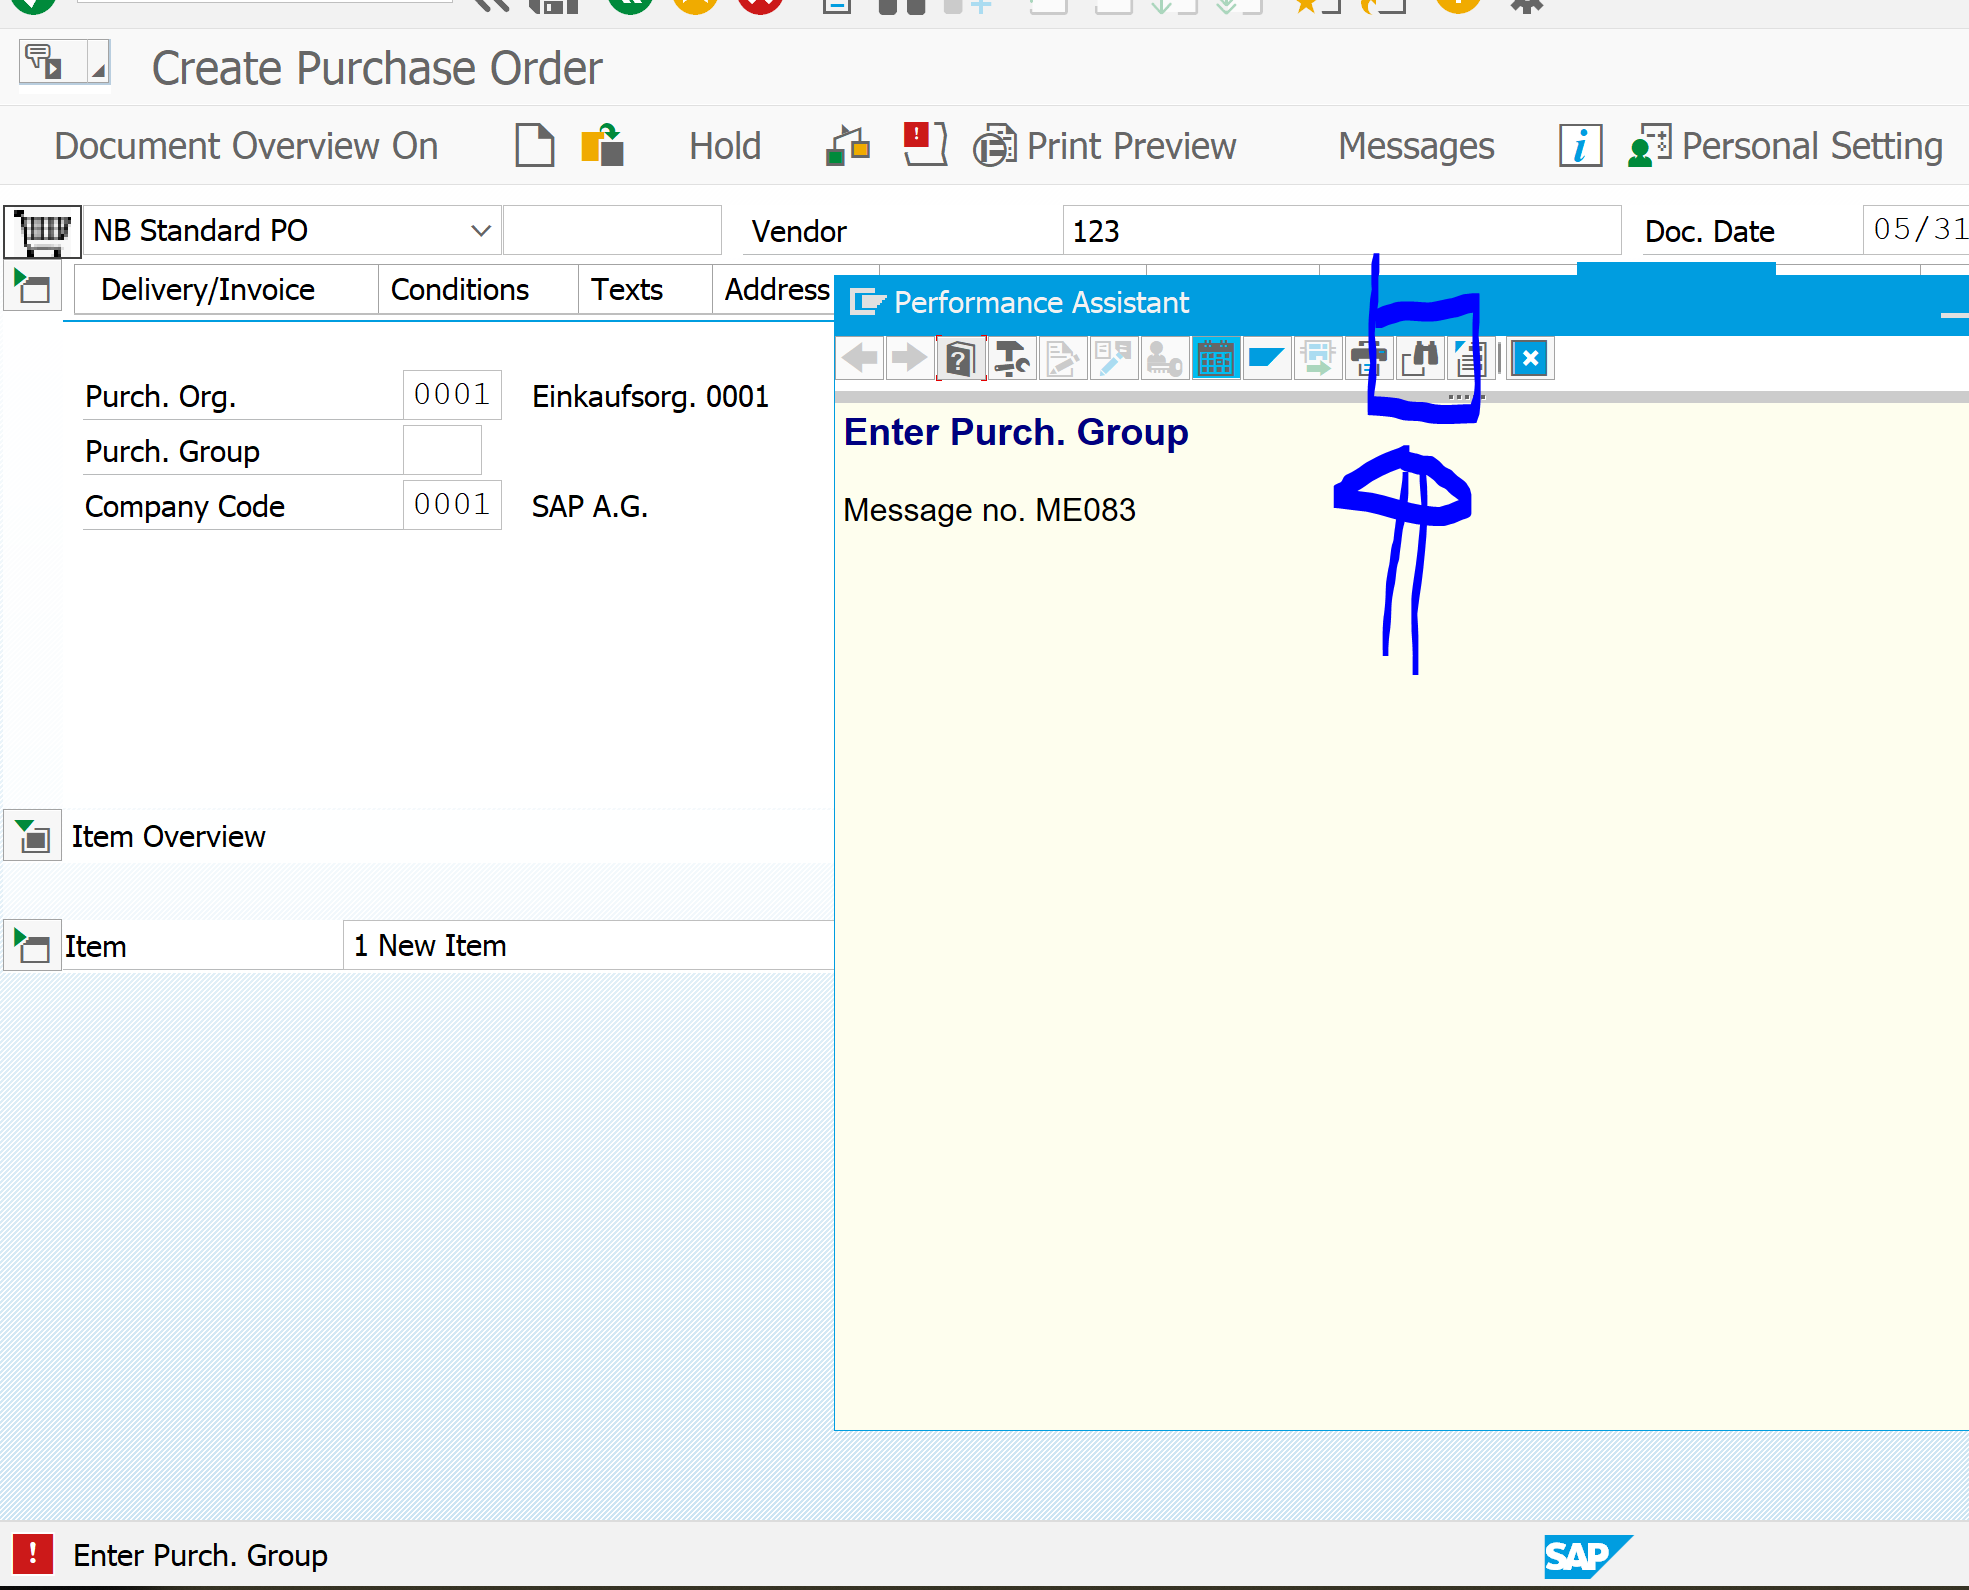
When a user is trying to use the LOCL printer as printer for background job, off course the background job cannot reach the printer and will throw an error message:
HTTP/2 is the successor of the HTTP 1.1 protocol. It has some performance advantages. The main advantages are the capability of multiplexing and server push. The HTTP/2 protocol was designed for faster page loading even when having longer latency times.
Questions that will be answered in this blog are:
Where can I find more background on the HTTP/2 protocol?
Are there any pitfalls and prerequisites?
How do I switch on the HTTP/2 protocol on my FIORI server?
The prerequisite for support of the HTTP/2 protocol for FIORI and other ABAP web applications is a sufficiently high version of the ABAP stack and webdispatcher (if in use): NetWeaver Gateway version 7.51 or higher, Web Dispatcher 7.49 or higher. The HTTP/2 protocol also has higher security requirements and does require COMMONCRYPTOLIB version 8.4.31 or higher.
How to switch on HTTP/2 protocol support?
In the ABAP system parameters RZ11 switch the parameters icm/HTTP/support_http2 to value TRUE. This can be done dynamically. In Google chrome developer tools the UI developer can see the usage of HTTP/2 protocol (on http call right click on the call to show the Protocol field as well).
If you are using web dispatcher set parameter icm/HTTP/support_http2 to value TRUE as well as wdisp/support_http2_to_backend to TRUE.
Kernel patch
The HTTP/2 protocol implementation is done on kernel level. If you want to switch on the HTTP/2 protocol on your systems, do check the OSS notes with the keyword icm/HTTP/support_http2. You might see there are a few kernel patch OSS notes (using component BC-CST-IC) that solve issues in your area that you use. In case of issues in a productive system with HTTP/2: switch the value of icm/HTTP/support_http2 back to FALSE.
Diverse tools use SAP GUI scripting: test tools to perform regression testing, load testing, solution manager CBTA, etc. Also robotizing tools often use GUI scripting.
Questions that will be answered in this blog are:
How to enable GUI scripting in the SAP system?
How to make sure only the allowed users run GUI scripting?
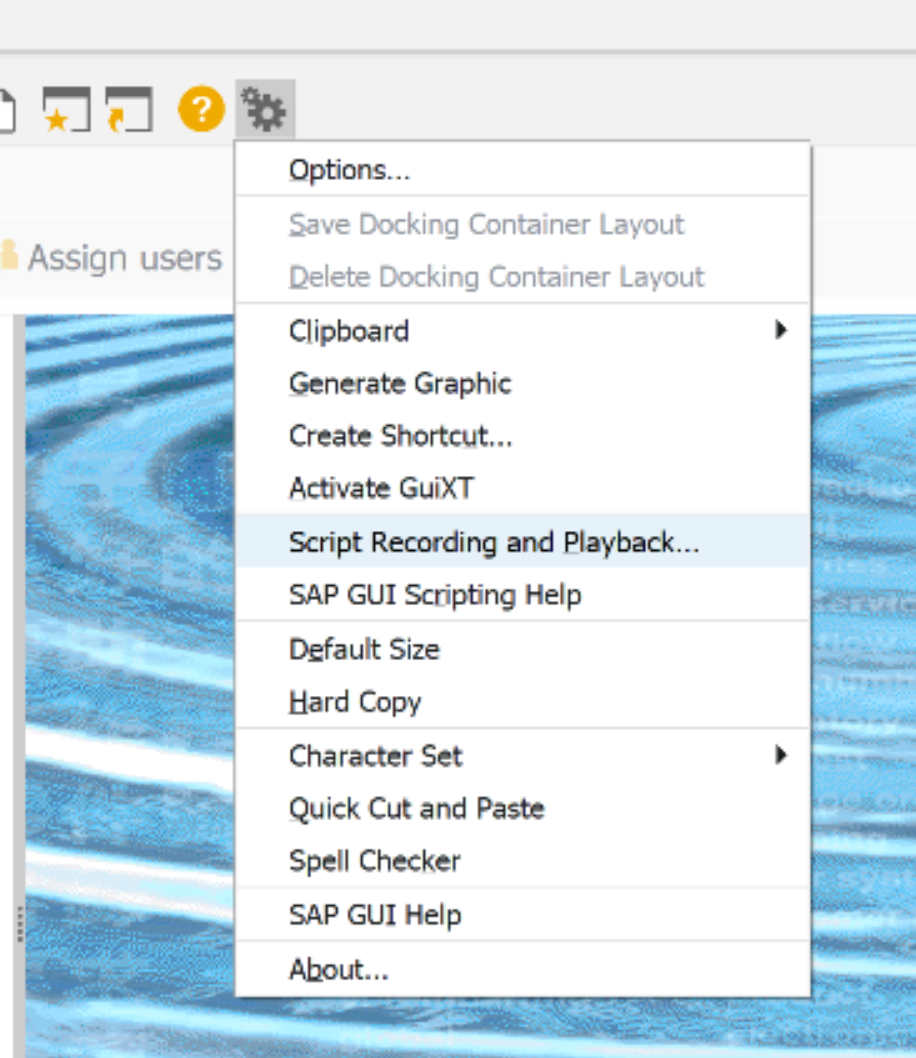
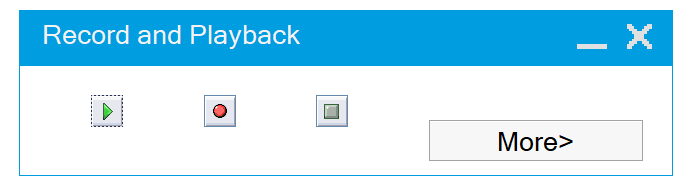
How can I record an SAP GUI script and execute a playback of the recorded script?
Server side enabling GUI scripting
First you need to allow GUI scripting on the server side. This can be done by setting system parameter sapgui/user_scripting to the value TRUE. This is done in transaction RZ11.
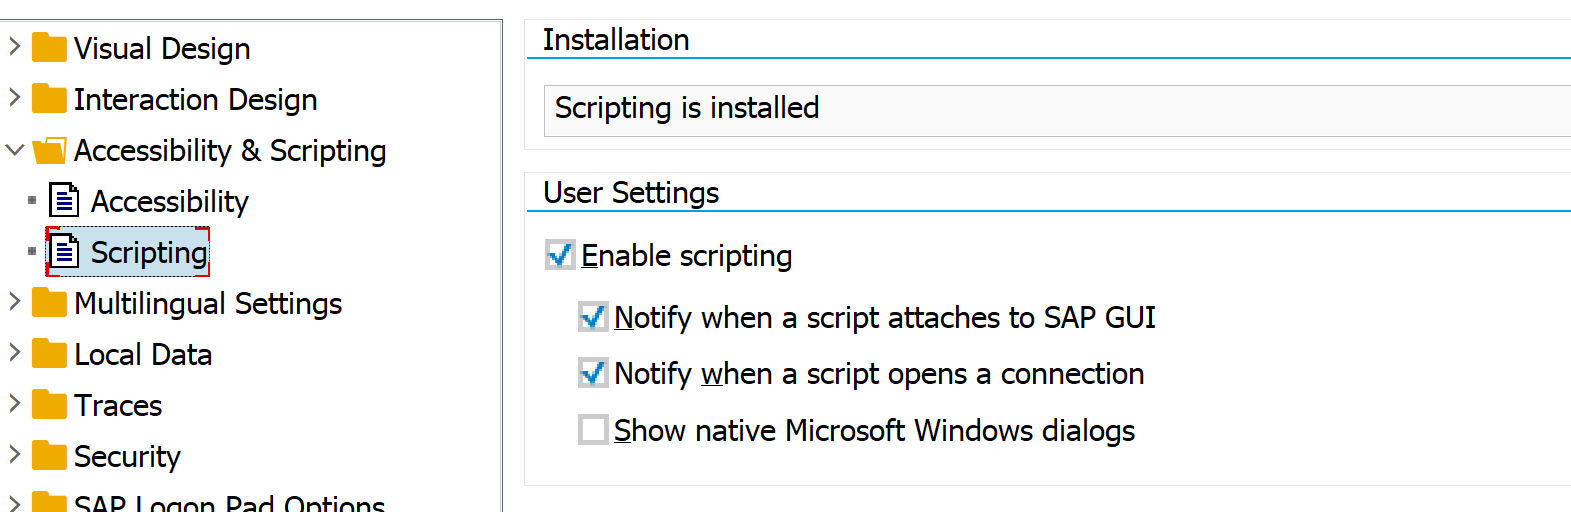
Client side enabling GUI scripting
In your SAP gui, goto the options. In the Accessibility & Scripting part, enable the scripting.
At the top part you can see the installation status of scripting tools from SAP itself.
Securing scripting
If you want to securely control which user is allowed to use and execute scripting, you have to set the system parameter sapgui/user_scripting to TRUE. Now any user who is having the authorization object S_SCR is allowed to perform scripting. User who lack the authorization object will cannot run the script.
If you are in an SAP transaction and you are confronted with a strange error message, you would like to know if there are OSS notes for this message you are having.
As example we take a message in ME21N transaction. If you have the error, double click on the error message for the details:
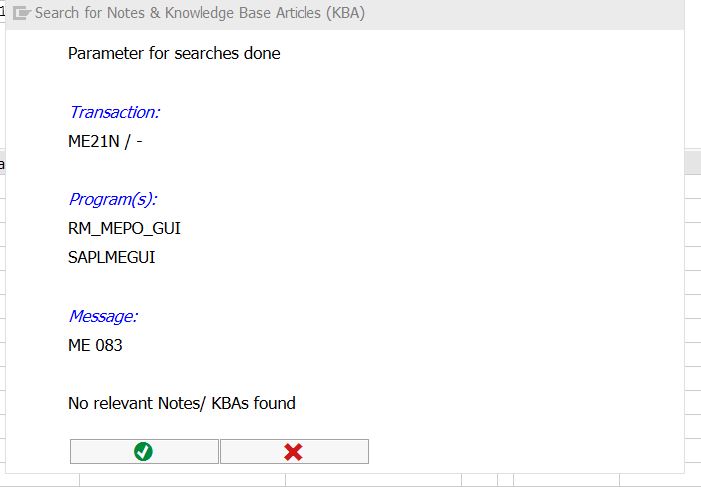
Now press the SAP Notes/Search KBA button highlighted in the screen shot above. The system will now search in OSS notes for this specific message and situation. Since our case is simple we get a nothing found message:
This blog will explain how to debug a background batch program with real background mode (SY-BATCH is X).
Questions that will be answered are:
How to debug a running job?
How to debug a completed job?
Starting the debug mode for batch job
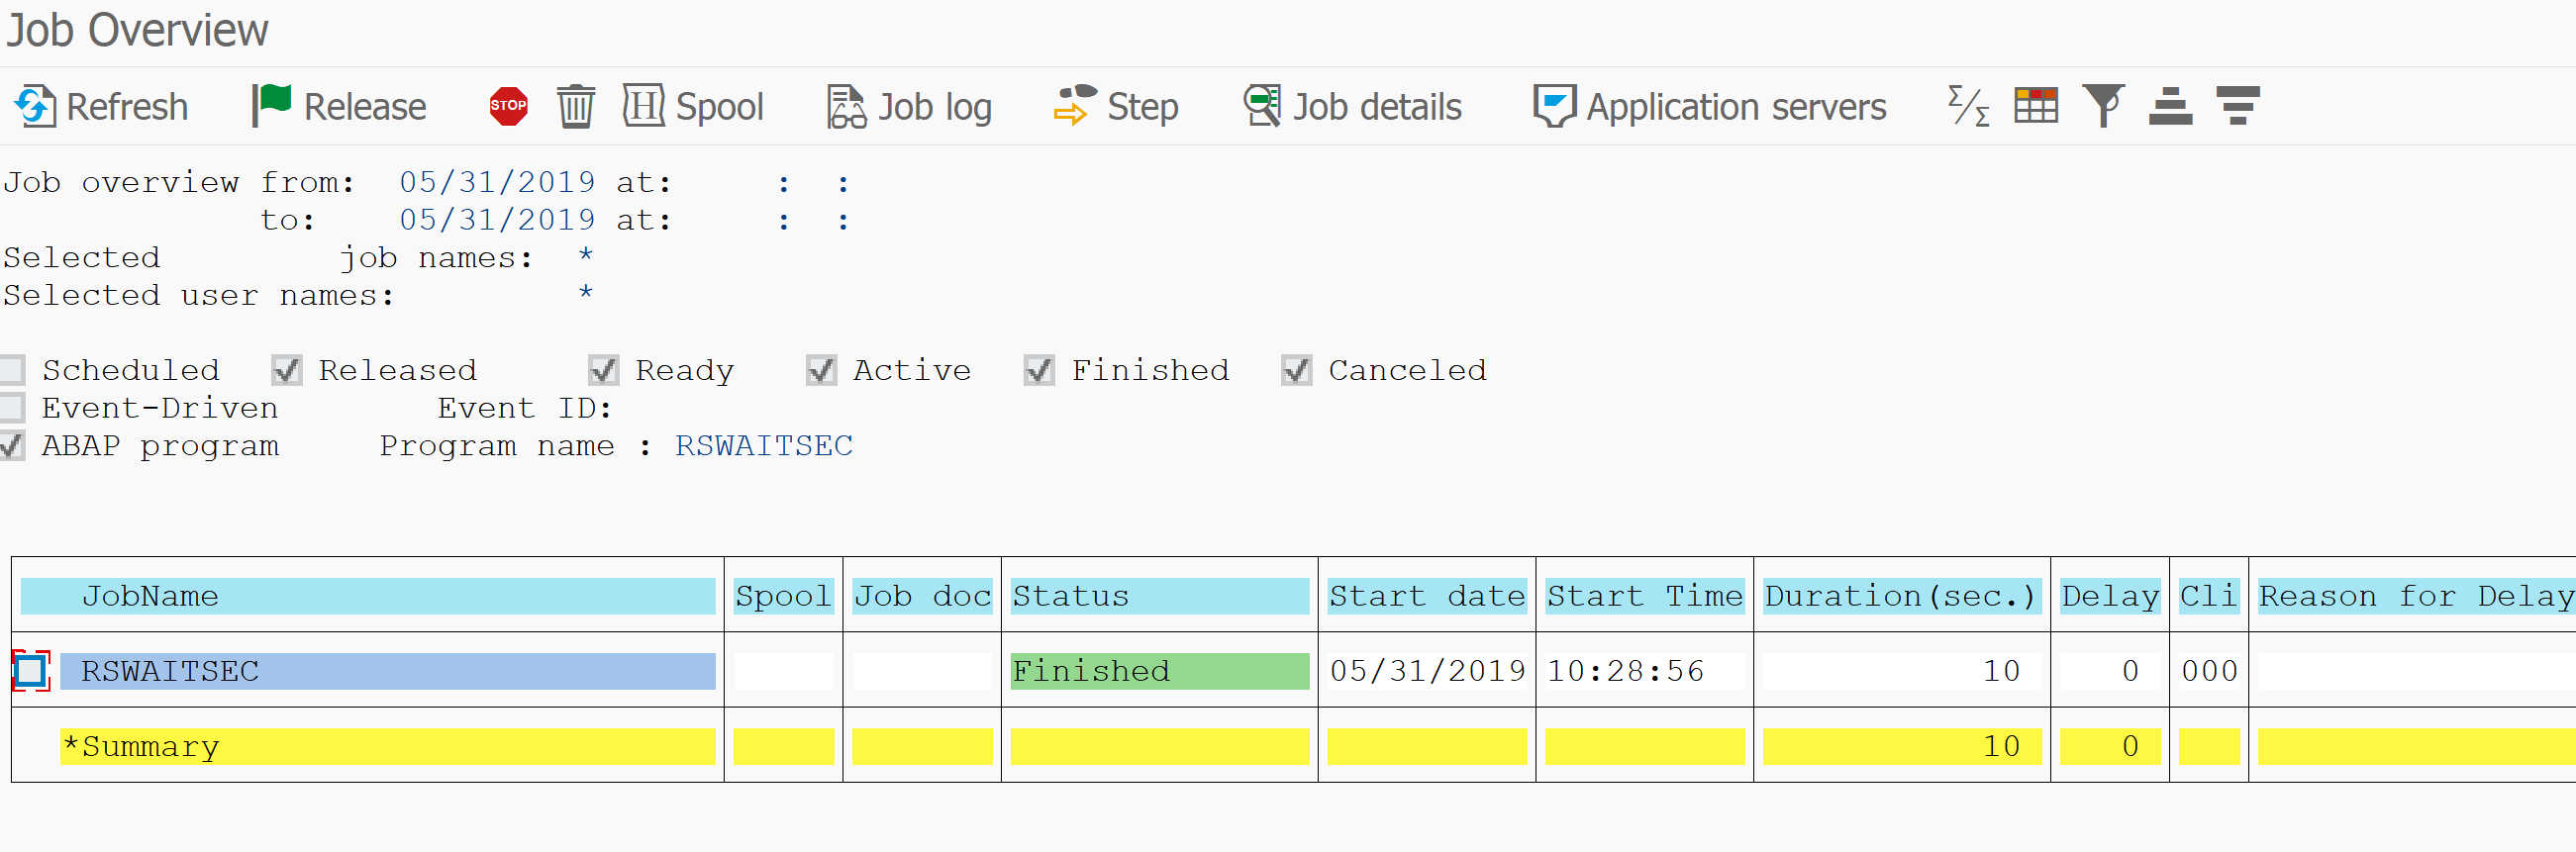
First we plan a single run of the batch job. In our example we run program RSWAITSEC which does nothing more than wait.
In SM37 show the job run:
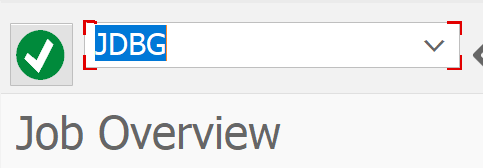
Select the job and in the command line enter the background debug command JDBG:
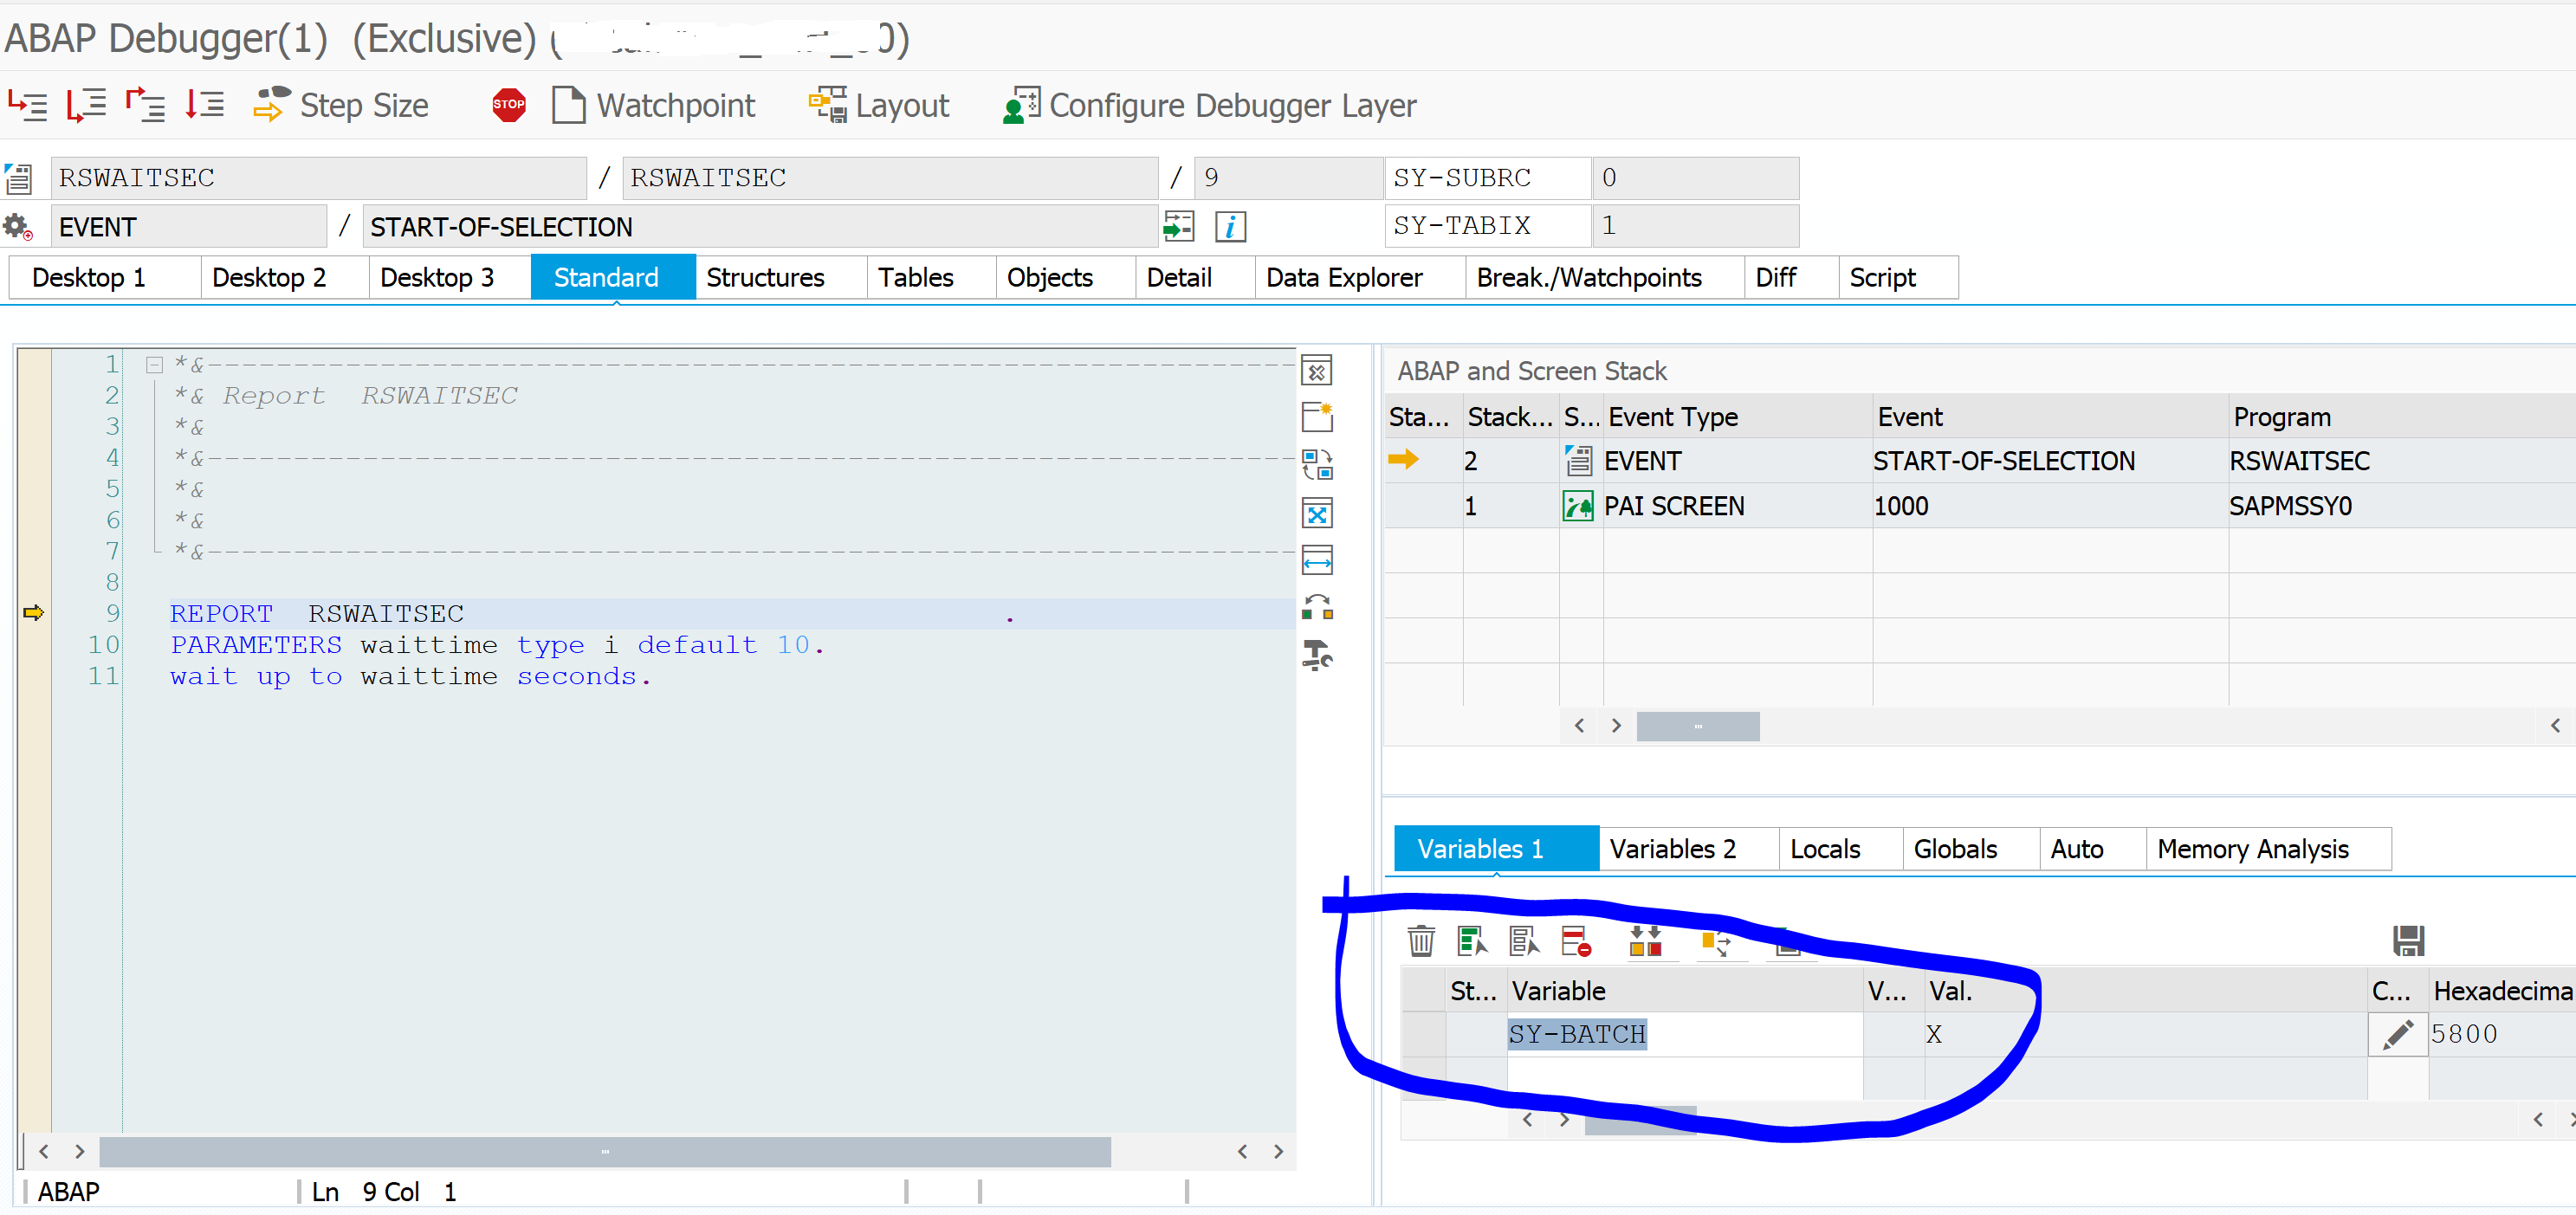
Now the debugger starts first in the batch job part. Hit F7 a few time (F7 = jump back out of routine) until you reach the real program:
As you can see here the SY-BATCH variable is X, which means you are debugging with real background mode on.
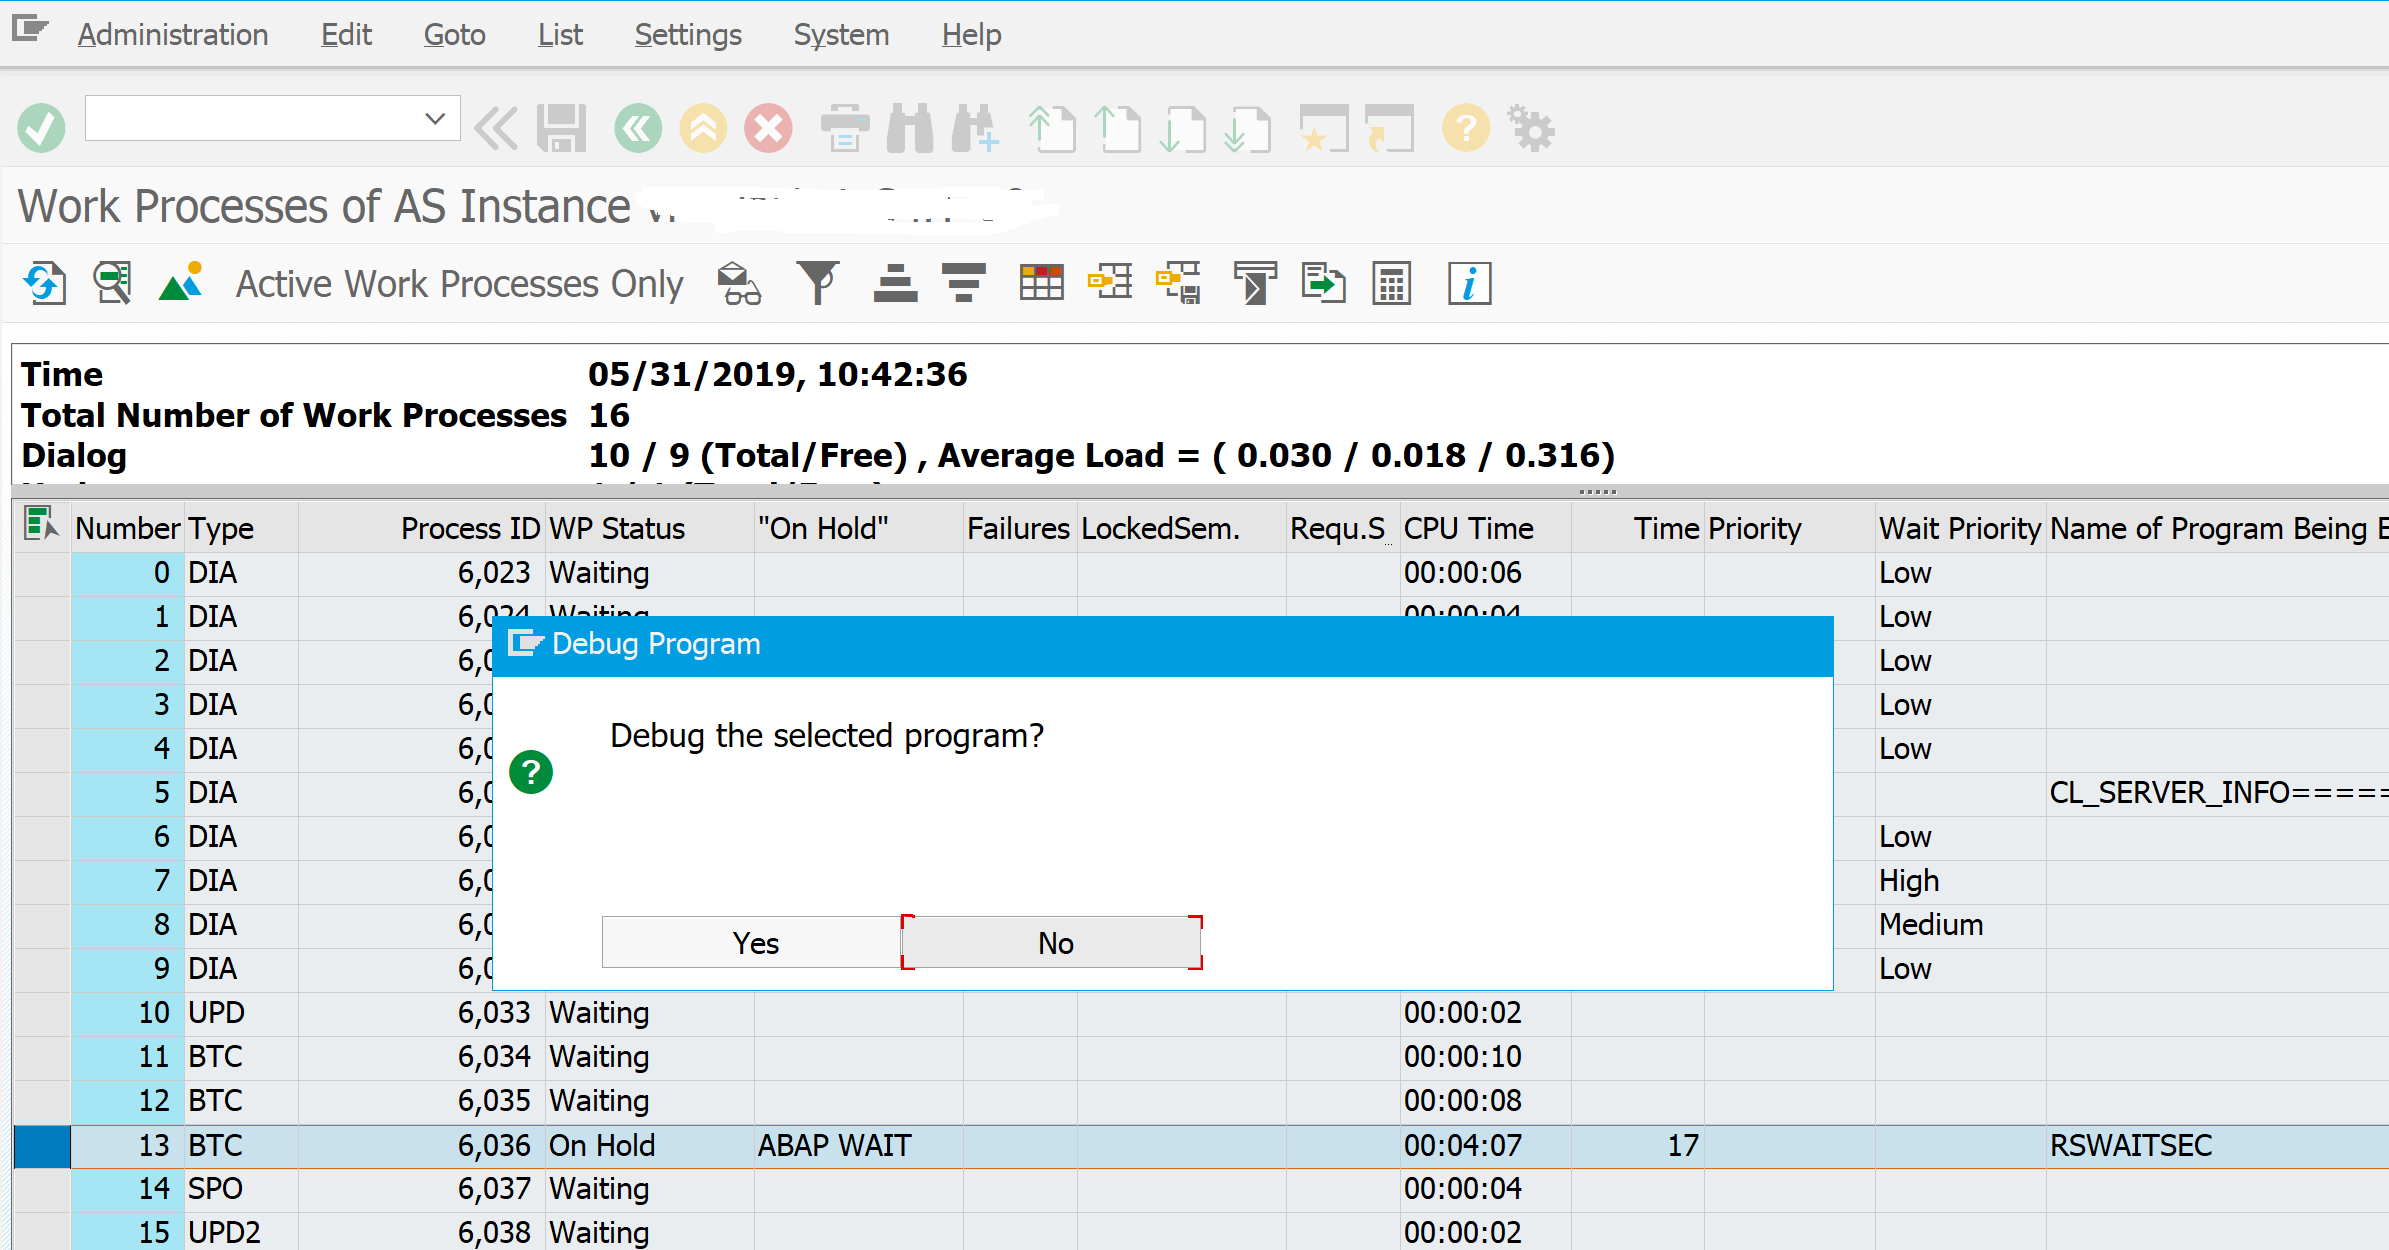
SM50 background debugging
If you want to debug a running job, you have to goto SM50 and select the background process. Then choose the menu option Administration / Program / Debugging. Confirm the prompt:
Wait until the running SQL statement has completed and debug mode will start.
Please be very careful with this kind of debugging in a productive system. If you cancel the debug session there might be a rollback work statement triggered, which can cause database inconsistencies.
If you want to prevent same job from starting, while a previous instance is still running, you need to add program RSBTONEJOB or RSBTONEJOB2 as first step in the batch job. This step will detect if the previous instance is still running and abort to avoid the next steps from being executed. More background in OSS note 557610. The scope of both programs is in principle limited to be used for idocs and CUA. To extend the scope or in case of issues, read the instructions in note 3225033 – Behavior of program RSBTONEJOB, RSBTONEJOB2 not as expected.
Forcing a batch program to wait
If for some reason you need a batch program to wait between steps, you can use program RSWAITSEC as a step. This program will only do a wait for x amount of seconds.
Setting current date in the TVARVC table for the RV variables
The RV variables for current date, month and year are often used in month end closing batch jobs. Running program RVSETDAT will set the current dates for RV TVARC variables.
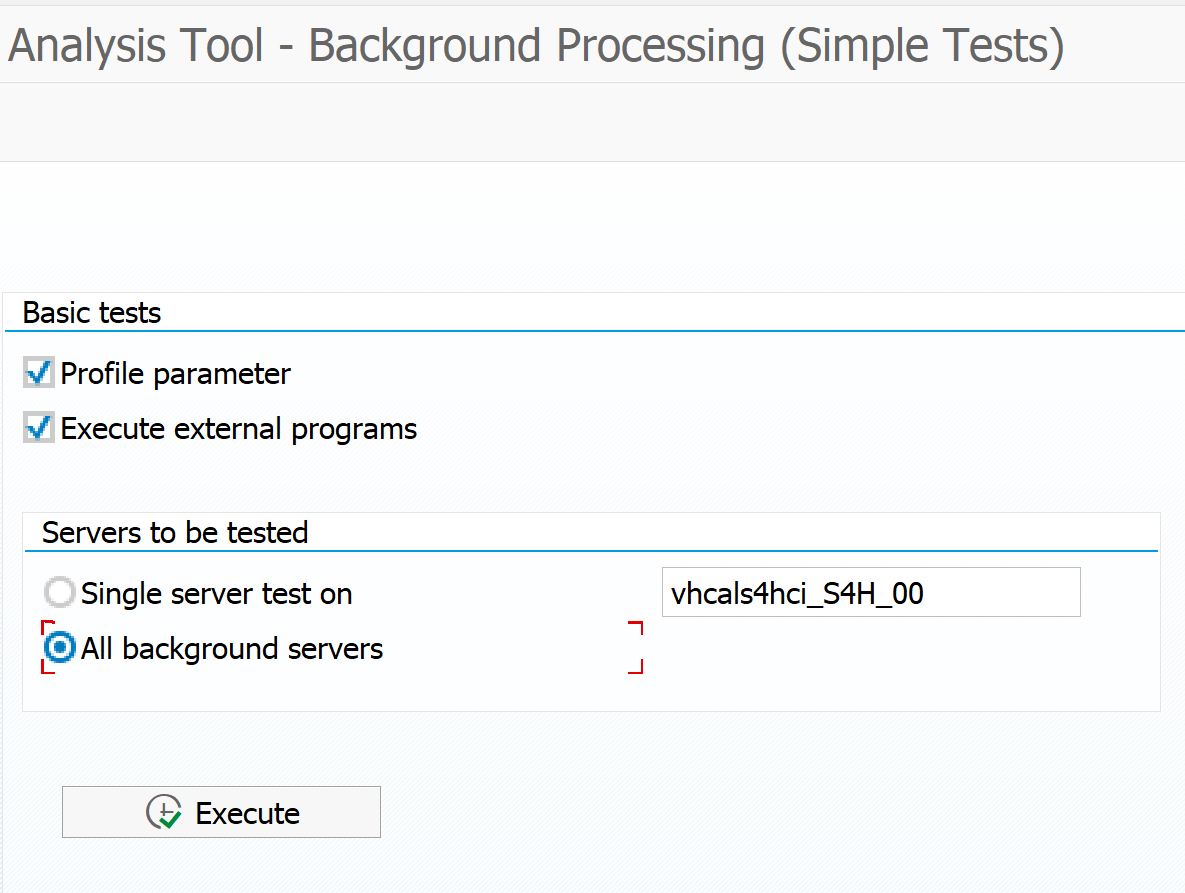
Checking basis background job system settings and working
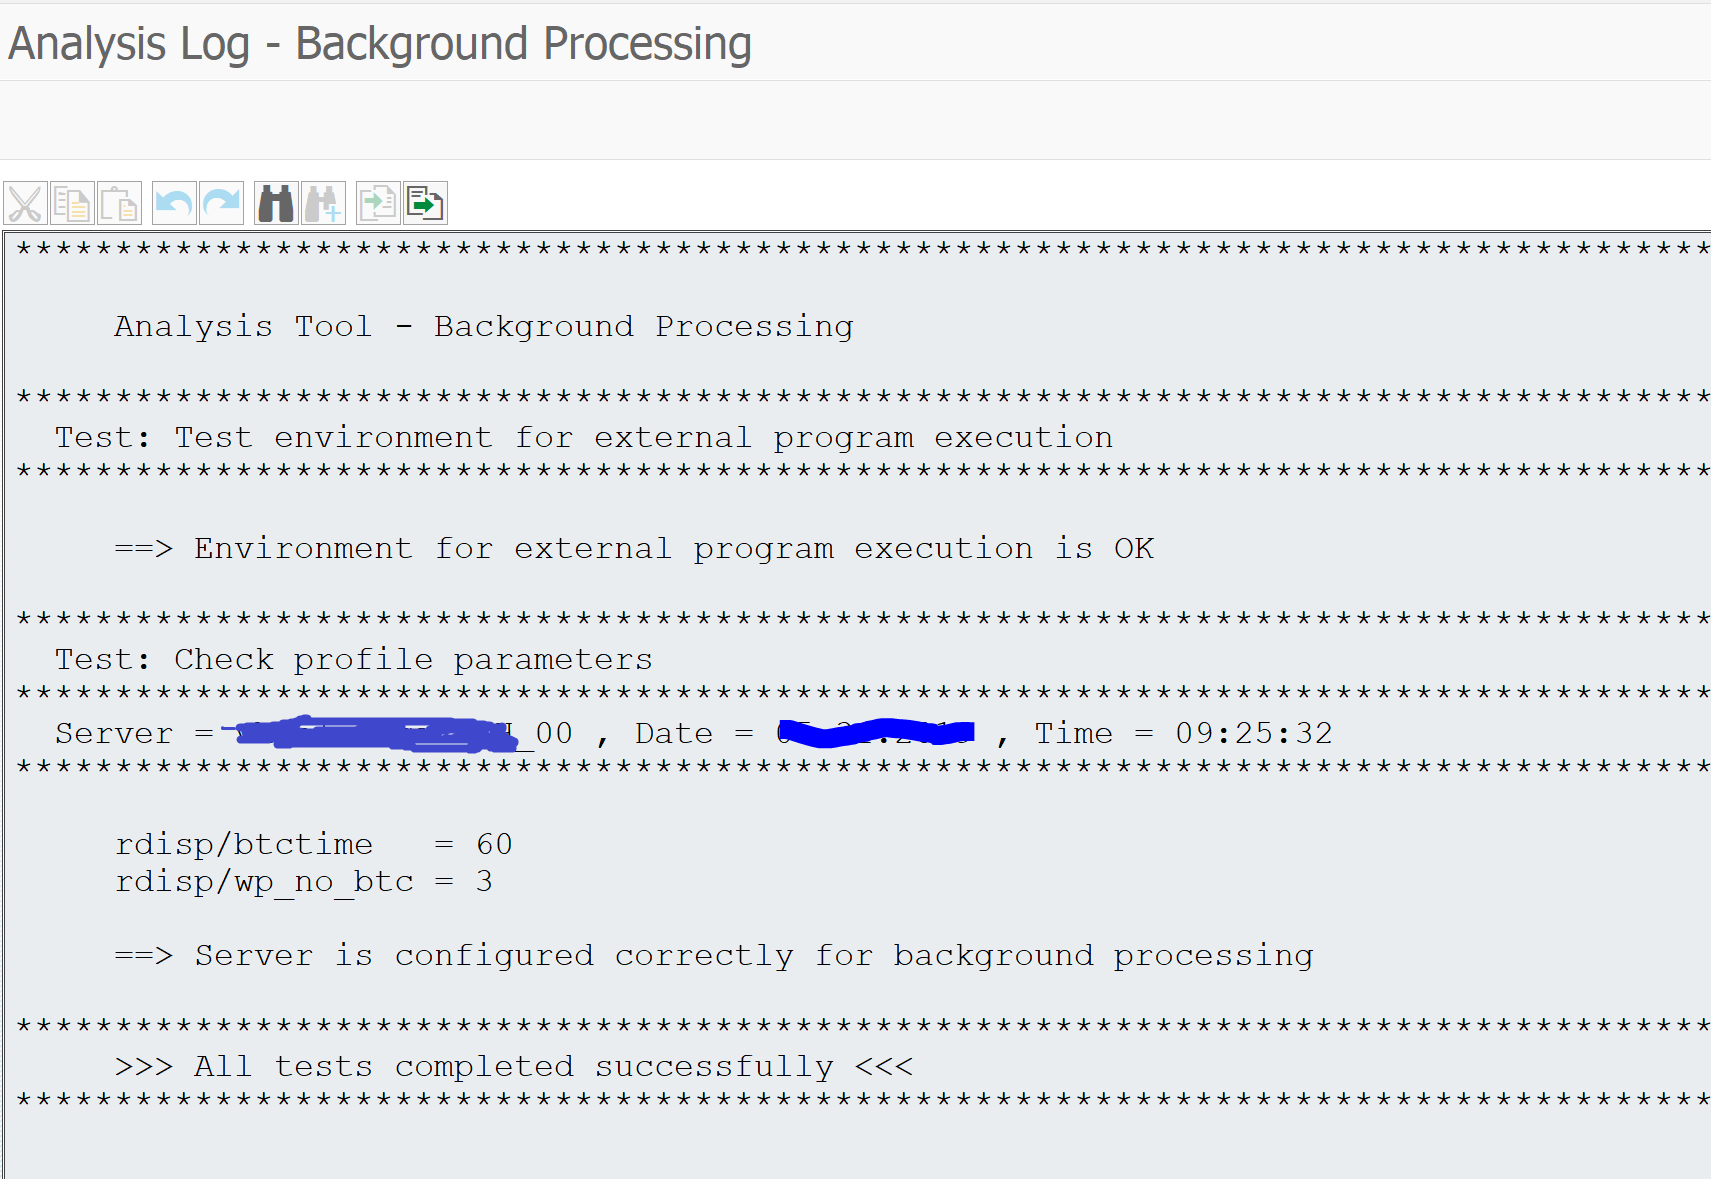
If you want to validate if the background job system function itself is working properly, start transaction SM65 background processing analysis tool.
Result is shown correct working, number of batches and wait time:
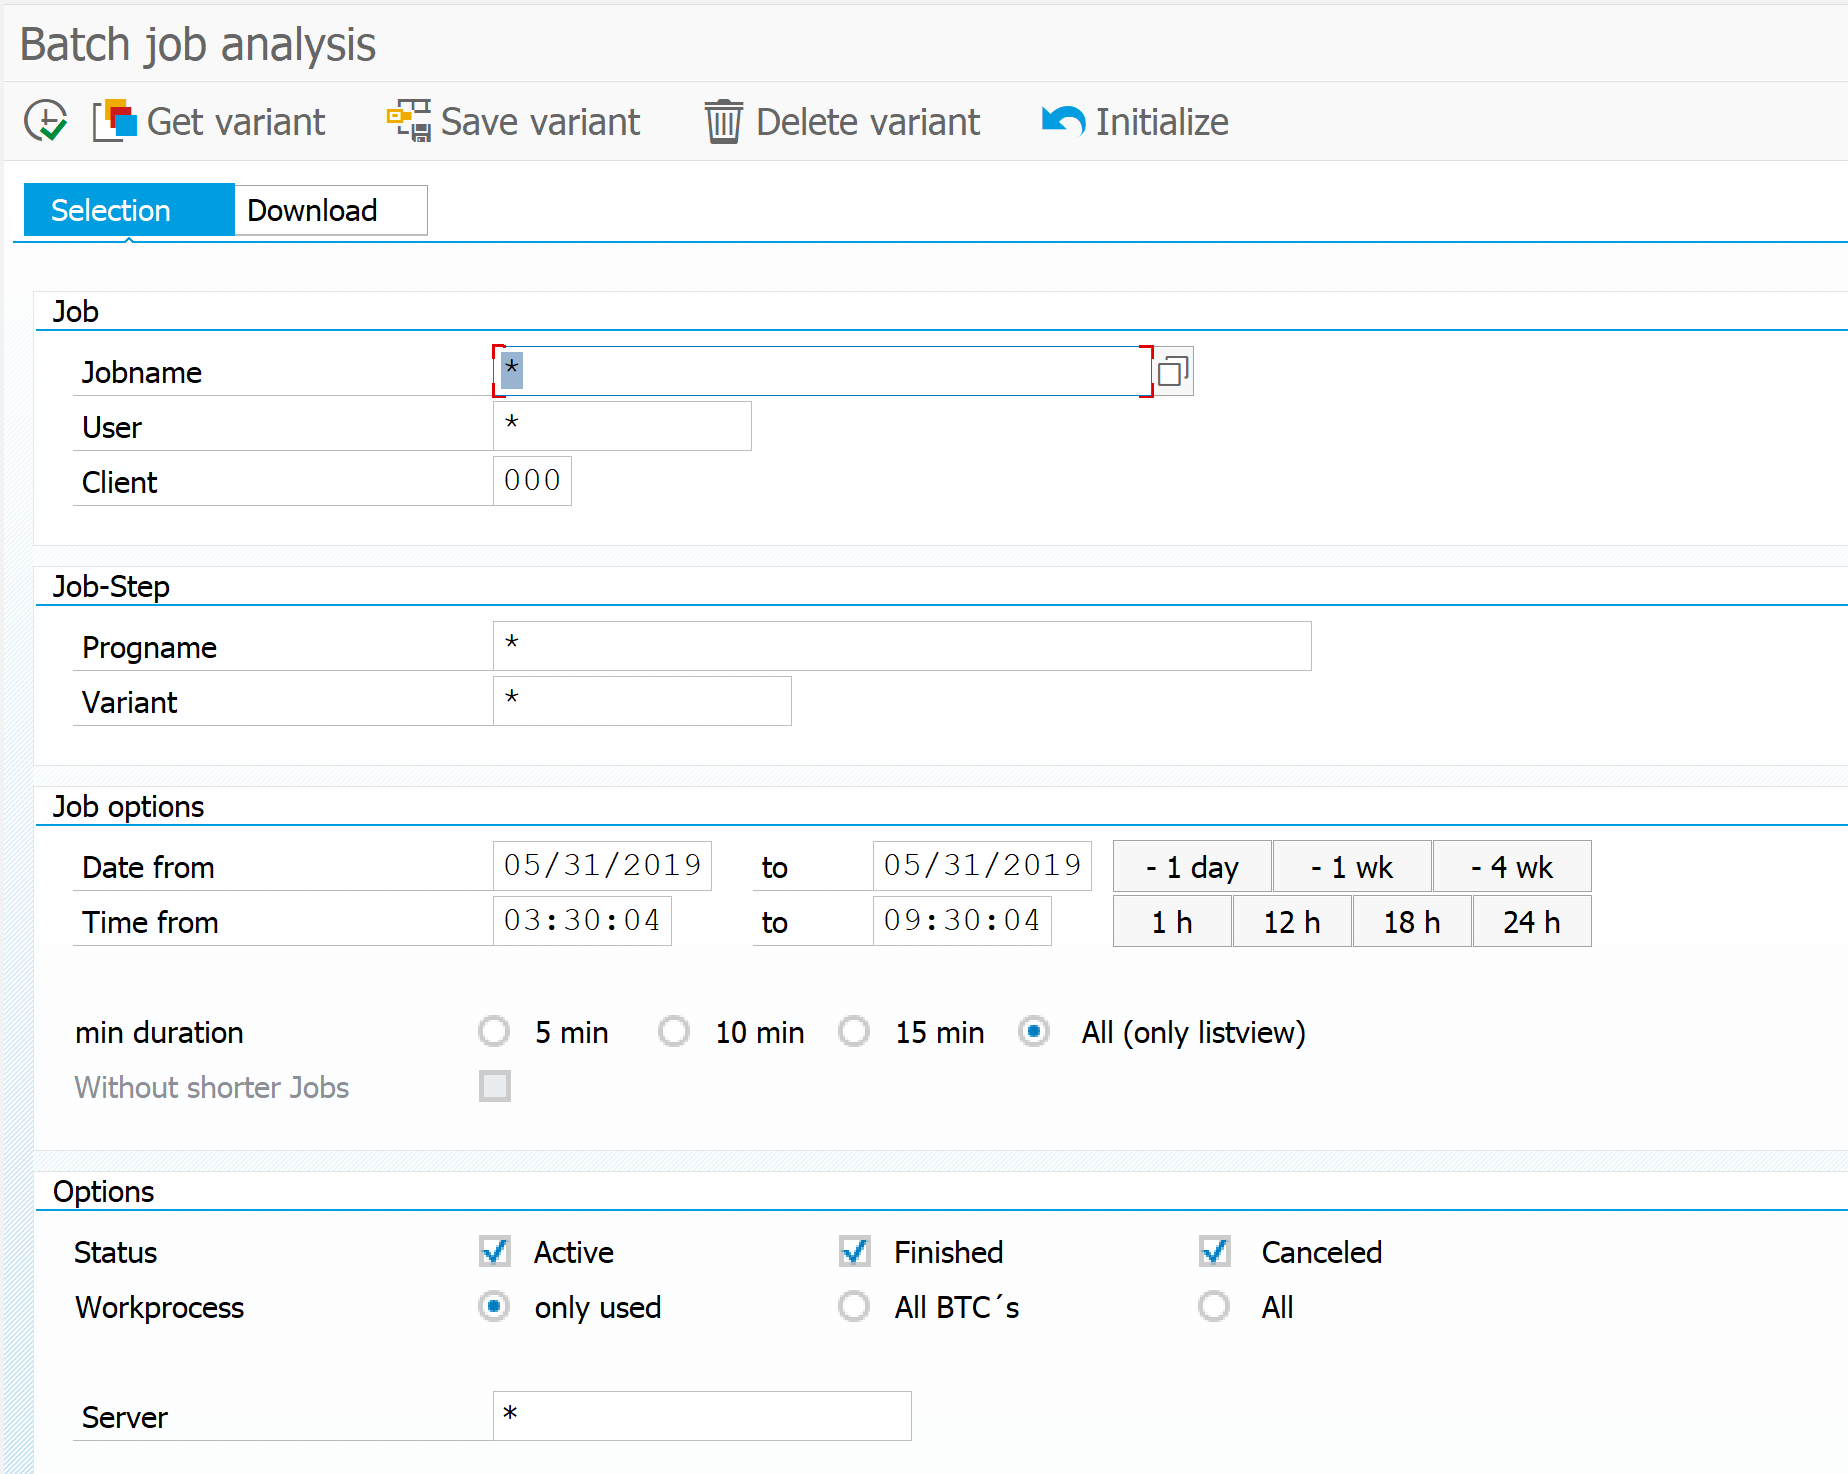
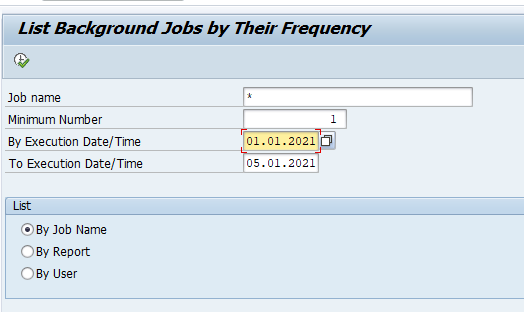
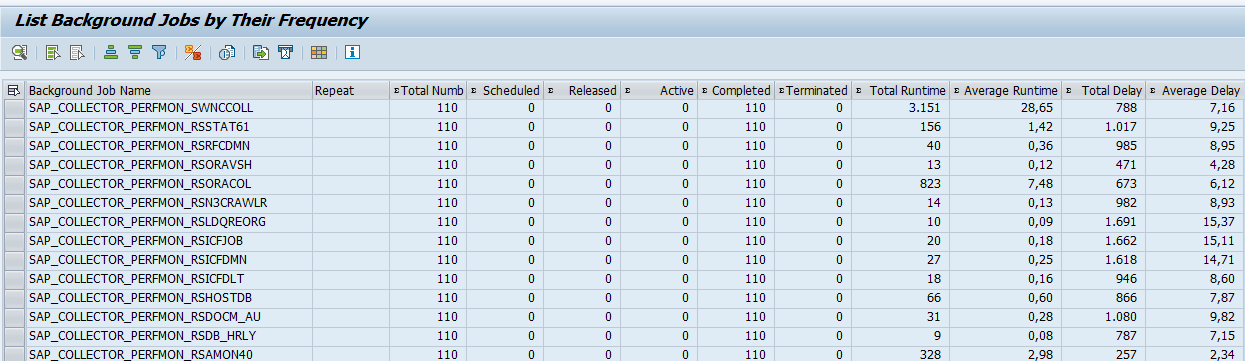
Start transaction ST13 and start tool BACKGROUND_JOB_ANALYSIS. Or directly start program /SSA/BTC.
Pending on your selection you get a graphical overview or a full list for you to speed up your analysis.
Mass stop and start of batch jobs
Programs BTCTRNS1 and BTCTRNS2 can be used for mass forced stop and start of batch jobs. See this blog for more details.
Batch job interception
For more information on batch job interception, please read this blog.
Ignoring large spool output of a batch job
In some cases a batch job will generate a large amount of spool output which is clogging the spool system, but is never used. In this case you can set up the job to put the output to output device NULL. For setup read this blog.
Archiving spool as print list
If you want to store the spool as print list in the archive, please read this blog.
If you want to quickly check which user ID’s are use inside batch job steps, it is best to quickly go to table TBTCP. Here you can quickly see across many batch jobs which step users are used.
Check batch job headers
Sometimes you need to report and check data on batch job header level. This data is stored in table TBTCO. Example: if you have performance issues with jobs and you have multiple application servers, you can use table TBTCO to check on which application server the troublesome jobs are running.
Solving inconsistencies in batch job tables
In rare cases there might be inconsistencies in the batch job tables TBTCO and TBTCS. In this case you need to run program RSBTCCNS to check and delete the inconsistencies.
You can mail the spool result of a batch job to one or more mail addresses. Also with newer SAP netweaver versions you can mail if job was successful or not. Read this blog in detail.
Debugging batch jobs
For debugging batch jobs, please read this dedicated blog.
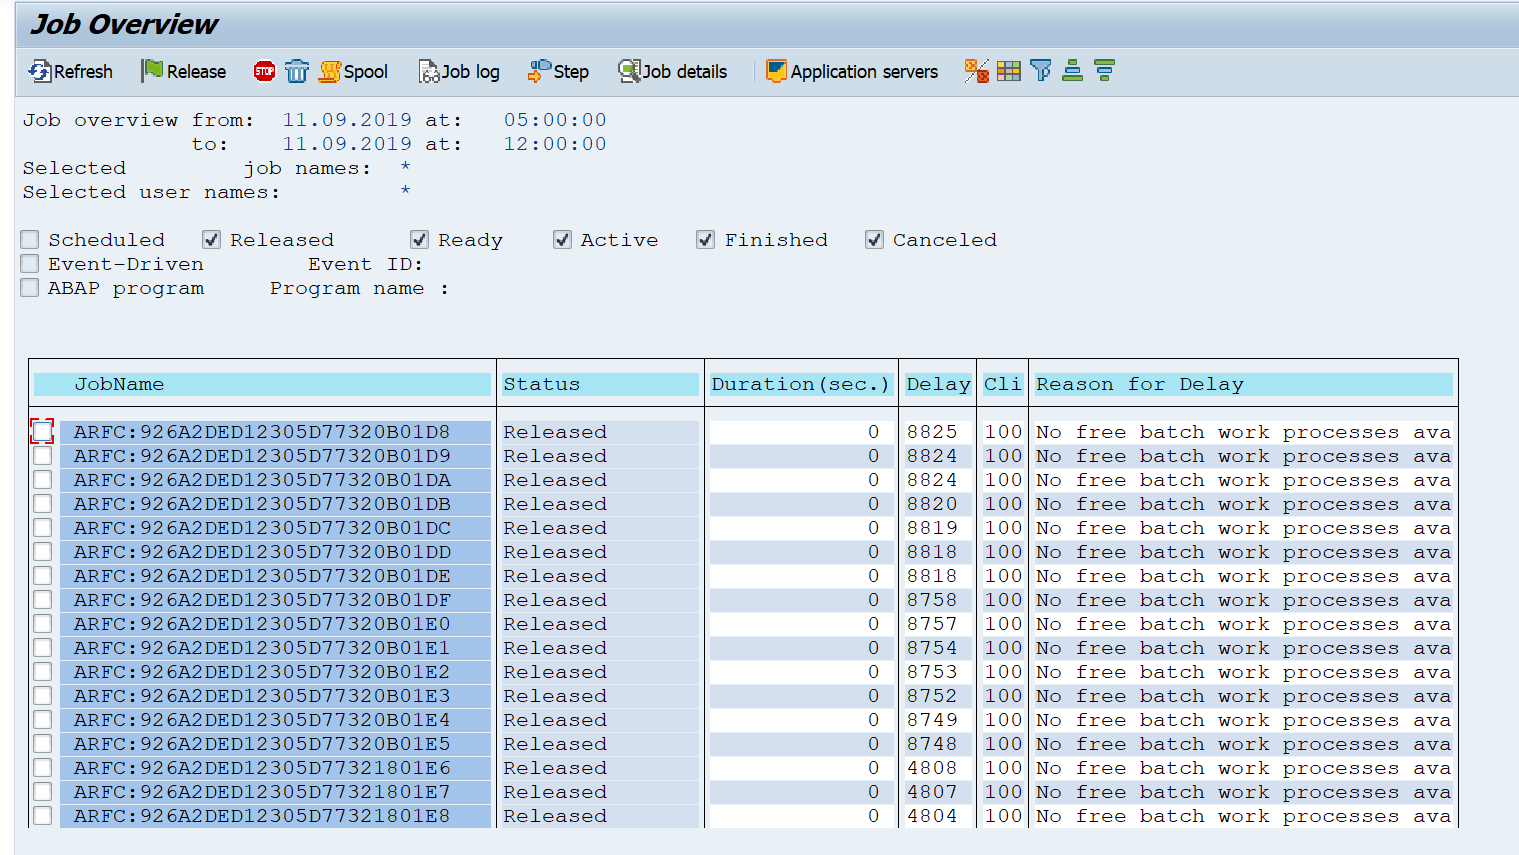
Batch jobs full
If there are no batch processes free any more, you might see this screen in SM37:
When you face this situation check in SM66 if there are BTC processes available.
Standard batch jobs in S4HANA are planned via transaction SJOBREPO. For more details read the dedicated blog.
Batch job server groups
If you have a large production system with many application servers you can setup batch job server groups to have batch jobs run on a set of dedicated application servers. To set up batch job server groups start transaction SM61 and click the button Job server groups:
In quite some cases the basis team is asked: in which batch job variant is this company code XXXX used? Or we need to add another sales organization to all the batch jobs, can you provide us a list with jobs using sales organization YYYY? How to get this data is answered in this dedicated blog.
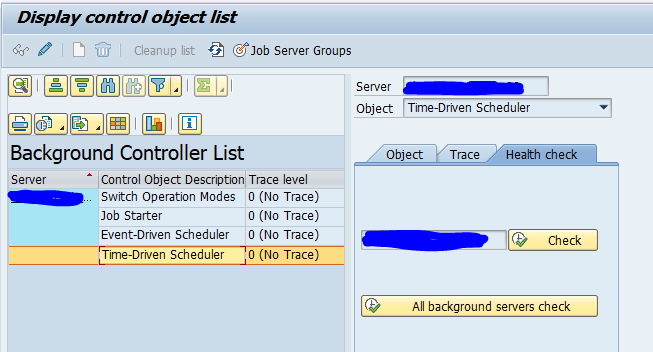
How to check health of batch job scheduler
Start transaction SM61. Now select the Time-Driven scheduler. Select the server and choose the health check tab. Now press the check button:
Batch job event triggers
Batch jobs can also be triggered using events. Read more in this blog on batch job event triggers.
Batch job monitoring
Batch job monitoring can be done with SAP Focused Run. Read more in this blog.
Second program you need to run on production. So you first need to transport all the notes to production. The notes are large and can take up to 20 minutes import time. So take a quiet time at the productive system to import them.
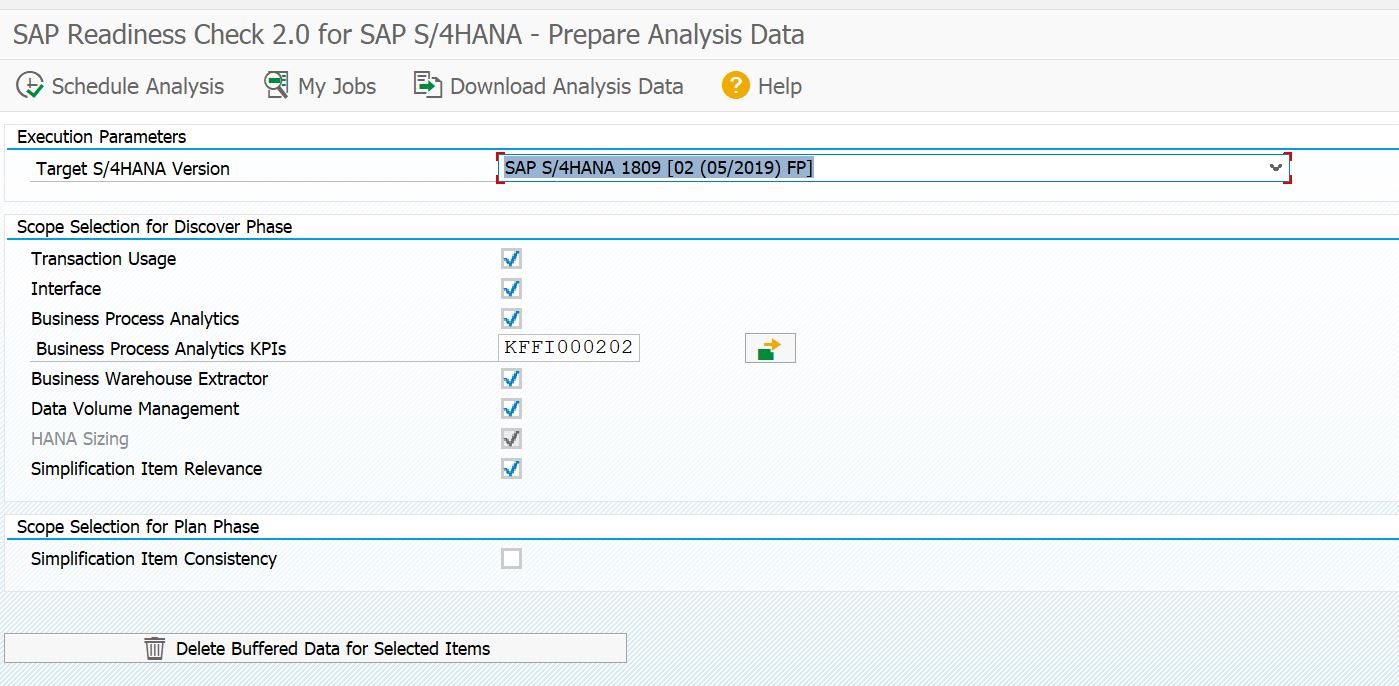
Start program RC_COLLECT_ANALYSIS_DATA in your productive system:
Select your target version and press execute. This will launch multiple batch jobs. Wait for all the jobs to finish and start program again to download the ZIP file to your PC.
The newer version of S4HANA readiness report has option analyze the financial data quality. This is important, since a lot of time and effort during the conversion is spend on the financial data migration.
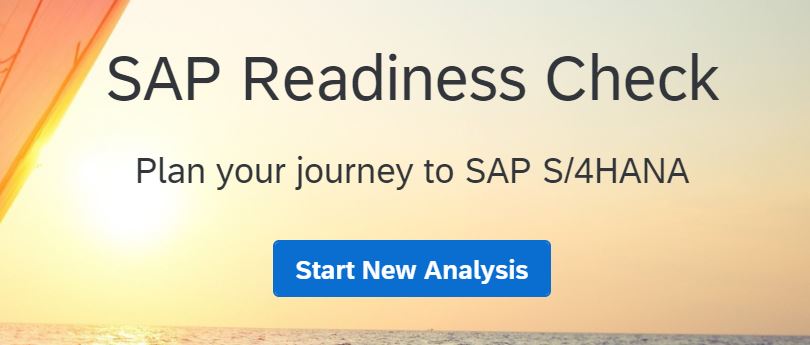
Hit the start New Analysis button and upload the file from the RC_COLLECT_ANALYSIS_DATA program. Wait for the SAP site to finish the analysis. It will be visible on the site as Recent Analysis.
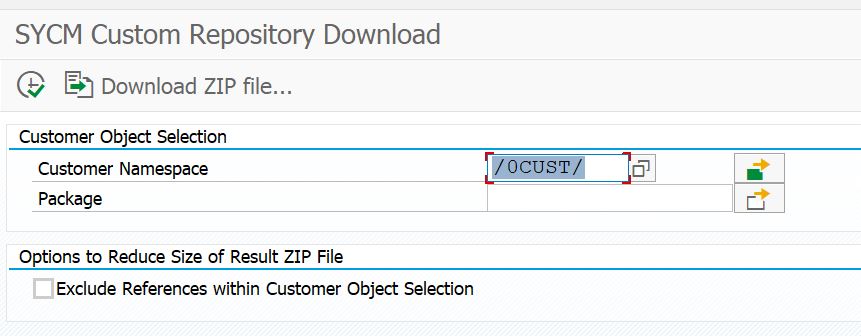
Don’t forget to push the update analysis button to upload the second file with the custom code analysis from program SYCM_DOWNLOAD_REPOSITORY_INFO.
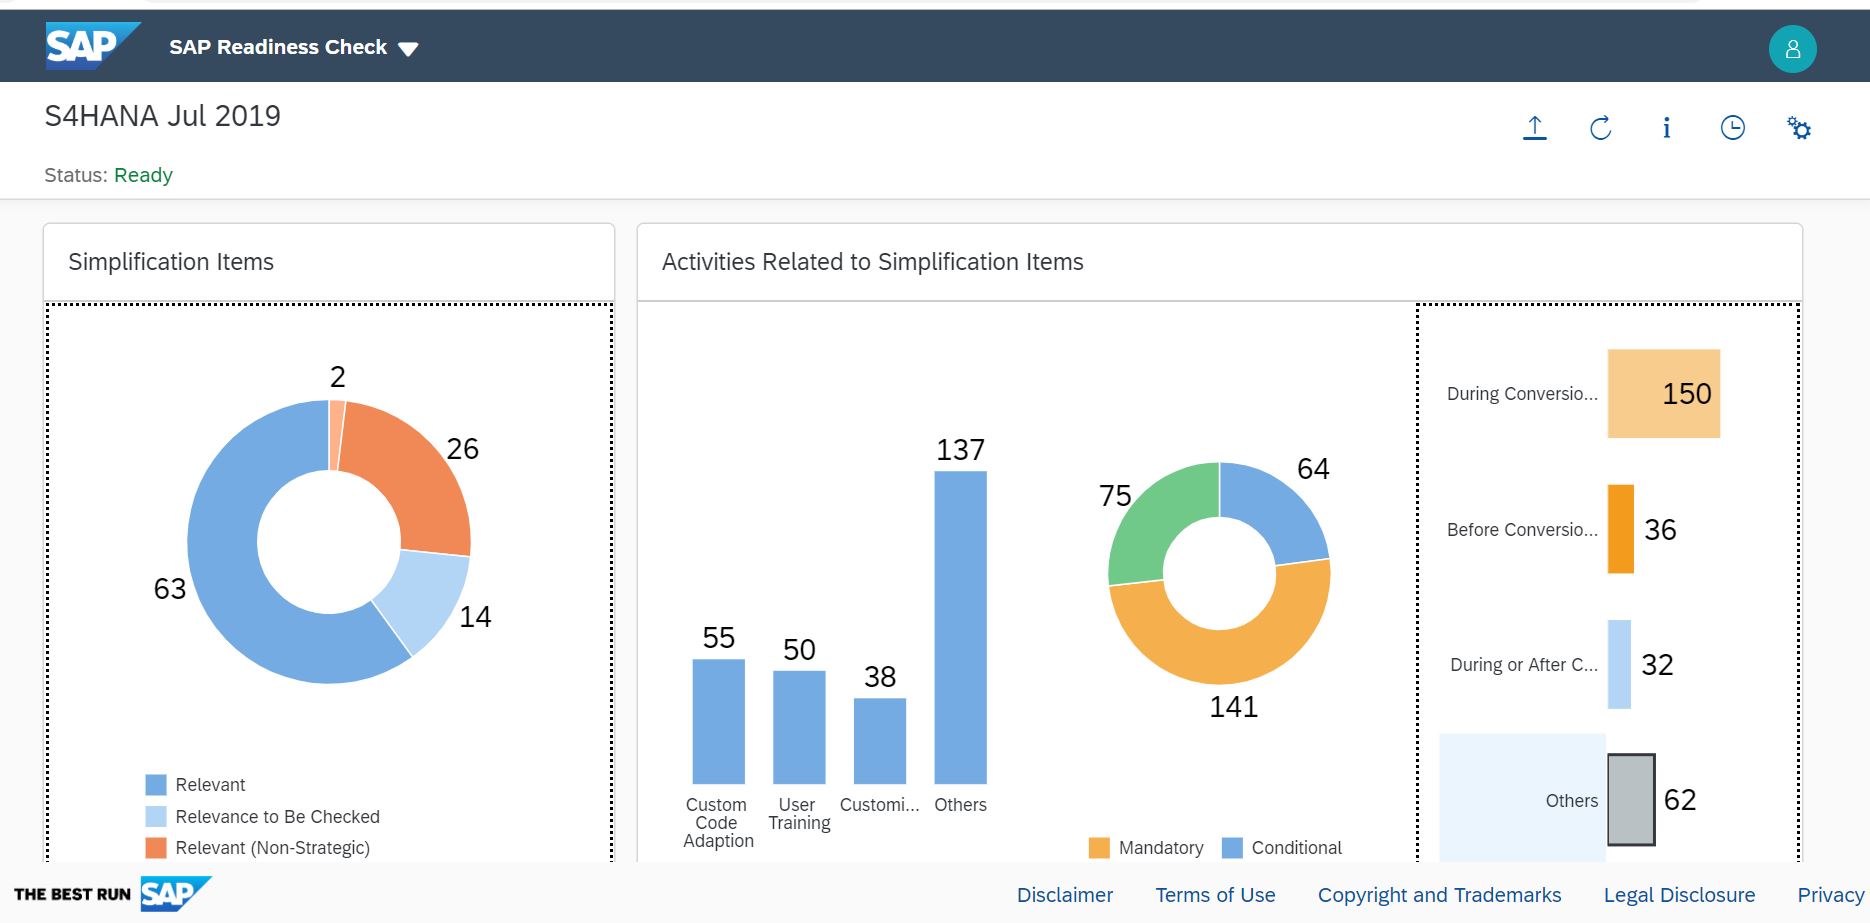
The results
Now you can start to enjoy the results:
You can use the settings button to allow more people to view the analysis results.
New functions
SAP keeps on improving the readiness check 2.0. The new features are published in SAP blog.
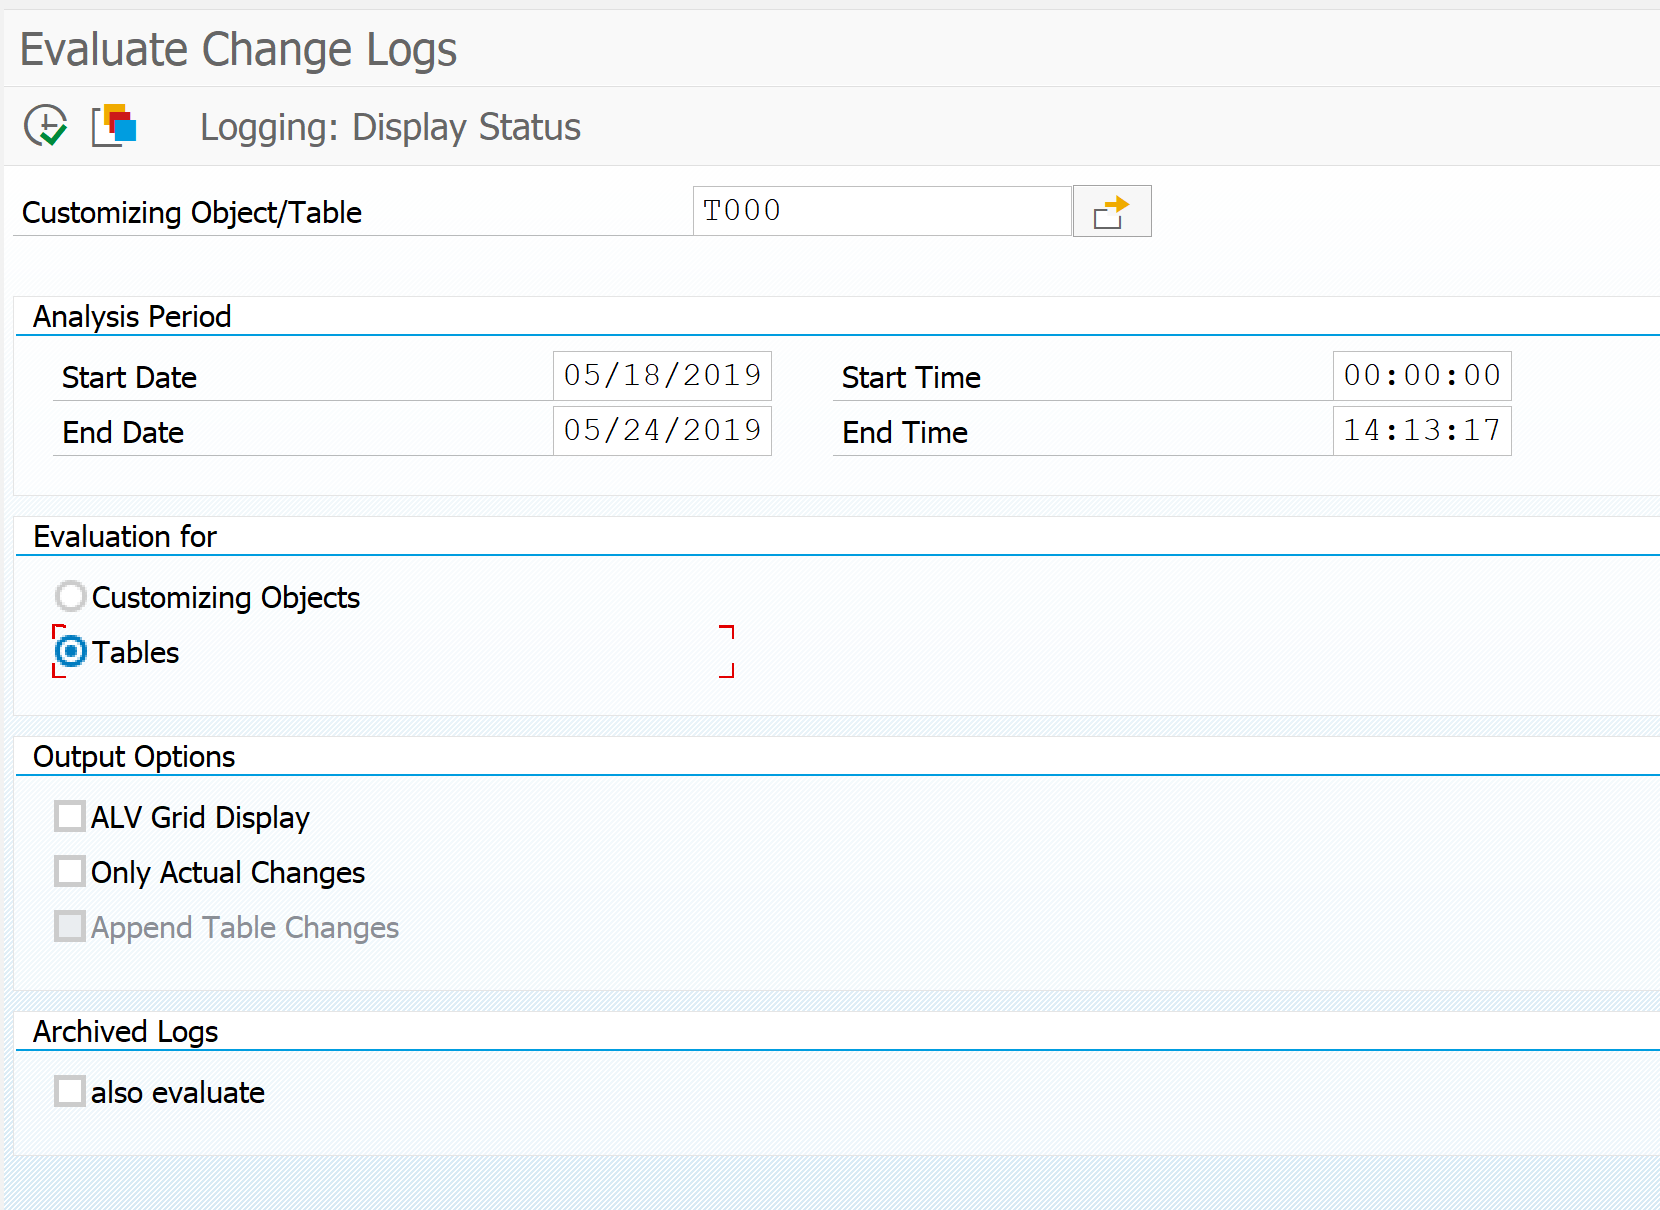
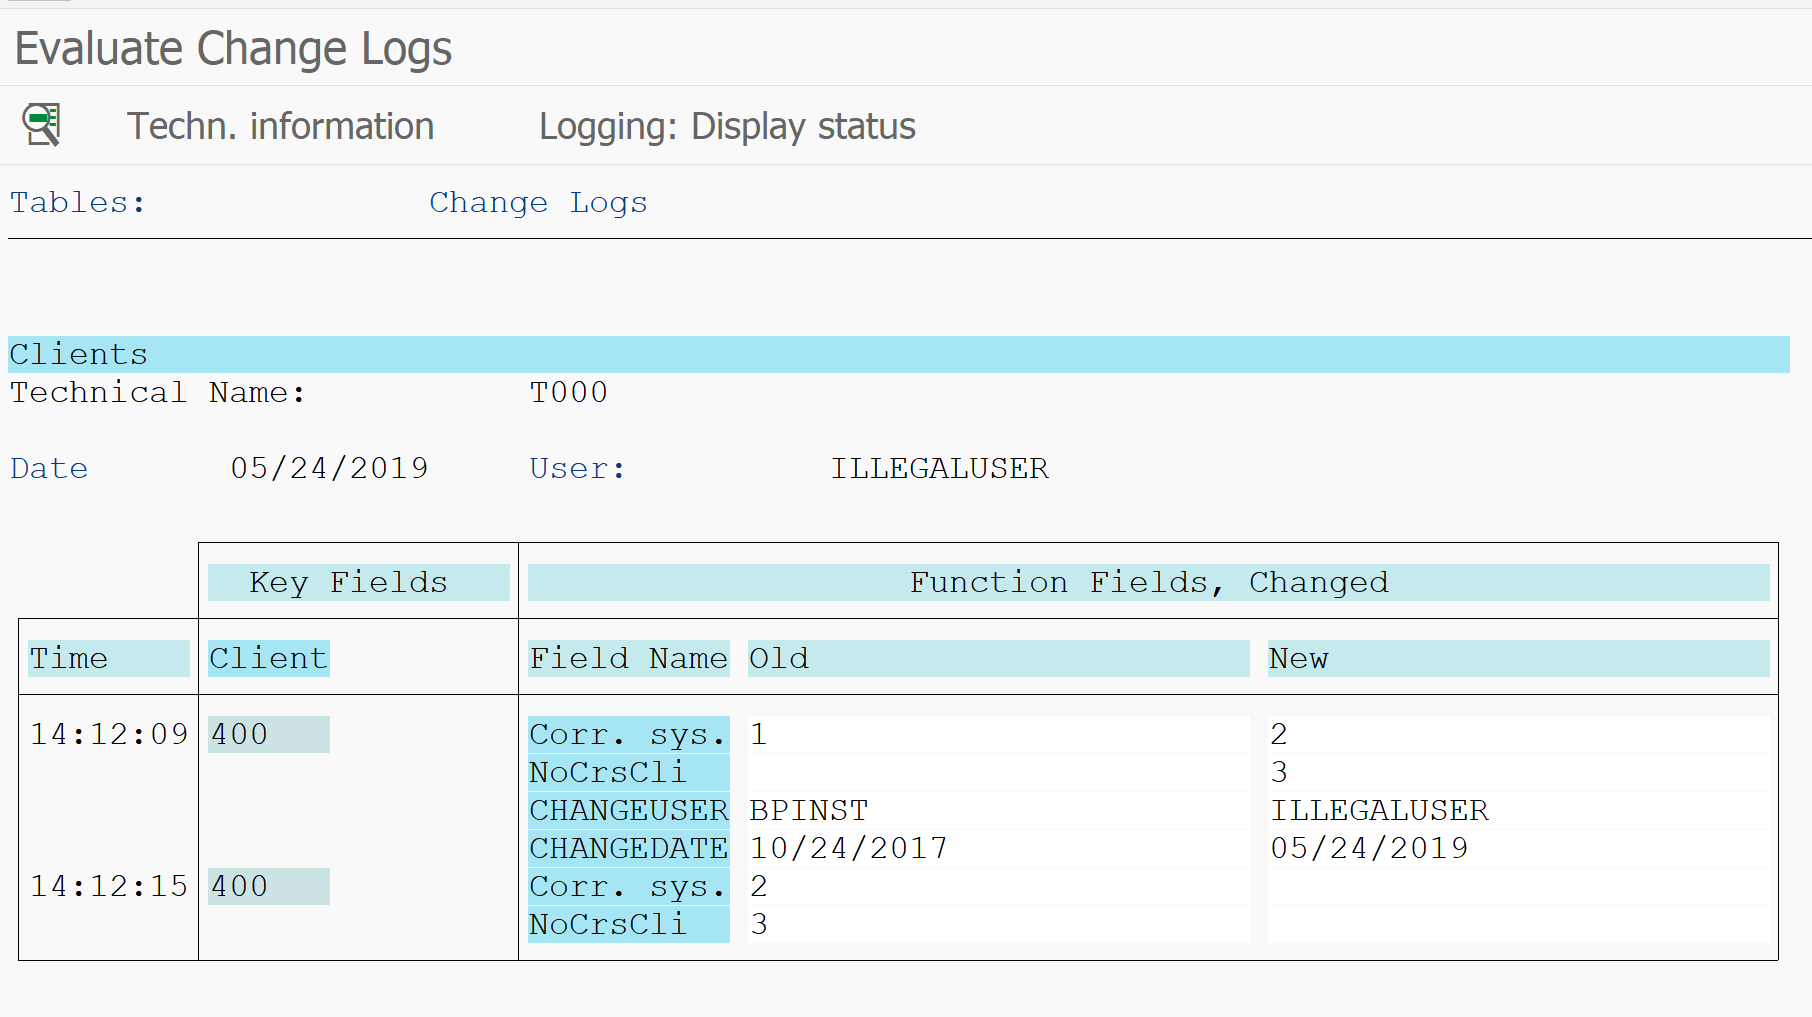
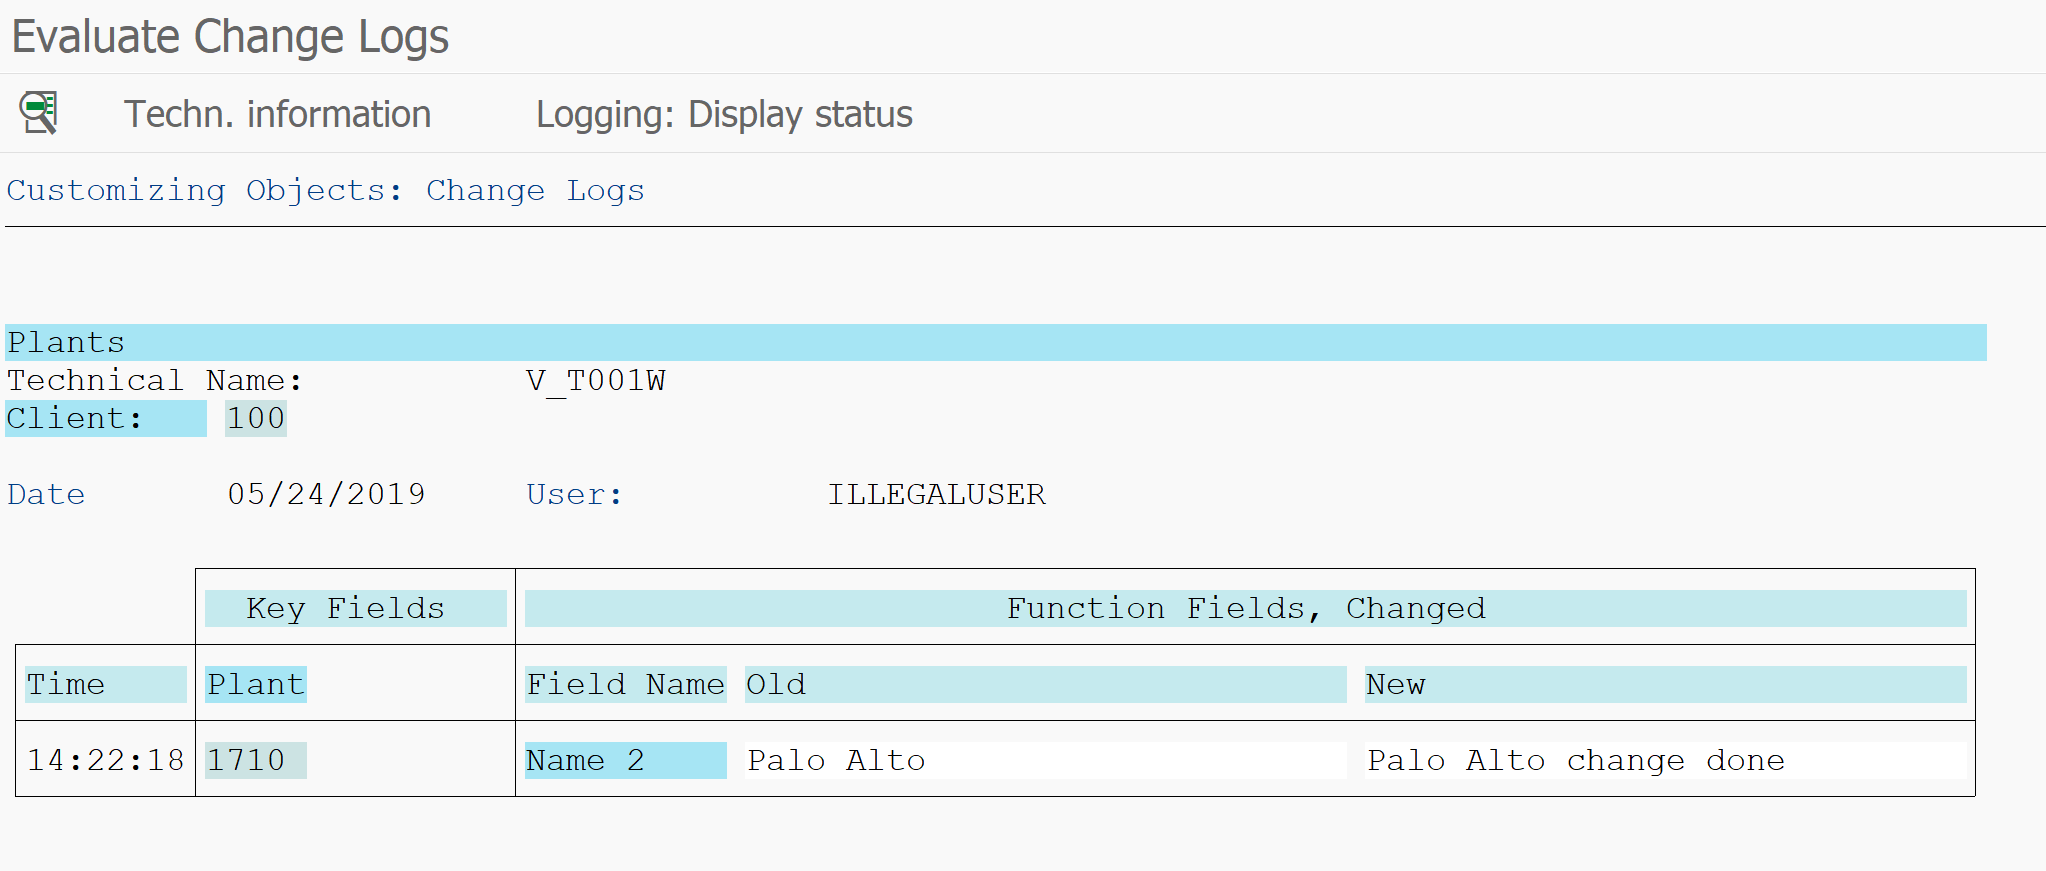
If you are in a customizing action and you want to see who did perform changes, select the menu Utilities and then option Change Log. Select date and time frame to analyze and press Execute. As example here changes to Plant Definition (table T001W):
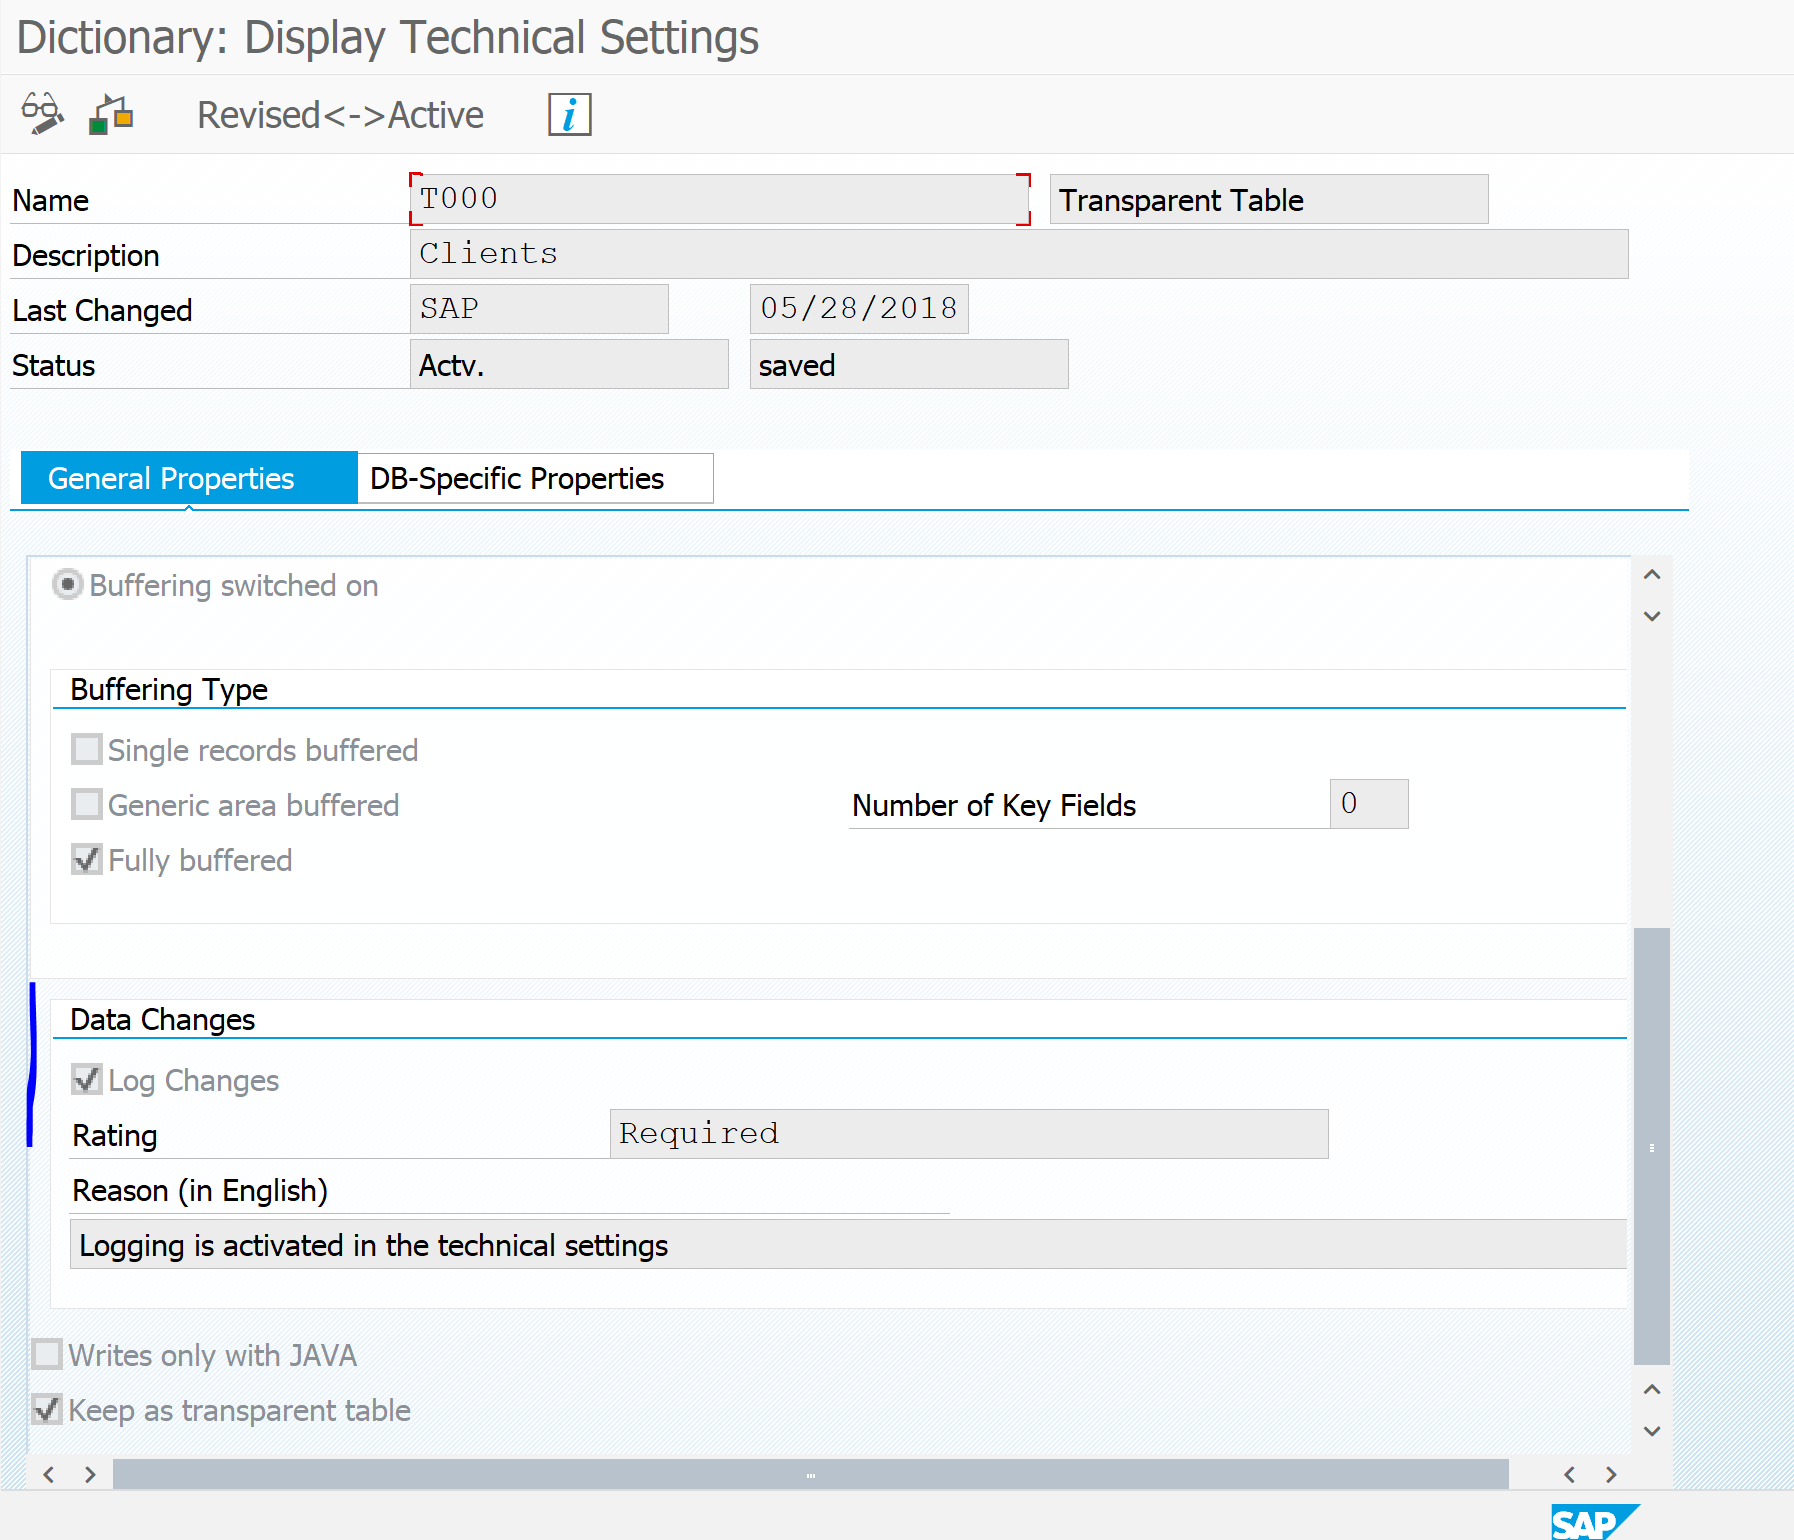
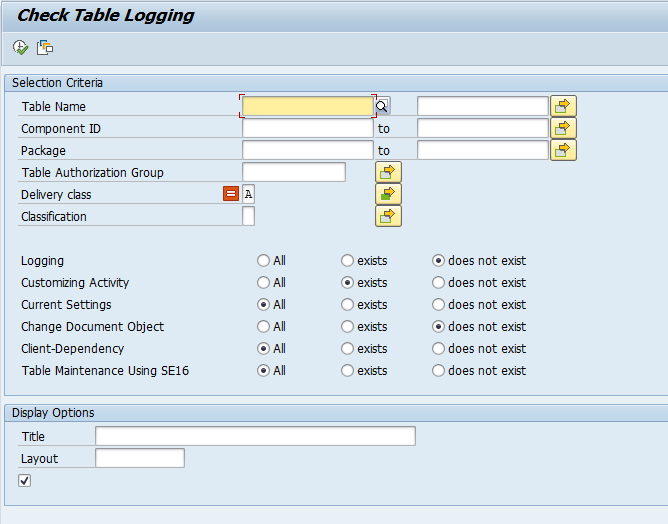
By default a lot of SAP configuration and important setting tables have the log changes activated. But not all. It is not uncommon to activate table logging for standard SAP configuration tables important for your business. For important custom configuration Z tables you might want to activate table logging.
Table logging is not a replacement for change documents. Standard SAP generates change documents for changes to documents that must be kept for tracking and audit purposes. This is common for all major transnational objects and its underlying tables. That is why for example for an important table like VBAK (sales order header) the table logging is off: change documents are already generated.
It is very bad practice to make use of table logging for business data reasons. Table logging is used for recording changes to configuration and if all theses logs are deleted there should be no business impact.
SAT ABAP runtime analysis is a great tool for analyzing performance issues. This tool can also be used to analyze ABAP web dynpro and FIORI applications. For more background on SAT tool itself, read this blog.
Questions that will be answered in this blog are:
How to run SAT tool for ABAP web applications?
Running SAT tool for ABAP web applications
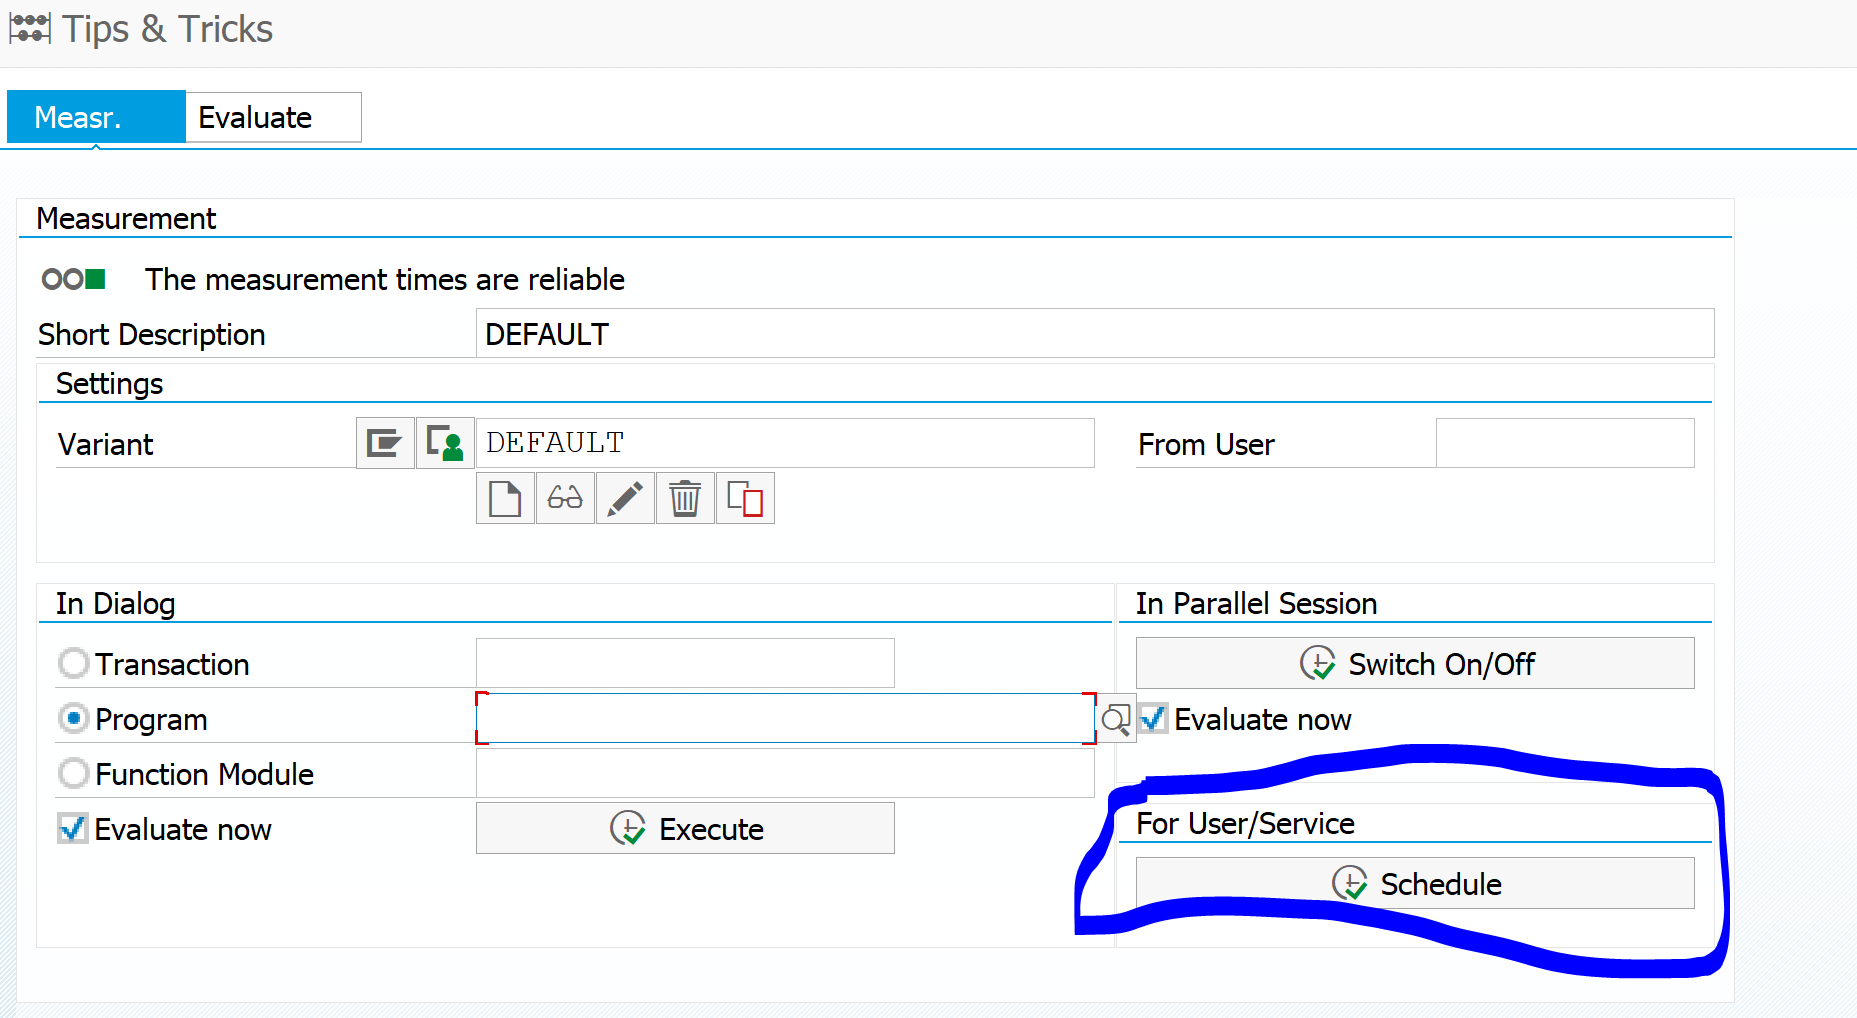
Start transaction SAT, and press the button Schedule in the block For User/Service.
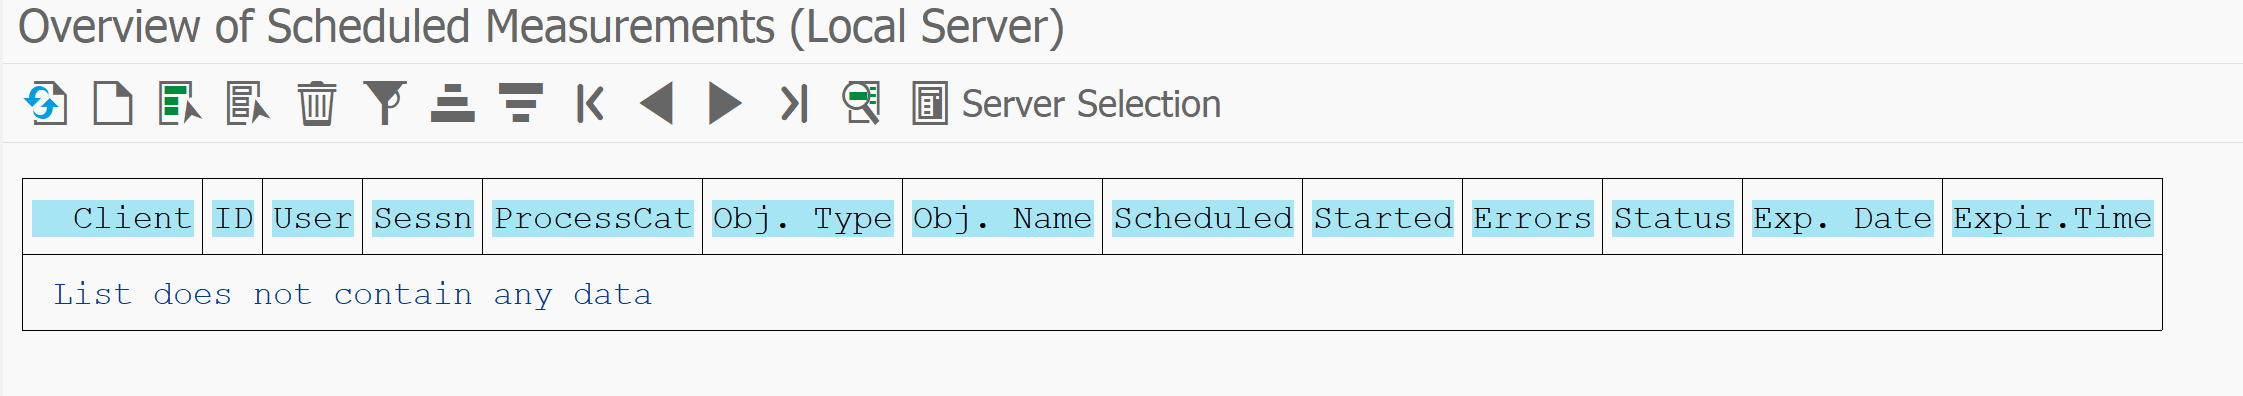
You now reach the measurement overview screen:
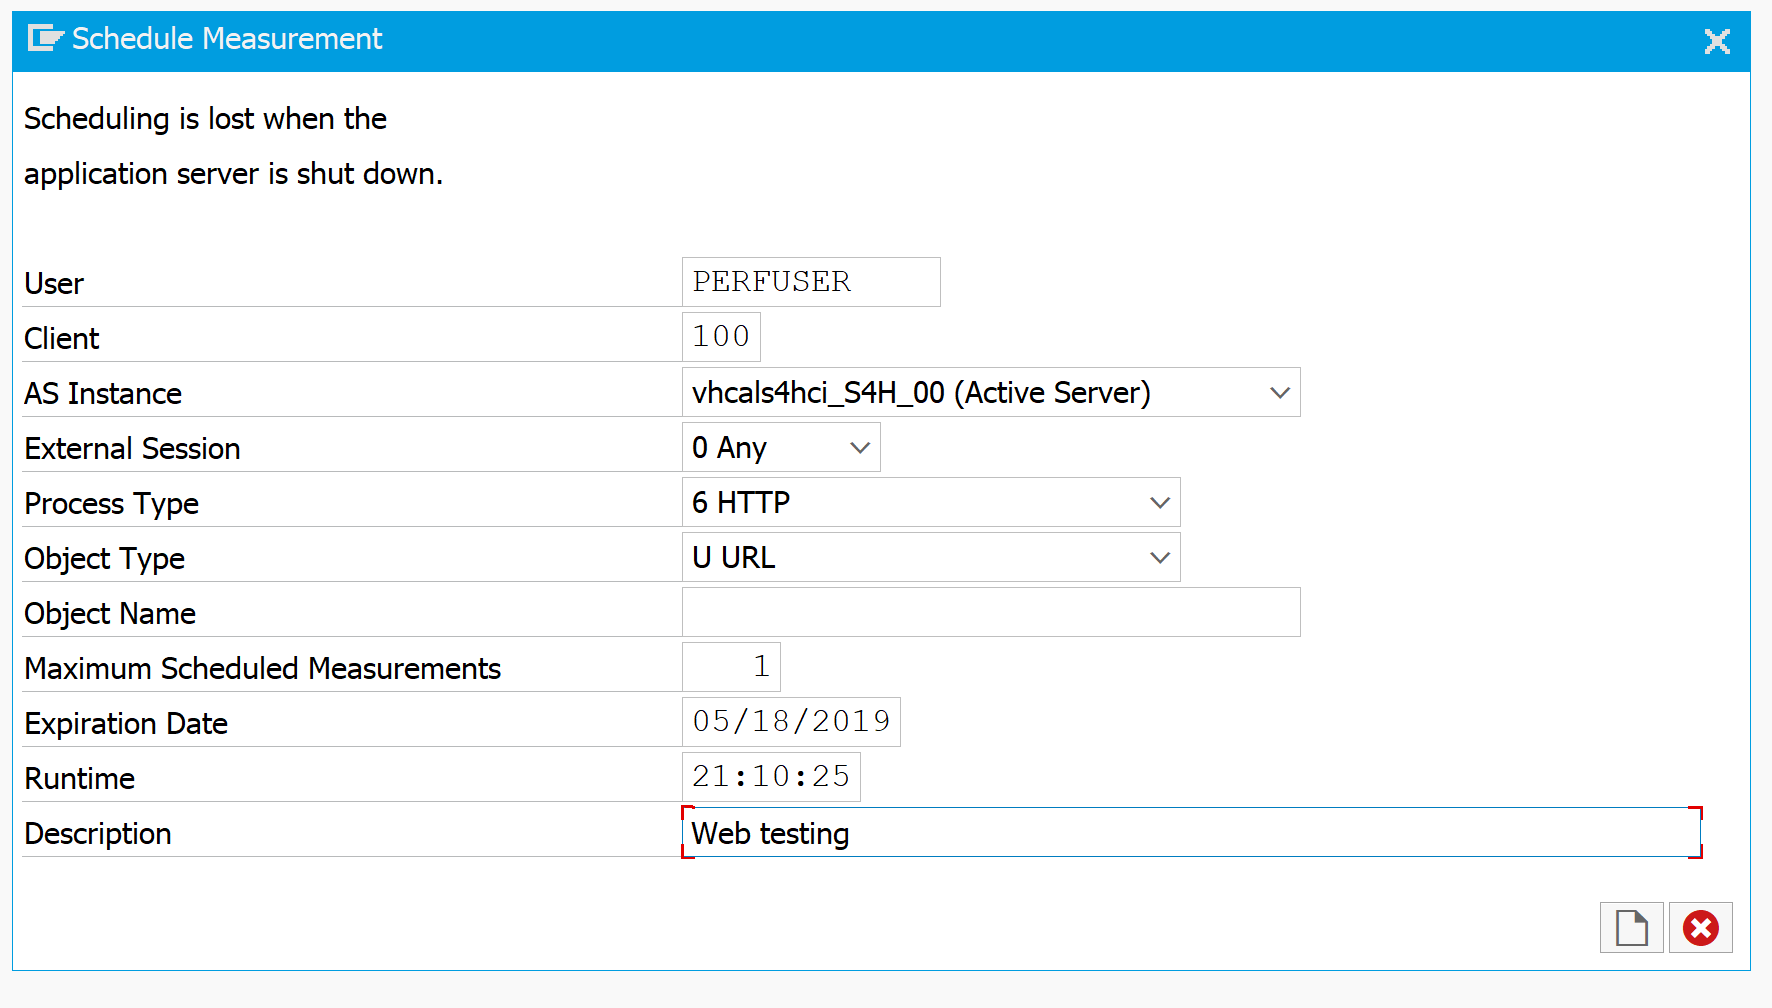
Now select the Schedule Measurement button. In the next screen fill out the user to trace and very important: switch the object type to URL and process type to HTTP:
Do not press the schedule measurement button yet. First go to the ABAP web application to the part you want to measure for performance. Afterwards delete the browser, since it will keep on sending data.
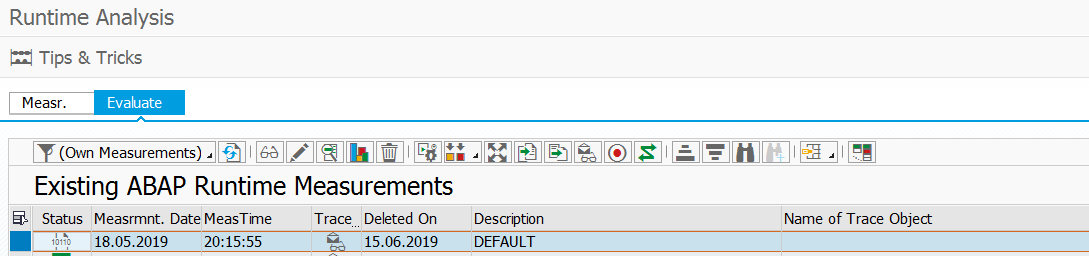
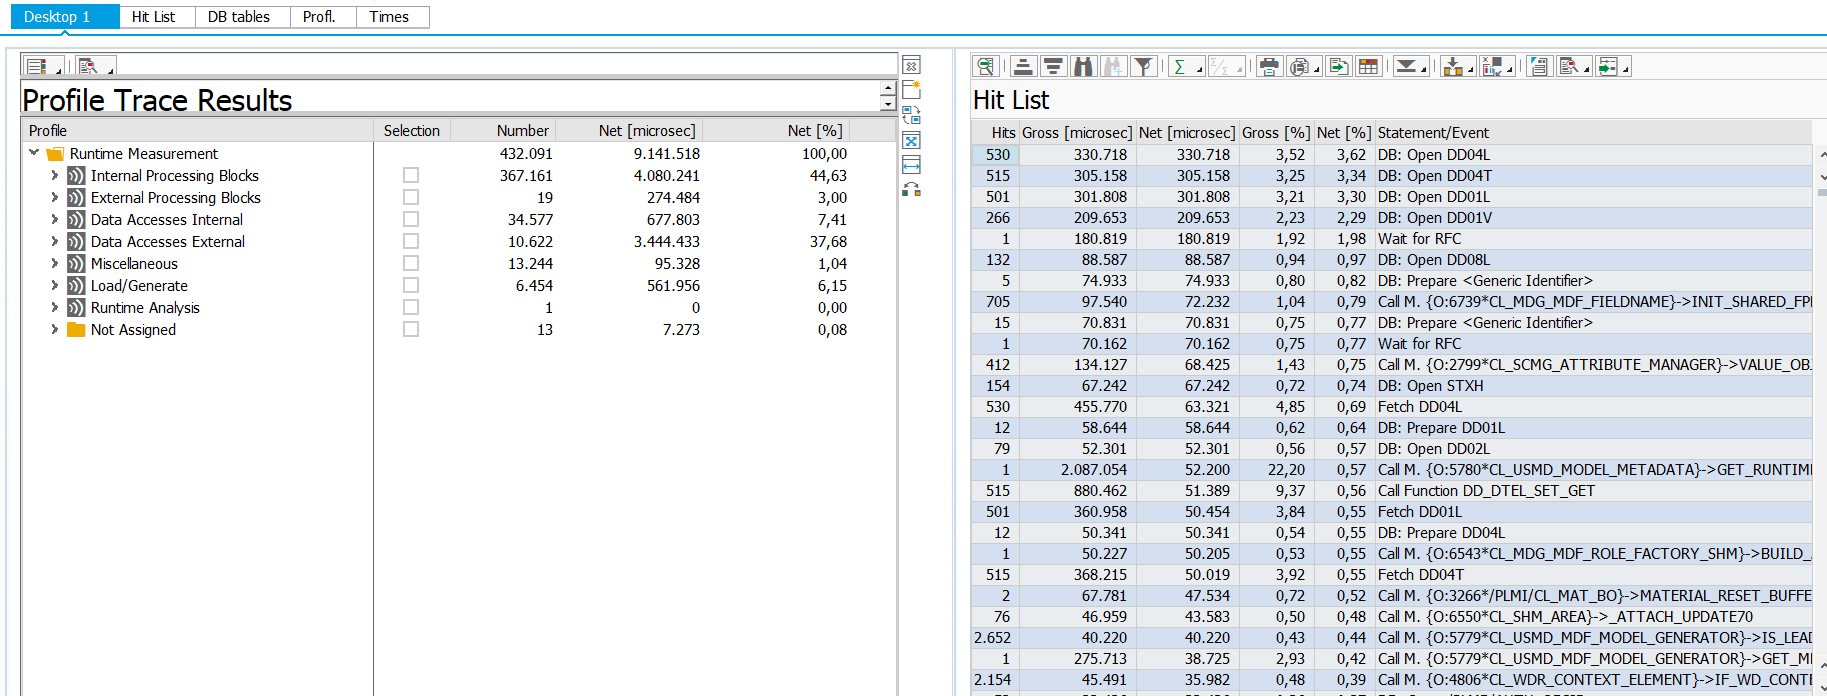
No you have to go back to the SAT start screen and click on the tab Evaluate:
Double click on your measurement line. The system will now read the measurement log files and process them. This can take some time. The end result screen looks again like a normal SAT result screen: