Support tool for MRP

Many times as basis person, you will be faced with system and performance issues in the MRP run.

SAP now has released a support tool for MRP that can help the functional MRP consultant with analyzing MRP issues.

Questions that will be answered in this blog:

  • How to install the Support tool for MRP?
  • What are the functions of the support tool for MRP?

Installation of MRP support tool

Installation of MRP support tool is simple: apply OSS note 3199068 – Support-Tool for MRP. After installation start transaction PP_MRP_SUPPORT to check correct implementation.

Running PP_MRP_SUPPORT

Start the MRP support tool with transaction or program PP_MRP_SUPPORT:

The I button (and note 3199068 – Support-Tool for MRP) will list all available functions in detail.

Important is the MRP consistency check:

After consistency is done, you can use the program to run for specific material/plant combination:

ST06 OS host monitoring

If you want to see how well your OS is doing in terms of CPU, memory, disc utilization, etc, then transaction ST06 OS host monitoring is your solution.

Questions that will be answered in this blog are:

  • How to use transaction ST06?
  • How to get information on CPU, memory and disc usage on OS level?
  • What is different in ST06 when my SAP system runs in the cloud?

ST06 transaction

Start transaction ST06:

Top left you can select the application server you want to inspect. On the right screen you see the details. Bottom left you can select different tools or specific sections and history.

For more background on all ST06 issues and functions, read OSS note 2067546 – ST06/OS07N: Overview note.

ST06 and systems running in cloud

If your SAP system runs on infrastructure in the cloud, your infrastructure provider may have a certain setup that may not allow all ST06 functions to work as with a system installed in your own data center.

OSS notes on this topic:

1656250 – SAP on AWS: Support prerequisites

2015553 – SAP on Microsoft Azure: Support prerequisites

2855850 – SAP Applications on IBM Power Systems Virtual Servers

3028990 – Some information is not displayed in ST06 on Azure Cloud – Netweaver

3101323 – Incorrect disk size values in ST06 for cloud systems

Other OSS notes

Other notes:

ST07 Application monitor

The ST07 application monitor tool can help you in analysis of your system for performance and usability. It gives an overview of how many users are using which functional part of your SAP system.

Questions that will be answered in this blog are:

  • How to run the ST07 application monitor?

Application monitor

If you start ST07 you reach the application monitor start screen:

Here you can see how many users are defined and actually logging on across the modules. Basis is very high usually since this includes SMEN which is the start menu. The Other category is for Z transaction codes and/or addon software.

By double clicking on any line you can inspect the lower application levels.

DB access analysis

From the main screen, you can hit the button DB accesses to view which application parts are responsible for the majority of the database accesses:

Reporting performance issues to SAP

Questions that will be answered in this blog are:

  • Which information should I provide when reporting a performance issue to SAP?
  • What should I have already checked before submitting performance issue to SAP?

When to report a performance issue to SAP?

You can report a performance issue to SAP when you are sure it is caused by standard SAP.

There are 2 cases:

  1. Overall system performance
  2. Specific transaction performance

Validations to be done upfront:

What information to provide in a performance issue to SAP?

In case of specific performance issues, add as much specific information as possible. Try to have a case in a development, test or acceptance system as well. In these systems SAP can replay the performance issue without running the risk of hampering the end users performance. Add trace files (ANST, ST12) to speed up the analysis for SAP. It also makes debugging and running large trace files easier for SAP.

SAP checklists

Good checklists are present in OSS notes:

ST12 performance tracing

The ST12 performance tracing tool allows you to collect performance data for solving a performance issue for a single transaction.

Questions that will be answered in this blog are:

  • Which data is collected in a ST12 performance trace?
  • How do I execute a ST12 performance trace?
  • How do I analyse a ST12 performance trace?
  • How can I export a ST12 performance trace?

Performance trace collection

Start transaction ST12:

Select the user ID that you want to trace (can be your own user) and leave the ST12 session open. In a second session execute your actions. When you are done, return to the ST12 session and press the End traces & collect button:

Confirm the traces to collect.

Evaluation of traces

On the Collected trace analysis screen section hit the Full screen button:

This will open the easier to use full screen mode for analysis:

Now you can expand the traces and use the ABAP trace, performance trace, SQL trace buttons to launch the required performance analysis tools.

For more background on the tools read the blogs about:

Downloading the trace file

You can download the generated trace file to export to different system or to send to SAP. For example you have recorded the trace in production and want to do the further analysis on the development system.

To export goto transaction ST13 and use tool ANALYSISBROWSER:

Then select menu option Download / Text Download / Export to frontend to download the trace to your desktop or laptop.

Background

OSS background notes on ST12 performance tracing:

Application server performance: ABAPMETER

Sometimes you might get very weird performance results in a productive system. In the end it might turn out that performance on an application server is ok, and on another one it is not ok. This can be because of different infrastructure per application server or different settings.

The ABAPMETER performance tool will help you to analyze the differences between application servers. It will fire a series of standardized tests to each application server.

Questions that will be answered in this blog are:

  • How to run the ABAPMETER performance tool to check for differences in application server response times?

Running the ABAP meter performance tool

Start transaction ST13 and select tool PERF_TOOL to goto the performance tools:

Now select the ABAPMETER tool and press execute:

The tool will now run the tests per application server. Pending on the amount of application servers it might take a few minutes.

Results are shown:

You can now see if there are significant differences between the application servers.

Even if all are the same, note 2879613 – ABAPMETER in NetWeaver AS ABAP also contains hints on some of the key values. They might show network issues.

Background

Background OSS notes:

Snapshot monitoring

Snapshot monitoring enables you to capture snapshot of current performance and usage of work processes. This can be used to analyze performance issues.

Questions that will be answered in this blog are:

  • How to setup snapshot monitoring?
  • How to analyze the results of snapshot monitoring?
  • How can I see SM50 processes running when there are issues?

Setting up the snapshot monitor

Start transaction /SDF/SMON for snapshot monitoring:

If you don’t have any snapshot monitoring yet, you will reach the schedule screen:

Now you can plan a separate snapshot monitoring run, or set up the daily run:

For each run: check to increase the Interval timing!

Analyzing the snapshot monitoring results

With the Analysis button you can analyze the results:

In the snapshot monitor (/SDF/MON) you can drill down:

Double clicking at the line shows you the SM50 processes running at that point in time:

This enables you to analyze issues that occur for example in the middle of the night, and you want to see what is running at that point in time.

References

The tool /SDF/MON has been replaced by the SMON tool in netweaver 7.5 (using tcode /SDF/SMON). You will find notes for both tools.

SAP wiki for snapshot monitoring can be found on this link.

Explanation OSS notes:

Bug fix OSS notes:

First aid kit for performance issues on ABAP stack

This blog will give some first aid kit tips on performance issues on ABAP stack reported by end users. The system is up and running, but still user(s) complain about performance. What to do first?

SM50/SM66

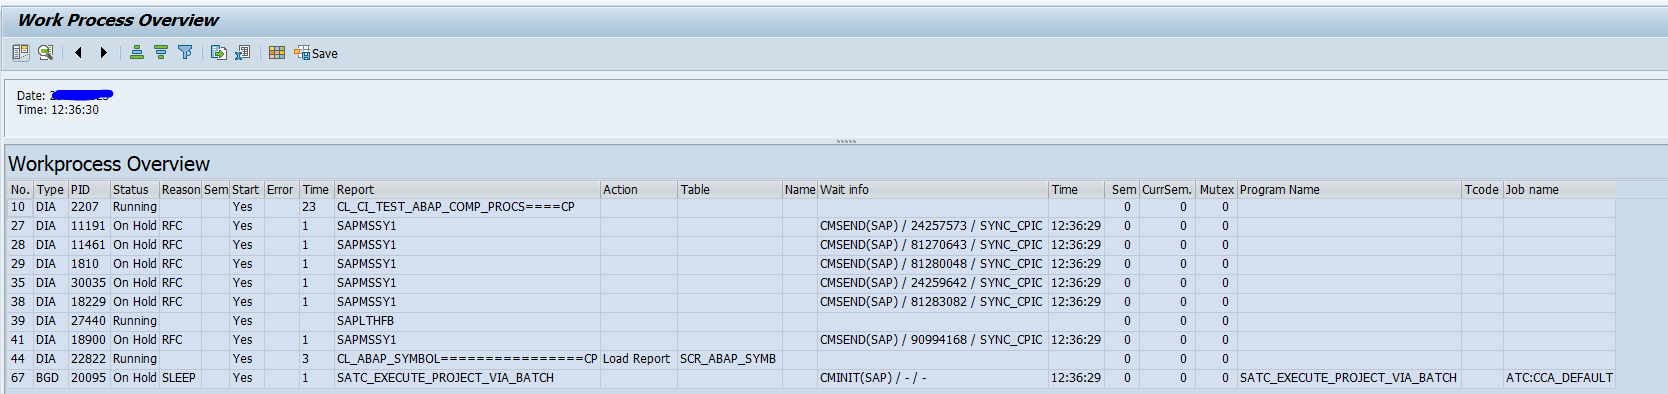
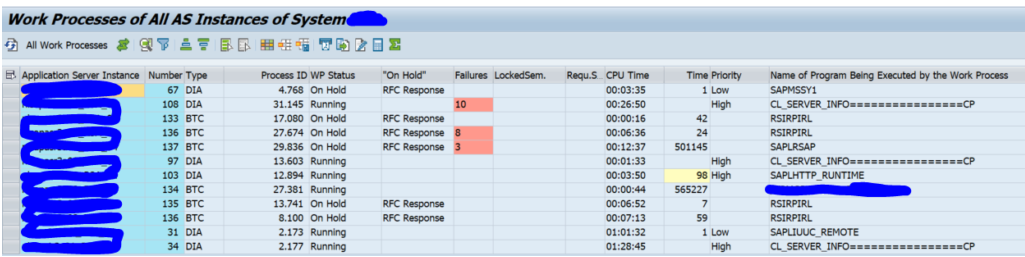
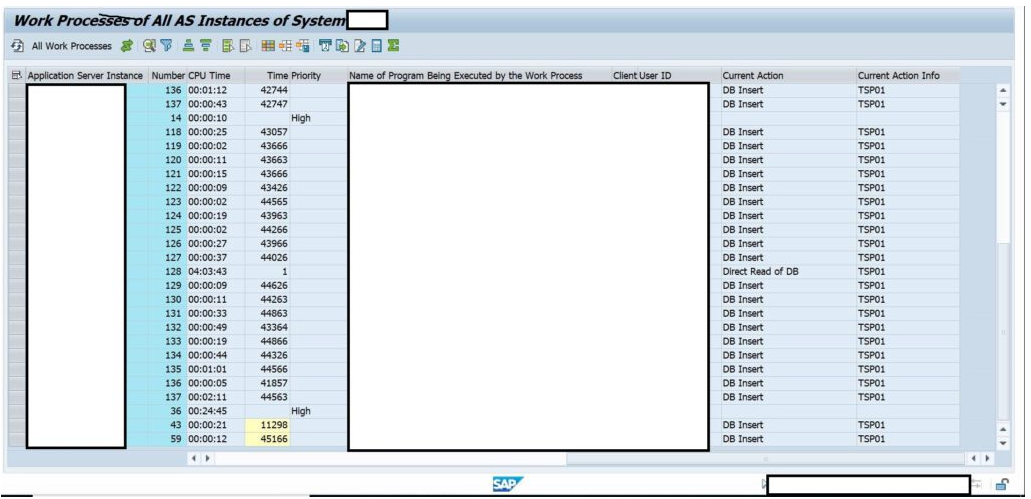
Basically the first analysis always starts with SM50 (or when you have multiple application servers SM66).

Checklist for SM50:

  • Are all the DIA dialog processes full or almost full? –> if yes, then performance as total system will be slow. Check to find source for having so much DIA’s active.
  • Are all the BTC dialog background processes full? –> if yes, then all other batches will wait.
  • Are the UPD processes full? –> if yes, then all the other updates have to wait.
  • Are the SPO processes full –> if yes, then all prints have to wait.

Now you have a first impression of the state of the system.

Asking the user the right questions

Go back to the user complaint and start to ask questions:

  • Is he the only user complaining? Or are multiple users complaining?
  • Is the complaint about online or background job? Users can complain like ‘system performance is slow, since my background job takes a long time to start’
  • Is the complaint for updating or querying?
  • Is the complaint about printing?
  • Is the complaint about about performance in general or a specific transaction?
  • Is the complaint running now, or was it in the past?

If possible ask the user to start the poor performing transaction now so you can monitor it in SM50.

Solution kit

Too little dialog processes

If you cannot quickly locate the source of the process that is causing to consume all the dialog processes, you best temporarily increase the amount of DIA processes in the operation modes in RZ04.

Background processes full

Check to find the source of the large amount of background processes. If still too few, you can temporarily increase the amount of DIA processes in the operation modes in RZ04.

Another option is to check if some jobs can be stopped and planned at a later time.

Update processes full

If the update processes are full, check if the update process is running correctly in SM13.

Spool issues

If no prints are coming out of the system, there might be an issue with spool number range. System can look like this:

OSS note 48284 – System cannot generate any more spool requests contains the workprocedure.

Another solution can be to delete old spools.

If there are too many prints and too little spool processes, increase the amount of SPO processes in RZ04.

Buffering issues

Use transactions ST02 and AL12 to check for buffering issues. Read more about SAP buffering in this blog.

SAP references

SAP survival guide for performance issues: SAP note 2442365 – Survival Guide for performance analysis on SAP system contains an excellent PDF attachment for analyzing performance issues.

OSS note 948066 – Performance Analysis: Transactions to use lists all relevant performance related transactions.

RFC connections with fast serialization

Fast serialization is an option in the RFC settings to increase performance.

Questions that will be answered in this blog are:

  • What is required to use RFC fast serialization?
  • When to use RFC fast serialization?
  • How can I switch to fast serialization without touching the RFC in SM59?
  • How do I make the settings for RFC fast serialization?

Fast serialization

Fast serialization is available since release Basis 7.51. Downport might be possible, but think twice if you want to do this. Background OSS note on fast serialization is 2372888 – Fast serialization in RFC.

The whole goal of fast serialization is simply to increase the performance.

The fast serialization option is set in the RFC destination on the tab Special Options at the bottom:

Note that in S4HANA destination NONE is using fast serialization by default. Keep it that way.

Switching to fast serialization without touching SM59

In SM59 when you touch the RFC it might request you to re-enter the password. You can still switch the existing RFC without touching SM59. The instruction is in OSS note 2315100 – Activation of new RFC serialization on client side. Run program SFASTRFCMAINTENANCE:

When to use fast serialization

Fast serialization can be used when both the sender and receiver side of the RFC connection supports it.

Fast serialization in custom or standard RFC function modules

In SE37 SAP can set an RFC enabled function module Interface Contract to Fast serialization required. If you have build custom RFC function module that also only works with Fast serialization you should set this option:

Bug fix OSS notes

3315843 – Shortdump when using fast serialization for t/qRFC

SWLT performance tuning worklist

This blog explains how to use the SWLT performance tuning worklist to find poorly performing Z code by combining SQL monitoring data from production and ATC results.

Questions that will be answered are:

  • How to setup the SWLT performance tuning worklist tool?
  • How to analyze the results from the SWLT performance tuning worklist tool?

Preparations

As preparation for the SWLT tool you must have run the SQL monitor in a productive system and created a snapshot of the data. This snapshot you can export and import in a development system (see note 2700312 – How to import SQL Monitor (SQLM) extracted data). In the development system you configure and run the ATC code check tool.

The SWLT performance tuning worklist tool will combine these results. As example we will use this poorly written Z code:

Running the SWLT tool

Start transaction SWLT:

You can reduce the scope by just taking the needed Z packages. Goto the tab Static Checks to select the appropriate result of the ATC run (for more on ATC read this blog):

Now select the SQL monitor tab to select your SQLM data snapshot you took from your productive system:

Now that all data is loaded, you can hit the execute button to start the SQL performance tuning worklist.

It might be you don't see the SQLM snapshot in SWLT. In that case create a new snapshot from SWLT directly.

The tool will now start to merge the results. In the example above you can see the following result:

In the total result select a line. On the bottom left you can see the SQL monitor results. Bottom right you can see the ATC check result. Clicking on the underlined program or SQL statement will bring you to the poorly performing ABAP code point.

Bug fix notes

3060630 – Runtime error RUNT_INTERNAL_ERROR while fetching SQLM data (e.g. via SWLT)

Exit mobile version