S4HANA readiness check 2.0

SAP has released the S4HANA readiness check 2.0.

This blog will answer the following questions:

  • How to install S4HANA readiness check 2.0?
  • How to run the S4HANA readiness check 2.0?
  • How to see the results for the S4HANA readiness check 2.0?
  • Where to find more background information on the SAP readiness check 2.0?

How to install S4HANA readiness check 2.0?

SAP OSS note 2758146 – SAP Readiness Check 2.0 & Next Generation SAP Business Scenario Recommendations and 2913617 – SAP Readiness Check 2.0 contain all the installation instructions.

Short sequence of steps:

  1. de-implement OSS note 2310438 – SAP Readiness Check for SAP S/4HANA – Managed System if it was applied
  2. Implement OSS note 2745851 – Business Process Improvement Content for SAP Readiness Check 2.0 and Next Generation SAP Business Scenario Recommendations
  3. Update or implement OSS note 2185390 – Custom Code Analyzer
  4. Update or implement OSS note 1872170 – ABAP on HANA sizing report (S/4HANA, Suite on HANA…)
  5. Update or implement OSS note 2399707 – Simplification Item Check
  6. Implement OSS note 2769657 – Interface Discovery for IDoc as part of Readiness Check
  7. Implement OSS note 2612179 – DVM API to trigger and monitor DVM ST14 analyses for Readiness Check
  8. Implement OSS note 2972792 – Financial Data Quality: Trigger Data Collection Reports to Check Your Financial Data Quality and to Enable the Financial Data Quality Check in SAP Readiness Check
  9. Implement OSS note 2903677 – SAP Readiness Check: Effort Drivers of Simplification Items Check
  10. Implement OSS note 3010669 – Enhancements to SAP Readiness Check Dashboard for Business Partner/CVI
  11. Implement OSS note 2758146 itself

Next to these notes, if you are using ATC, it is wise to also apply OSS note 2781766 – Enabling ATC check result export for SAP Readiness Check 2.0.

Also apply the notes mentioned in OSS note 3061414 – Enabling extended integration impact analysis for SAP Readiness Check, if you want to include ALE scenario’s in your analysis.

As you can see from the list of OSS notes there are improvements in the area of idocs, data volume management and business process analysis.

For this reason SAP recommends to run the S4HANA readiness tool on productive system.

It is possible to run on a recent copy, provided you copy the ST03N data from production to the recent copy. This process is described in OSS note 2568736 – SAP Readiness Check for SAP S/4HANA – copy ST03N data.

Troubleshooting guide is OSS note 2968380 – SAP Readiness Check Report 2.0 – troubleshooting guide.

Other notes to check:

Run S4HANA readiness check 2.0

There are 2 data analysis programs to run: SYCM_DOWNLOAD_REPOSITORY_INFO and RC_COLLECT_ANALYSIS_DATA.

First you run SYCM_DOWNLOAD_REPOSITORY_INFO on development system to fetch information about your Z coding:

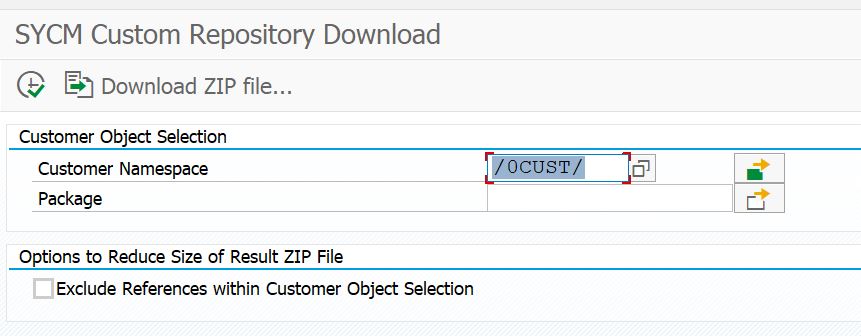
The tool will launch batch job. After job is done download the zipfile to your local PC.

If you are asked to regenerate the ABAP indexes run program SAPRSEUC in the background and be very patient. See blog on ABAP where used index for more background information. See also OSS note 2655768 - Custom Code Analyzer - The where-used list index for customer objects is not up to date.

Second program you need to run on production. So you first need to transport all the notes to production. The notes are large and can take up to 20 minutes import time. So take a quiet time at the productive system to import them.

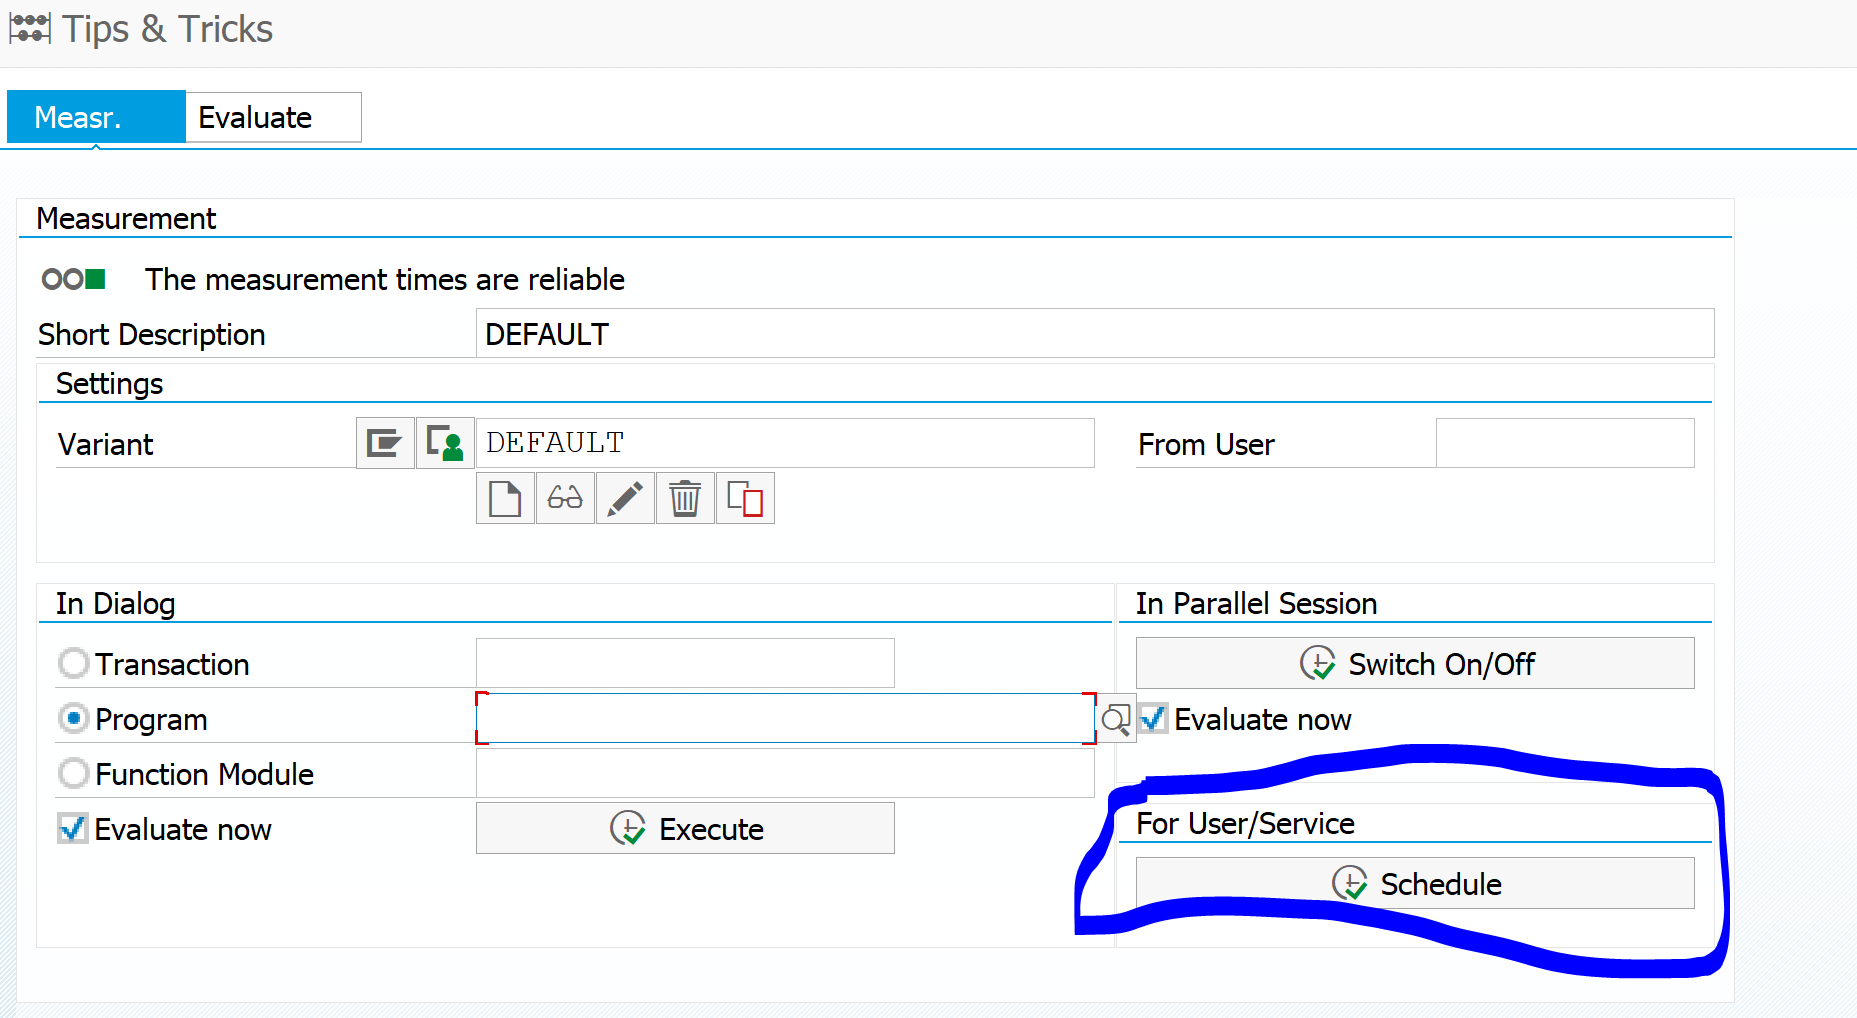
Start program RC_COLLECT_ANALYSIS_DATA in your productive system:

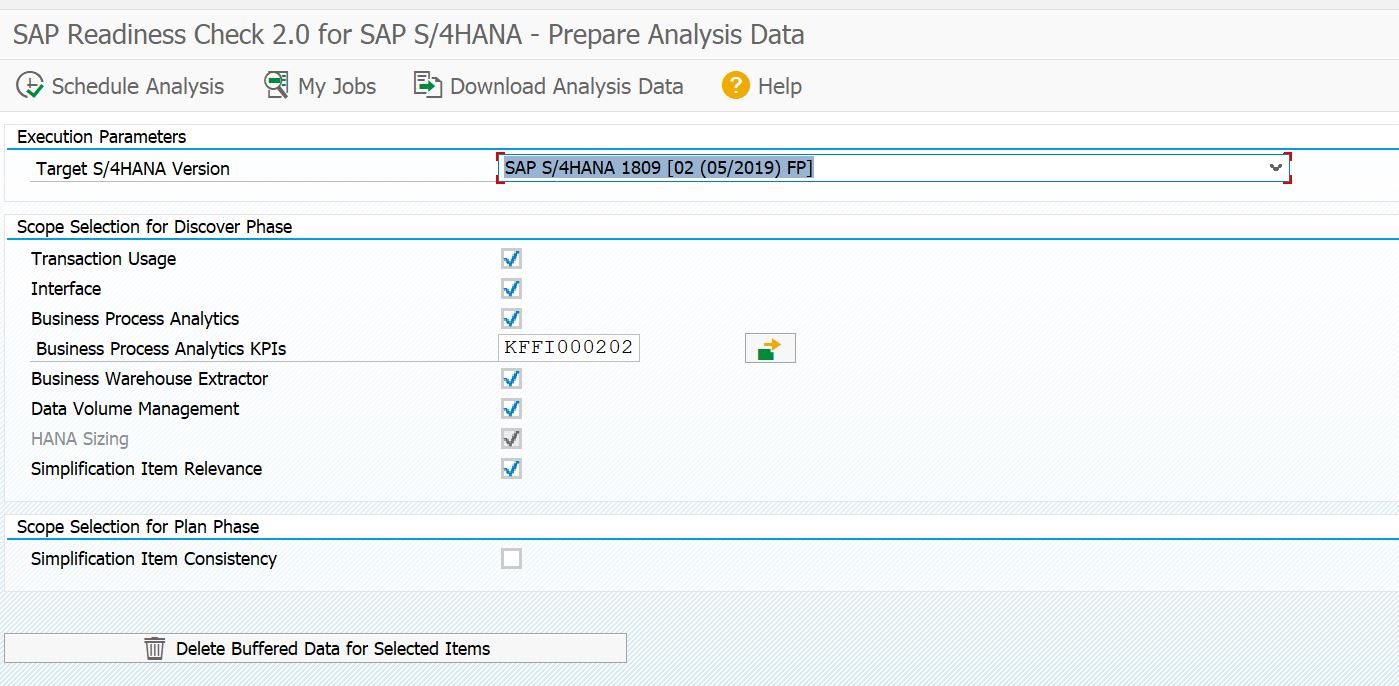
Select your target version and press execute. This will launch multiple batch jobs. Wait for all the jobs to finish and start program again to download the ZIP file to your PC.

CVI integration

As explained in OSS note 3071549 – Buttons in the report RC_COLLECT_ANALYSIS_DATA the report RC_COLLECT_ANALYSIS_DATA now has a link to the CVI integration (customer vendor).

Financial Data Quality (FDQ)

The newer version of S4HANA readiness report has option analyze the financial data quality. This is important, since a lot of time and effort during the conversion is spend on the financial data migration.

Follow the instructions in OSS note 2972792 – Financial Data Quality: Trigger Data Collection Reports to Check Your Financial Data Quality and to Enable the Financial Data Quality Check in SAP Readiness Check to enable this function.

Data profiling

More information the data profiling done by the readiness check can be found in OSS note 3112362 – SAP Readiness Check for SAP ERP Usage and Data Profiling.

Uploading the data

SAP OSS note 2758146 – SAP Readiness Check 2.0 & Next Generation SAP Business Scenario Recommendations contains the upload URL. The current URL is http://rc.cfapps.eu10.hana.ondemand.com .

Hit the start New Analysis button and upload the file from the RC_COLLECT_ANALYSIS_DATA program. Wait for the SAP site to finish the analysis. It will be visible on the site as Recent Analysis.

Don’t forget to push the update analysis button to upload the second file with the custom code analysis from program SYCM_DOWNLOAD_REPOSITORY_INFO.
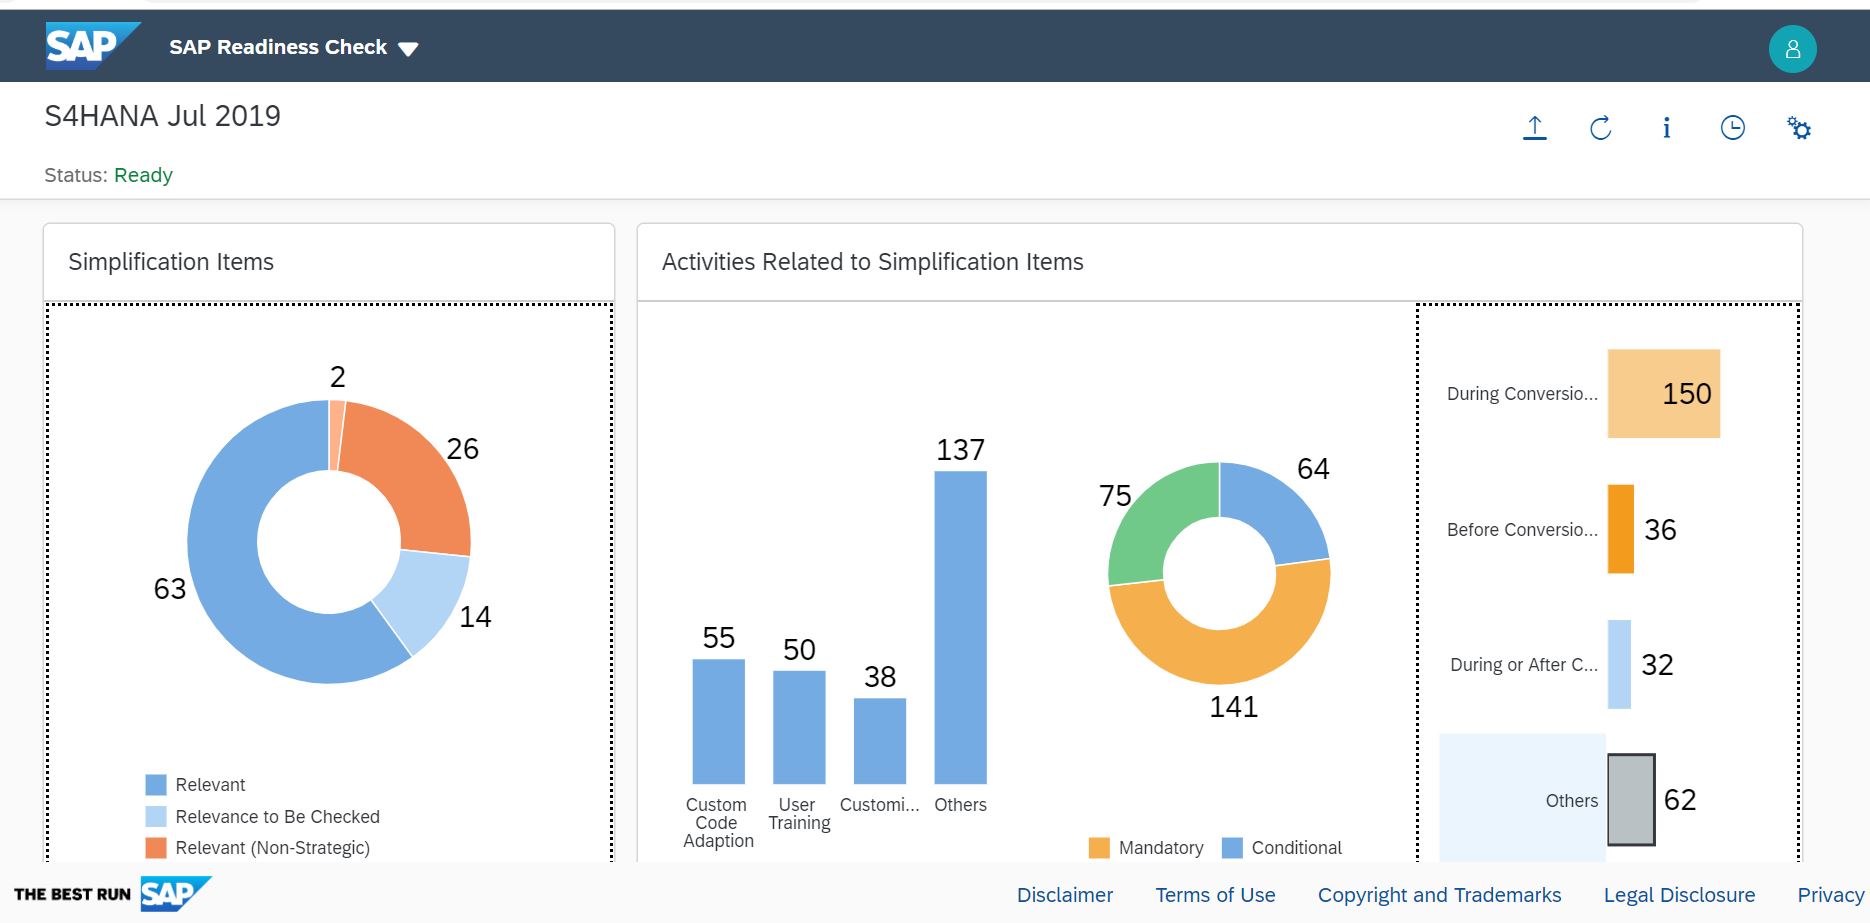
The results

Now you can start to enjoy the results:

You can use the settings button to allow more people to view the analysis results.

New functions

SAP keeps on improving the readiness check 2.0. The new features are published in SAP blog.

Background information

More background information can be found at:

More S4HANA conversion preparation steps

For more S4HANA conversion preparation steps, read this blog.

SAT ABAP runtime analysis for ABAP web applications

SAT ABAP runtime analysis is a great tool for analyzing performance issues. This tool can also be used to analyze ABAP web dynpro and FIORI applications. For more background on SAT tool itself, read this blog.

Questions that will be answered in this blog are:

  • How to run SAT tool for ABAP web applications?

Running SAT tool for ABAP web applications

Start transaction SAT, and press the button Schedule in the block For User/Service.

You now reach the measurement overview screen:

Now select the Schedule Measurement button. In the next screen fill out the user to trace and very important: switch the object type to URL and process type to HTTP:

Do not press the schedule measurement button yet. First go to the ABAP web application to the part you want to measure for performance. Afterwards delete the browser, since it will keep on sending data.

No you have to go back to the SAT start screen and click on the tab Evaluate:

Double click on your measurement line. The system will now read the measurement log files and process them. This can take some time. The end result screen looks again like a normal SAT result screen:

SAT ABAP runtime analysis

The SAT ABAP runtime analysis tool can be used to identify performance problems in ABAP programs.

Questions that will be answered in this blog are:

  • How to run the SAT tool?
  • How to read the results of the SAT tool?

Starting the SAT tool

The SAT ABAP runtime analysis tool can be started with transaction SAT:

Top left there is a Tips & Tricks button. This will bring you the to the following tool:

Here you can compare the optimal and not optimal way of coding. By hitting measure runtime button you can actually compare in real time the difference between the 2 methods.

The performance issue program

To test the tool, we first write a simple test program:

REPORT zperftest2.

DATA: zlt_vbak TYPE TABLE OF vbak.
DATA: zls_vbak TYPE vbak.
DATA: zlt_vbap TYPE TABLE OF vbap.
DATA: zls_vbap TYPE vbap.
DATA: zls_vbap2 TYPE vbap.

SELECT * FROM vbak INTO TABLE zlt_vbak UP TO 100 ROWS.

LOOP AT zlt_vbak INTO zls_vbak.
  SELECT * FROM vbap INTO zls_vbap.
    DO 10000 TIMES.
      zls_vbap2 = zls_vbap.
    ENDDO.
  ENDSELECT.
ENDLOOP.

Now we start the SAT tool, enter the program name. Make sure the tick box evaluate immediately is on and press Execute.

Now the measurement will start.

Result of the trace tool

The result of the trace tool is as follows:

On the left side you see the split in where the program spends it time. Here you can see that most of the time is spend on internal processing and not on SQL statements. SQL statement can be analyzed from the SAT tool or from the ST05 SQL trace tool.

By double clicking on the the internal access the right hand side of the screen is filled. Here you can see in which code blocks the most net and gross time is spent. It does not always point you to the exact statements that are not ok, but it can point you to the program that is causing the biggest delay.

In our case the DO 10000 TIMES loop is the performance killer. With only SQL tracing this cannot be found.

Runtime analysis for web applications

For runtime analysis for web applications, read this dedicated blog.

Relevant OSS notes

Check and if needed you can apply these OSS notes to solve bugs in the SAT tool:

ST05 SQL performance tracing

Performance issue solving is an important job for ABAP and basis consultant. One of the helpful tools is ST05 SQL performance trace tool.

Questions that will be answered in this blog are:

  • How to switch on ST05 SQL trace?
  • How to read the results from the ST05 SQL trace?
  • How to use the ST05 SQL trace with multiple application servers?

The test program

First we create a small test program for our performance analysis.

REPORT zperftest.

DATA: zlt_vbak TYPE TABLE OF vbak.
DATA: zls_vbak TYPE vbak.
DATA: zlt_vbap TYPE TABLE OF vbap.
DATA: zls_vbap TYPE vbap.

SELECT * FROM vbak INTO TABLE zlt_vbak UP TO 1000 ROWS.

LOOP AT zlt_vbak INTO zls_vbak.
  SELECT * FROM vbap INTO zls_vbap.
    DO 10 TIMES.
      CALL FUNCTION 'BAPI_MATERIAL_EXISTENCECHECK'
        EXPORTING
          material = zls_vbap-matnr+0(18).
    ENDDO.
  ENDSELECT.
ENDLOOP.

Off course this program is written very badly to be really slow and making performance issues.

ST05 SQL trace

Start the ST05 SQL trace tool with transaction code ST05.

You can activate the trace for all users with the button Activate trace. But this is usually not needed and will only give you a long trace to analyze.

The usual method is to activate the trace with a filter, mostly on user name to trace a specific user action:

If the authorization team already started on ST01 authorization trace, you cannot start the SQL trace. First stop the ST01 trace. 

Now you can start the performance test program in a different session. Just wait until it is finished. It is important the user you are tracing is only doing this action and does not perform any other action, since these other actions are also recorded and will make the analysis harder to read.

When completed go back to the ST05 and click Deactivate trace.

Trace analysis based on duration

Now press the Display trace to see the results. If your trace is large you will get this screen:

This is quite common and click yes. If your result is really too big, change the 5000 on the first screen in to a good maximum, or try to record a smaller time frame.

Result now looks like this after sorting on the column duration:

You can see that the total SQL commands took 48 seconds in total. The longest SQL single command took 78 milliseconds (which is very fast, so long running SQL’s are not the issue in this example).

In your case you might find very large single SQL commands. By selecting the line and pressing the button Display ABAP call location, you can jump to the place in the coding that fired the SQL command.

Summarized trace analysis

Since we have many records and many small ones, we need to use the summary tools. In the trace analysis select menu path Trace and then Structure Identical statements. This will give the following surprisingly short overview:

In the third column you can see that there are 100 identical calls, and also a high number of redundant calls.

If you now click on the second line to the ABAP call position you jump to our badly performing program and see that the majority of the delay is coming from the do 100 times loop. The first line is coming from standard SAP in the BAPI call.

This happens in real live as well that not all calls will point you into the right program. You might have to check multiple lines to find the right program causing the issue.

Multiple application servers

Development systems normally have only 1 application server. Productive servers can have more. If you have to analyze a performance issue directly on production with ST05, you have to be aware that the performance trace is per application server. If needed, you can select in ST05 as specific server, or you can select all. The trace display is still per server.

Relevant OSS notes

Notes to check or to apply:

Analyzing code before upgrade or support package: CDMC toolset

This blog will explain on the use of the CDMC toolset you can run analyzing your custom code, before starting upgrade or support package.

CDMC toolset

Start transaction CNV_CDMC to goto the CDMC overview.

Goto ad hoc analysis:

Start SAP modification run

Wait for run to finish. If done, click the Display Results.

View results:

Setback of the modification overview: also OSS notes are marked as modifications.

Other useful runs: Syntax check and Inactive customer objects.

If you run these checks before an upgrade you can save quite some annoying issues during the upgrade itself.

OSS notes

Relevant OSS notes:

DB01 Oracle Lock monitor

This blog will answer the following questions:

  • How does a deadlock look like in DB01 Oracle lock monitor?
  • How can I solve the issue?

Deadlocks

A database deadlock can occur when 2 or more processes are trying to update each other and are also waiting for each other. This process will lead to infinite waiting.

DB01 Oracle lock monitor

With the use of transaction DB01 you can get overview of Oracle locks. A deadlock is observed when the status is on HOLD and more processes are in status WAIT.

Solving the deadlock can be done by the Oracle DBA on database level.

Background: 745639 – FAQ: Oracle enqueues.

Shared objects memory

ABAP programs (standard SAP and custom) use the shared memory objects technology.

Questions that will be answered in this blog are:

  • How to set the shared objects memory size?
  • How to monitor usage of shared objects memory?

Monitoring shared objects

Shared objects can be monitored with transaction SHMM:

In the start screen you can see the objects now loaded and how much memory they consume. In the start screen you can also delete and invalidate the shared memory objects.

The deletion can lead to short dumps. Only use this in emergency cases and when you are really sure

In the second tab you can see the total memory overview:

Setting shared memory objects memory size

In RZ11 with system parameter abap/shared_objects_size_MB you can set the shared object size in MB. A restart of the system is required to activate any change.

Older documentation says 500 or 1000 MB is sufficient. In newer systems a value of 3000 to 5000 in not uncommon.

Useful OSS notes

Note on memory consumption: 1322182 – Memory consumption of ABAP Shared Objects.

Dump with shortage of shared objects memory: 972757 – Occurence of the SYSTEM_NO_SHM_MEMORY runtime error.

Guided answer note: 2474021 – [Best Practice] How to solve SYSTEM_NO_SHM_MEMORY runtime error – Guided Answer

Licenses for SAP solution manager

SAP solution manager licenses have been renewed last few years by SAP.

Questions that will be answered in this blog are:

  • Do I need a user license for solution manager users?
  • If I run solution manager on HANA, do I need to pay HANA database licenses?
  • How can I get Focused Build and Focused Insights?
  • What about Focused Run licenses?

User licenses for SAP solution manager

Since 1.1.2018 the requirement of having named users was dropped by SAP.

HANA database licenses

If you want to run HANA database below SAP solution manager as database, you need to procure the infrastructure. The HANA database rights are included in SAP solution manager. This is the only exception SAP has. For all other use case you need to pay for HANA as database as well.

Using SAP solution manager for non-SAP components

You can use SAP solution manager to manage non-SAP components as well. Especially the ITSM service desk component can be used for this. When you use this function for non-SAP components, you will need SAP enterprise support rights for SAP solution manager in stead of the SAP standard support.

Focused Insights and Focused Build

SAP offers Focused Insights and Focused Build as extra options on top of SAP solution manager. Both are installed as add-on. Focused Insights brings extra dashboard building capabilities. With Focused Build you can get an extra grip on your solution build process.

As of 01.01.2020 both solutions are part of standard maintenance contract. See also OSS note 2361567 – ST-OST Usage Rights and Support.

If you want to try out these solutions, you can use the available free SAP demo system. Read more about this in the following blog.

SAP Focused run now also covers the functionality of Focused Insights, but in a far superior and more performing way. Read more in this blog.

Focused Run

Focused Run is separate solution with separate license to optimize the running of large SAP landscapes. Focused run does NOT run on SAP solution manager. It runs on a separate environment and only runs on SAP HANA. You cannot combine a Focused Run and SAP solution manager on one single installation. More information on Focused Run can be found on the SAP site. And on the specialized SAP Focused Run Guru site.

For licenses of Focused Run, read this dedicated blog.

Despite the fact that Focused Run is a paid solution, it offers by far the most sophisticated and added value product.

More background information

More information can be found on the SAP solution manager usage rights website.


Transaction SPOOL

Transaction SPOOL can be used as a central starting place for all printing and spool related settings, tools, error analysis.

Simply start transaction SPOOL:

Now switch from Standard Mode to Expert Mode to enable all tool.

Double clicking on the line will start the tool. On the right hand side are the transaction codes and the OSS note numbers for specific additional explanation.

Background OSS note: 2359477 – Transaction SPOOL.

Bug fix note: 2763159 – Transaction SPOOL: Short dump for missing authorization.

SAP support backbone update

The SAP support backbone update is live per 1.1.2020. Blocking started as of 8.1.2020. If you did not prepare your systems for it, you might loose support functions.

Per 31.07.2020 the sending of EWA’s via RFC towards SAP will no longer work. See OSS note 2923799 – Final Shutdown of RFC Connections From Customer Systems to SAP. At the same date OSS notes downloads via RFC will be fully blocked. Also the RTCCTOOL will stop to work (see oss note 2934203 – ST-A/PI 01T* SP01 – 01U SP00: SAP backbone connectivity for RTCCTOOL on basis 700-731 after RFC shutdown).

You can get or will already get messages like:

SAP note 2847665 – OSS RFC Connection fails will refer you to the SAP Backbone connection update site.

Also on the main SAP support site there is this warning message:

Which refers to first-aid kit OSS note: 2874259 – First Aid Kit for Problems Related to SAP’s Support Backbone Switch-Over Starting on 8 January 2020 .

Questions that will be answered in this blog are:

  • Where can I find more background information on the SAP support backbone update?
  • Why can I find first aid support?
  • Do I need to upgrade SAP solution manager?
  • How to switch to digitally signed OSS notes?
  • Do I need to change my OSS RFC’s?
  • What else do I need to do?
  • How to check the correct setup in the SAP EWA report?
  • Where can I find a checklist to see if I am completely done?

Background information on SAP support backbone update

The landing page for SAP support backbone update can be found by following this link.

The webinar recording explaining all the highlights can be found by following this link.

The official OSS note is 2737826 – SAP Support Backbone Update / upcoming changes in SAP Service and Support Backbone interfaces (latest) in January 2020.

2 important OSS notes for quick start of actions:

And the new first aid kit OSS note:

2874259 – First Aid Kit for Problems Related to SAP’s Support Backbone Switch-Over Starting on 8 January 2020

Quick overview of all your systems in SAP service marketplace

SAP now provides the overview of your systems which are not ok in a special online overview. Follow this link. Your result can look like this:

What will change per 1.1.2020?

Basically the connection from SAP solution manager and the on premise SAP systems connection to the SAP backbone will change. This will impact many areas like OSS notes, EWA’s, landscape planning etc.

What do you need to do if you don’t want to loose any functionality?

Solution manager

If you don’t want to loose any functionality in SAP solution manager you will need to upgrade to Solution manager 7.2 to support package 7 or 8. If you are on 8 you have to do less manual work than on 7. On solution manager support packs 5 and 6 some functions will work, but with manual work and limitations. On solution manager 7.1 and solution manager 7.2 up to support pack 3, the connection to SAP support backbone will be lost on 1.1.2020. You can already upgrade to SP8 now and prepare solution manager.

For the automatic configuration of the connectivity follow the instructions in OSS note 2738426 – Automated Configuration of new Support Backbone Communication.

OSS notes

For OSS notes there are 2 changes: the RFC to SAP and digitally signed OSS notes.

For the RFC connection read and follow the instructions from OSS note 2740667 – RFC connection SAPOSS to SAP Service & Support backbone will change (latest) in January 2020.

OSS notes via SNOTE must be switched to digitally signed OSS notes. How to do this: see blog.

Next to this, you will need to change the OSS note RFC destination. The generic user will no longer work. You will need to change it to named technical user, or change to the connection from RFC to https connectivity.

If you setup digitally signed OSS notes there is an option for fallback to insecure.

Attention: this fallback will no longer work after 1.1.2020.

ANST

ANST is a great function to help you find OSS notes relevant for your issue. For more explanation on ANST look at this blog. The ANST reaches out to the SAP support backbone to check for recent notes. To keep the function working you need to setup a new webservice in SOAMANAGER (if the SOAP runtime is not active follow instructions in this blog). To setup the specific webservice follow the instructions in oss note 2730525 – Consuming the Note Search Webservice. Then apply OSS note 2732094 – ANST- Implementing SOAP Based ANST Note Search and 2818143 – SEARCH_NOTES- Implementing SOAP Based Note Search.

While switching to new SAP support backbone you might get a connection error. Follow the instructions from OSS note 2781045 – ANST / ST22 note search “Connection cannot be established” to solve it.

Other calls

See OSS note 2722027 – Certain OSS RFC APIs calls replaced with corresponding web service calls.

Online checklists

SAP has now published online checklists, based on your solution manager version. You can find the checklists on this link.

Support backbone configuration check in EWA report

If you install ST-A/PI 01T sp02 or higher in your system (see OSS note 2827332 – Service Data not Complete due to ST-A/PI not Up-to-date), the EWA report of that system will give information about the correct connection to SAP support backbone and correct use of technical user for the communication.

Example:

In the process OSS note 2802999 - SDCCN activation fails without errors or red icons in Migrate tab might need to be applied as well to solve an SDCCN error.

All background information can be found in OSS note 2823658 – EWA Checks for SAP Backbone Connectivity.

SDCCN error notes

SAP is having some issues with the SDCCN coding for the backbone connectivity. If you experience issues there, check out the following OSS notes:

Exit mobile version