The SAP coverage analyze can be used in testing custom code to make sure all testing covers all code and all branches.
The coverage analyzer has quite an in-depth analysis capability that is meant for non-productive systems. Don’t run it on productive systems.
Starting the coverage analyzer
On your test system start transaction SCOV and go to the on/off section in the Administration branch:
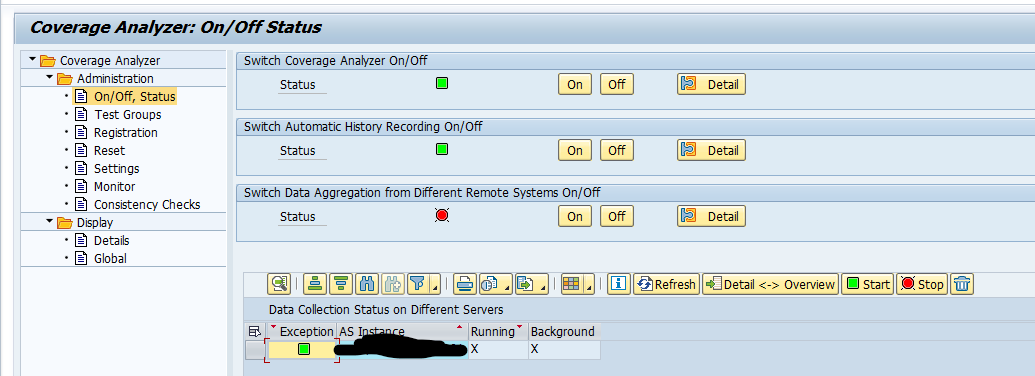
When switched on it will take at least 1 hour before the first results are visible.
Analyzing the results
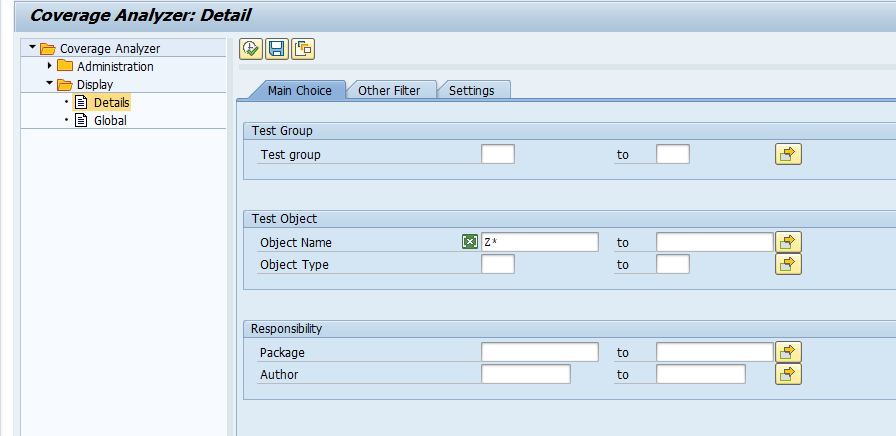
During the testing you can view the test coverage results in the Display/Details section. Select there the Z* for all the custom code (you might need to increase the Maximum Number of Objects in the Settings tab):
Wait for the result list and sort by Coverage:
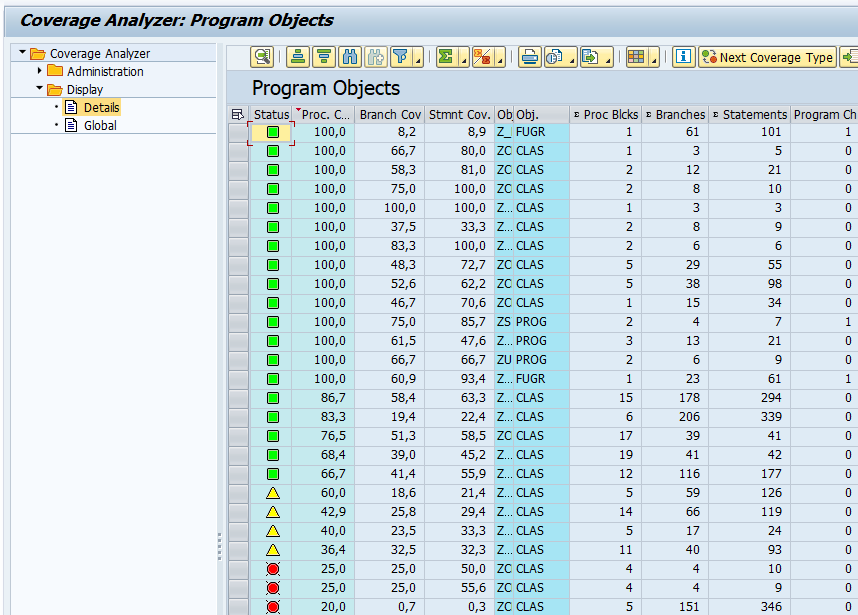
Double clicking on one of the lines gives the coverage per program:
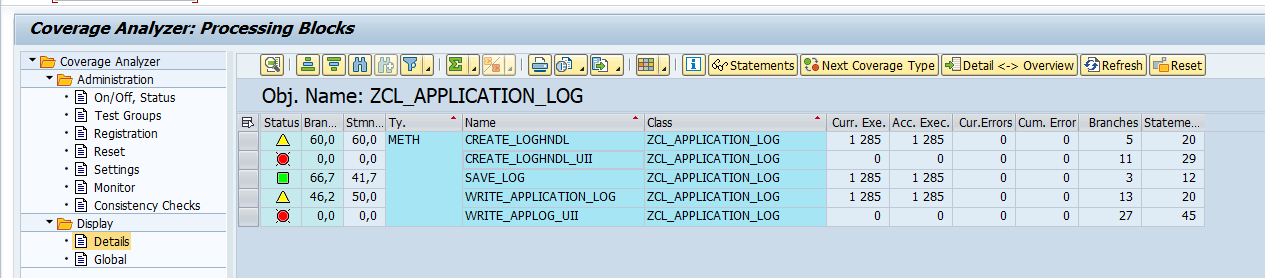
If you select any line you jump to the code lines:
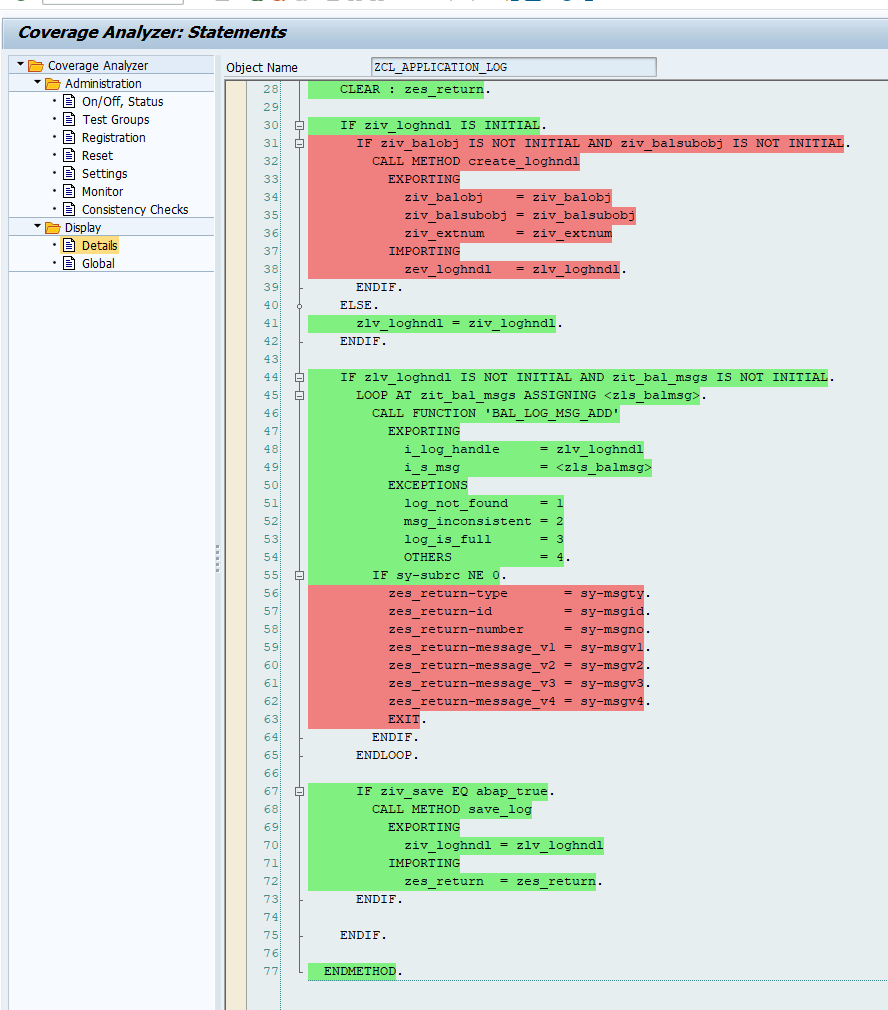
In this case (yellow one), you can see that the normal flow is done, but the exceptions are not reached yet. If the exceptions are important for your business scenario, you know you have to create and fire a test case. Once done, the coverage should increase.
Overall view
In the overall view you can see trend analysis over time:
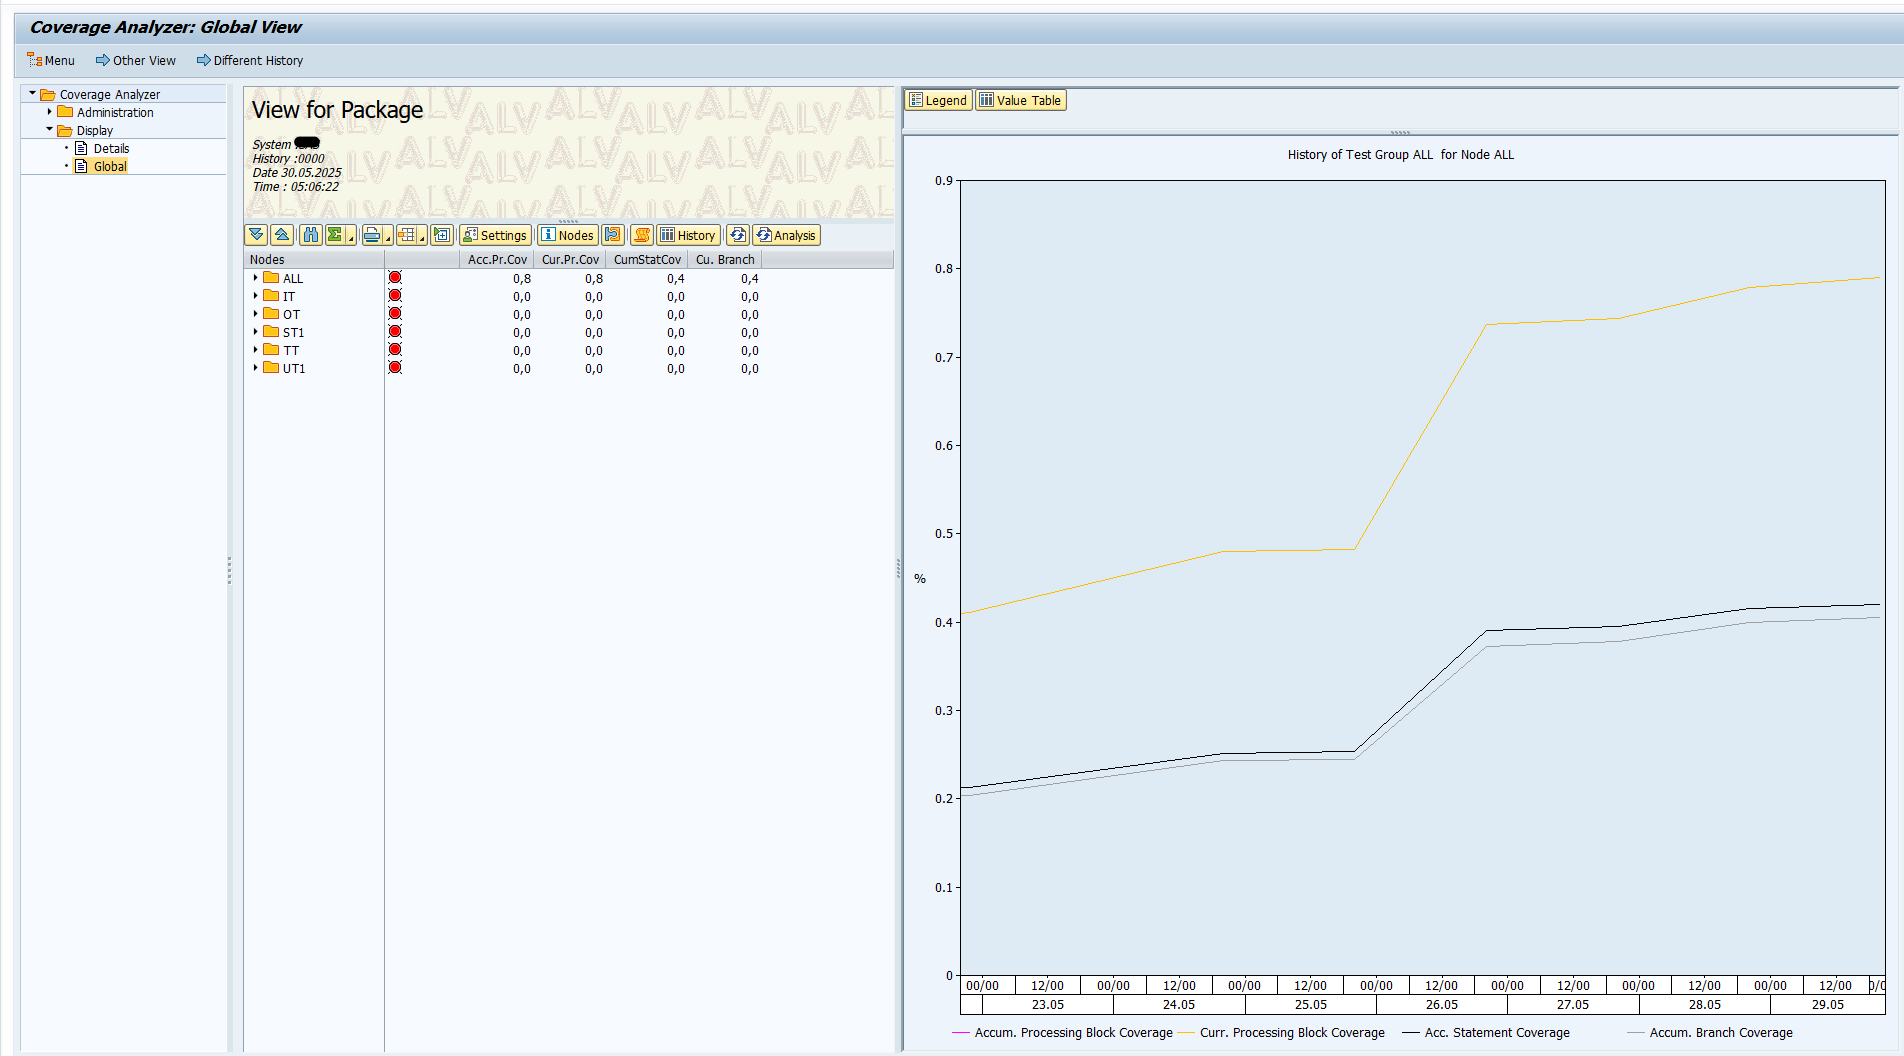
To refresh the analysis or to set up first time push the Update Analysis button in the middle section (it is a bit hidden).
References
Standard SAP reference for Coverage analyzer: link.
OSS notes: