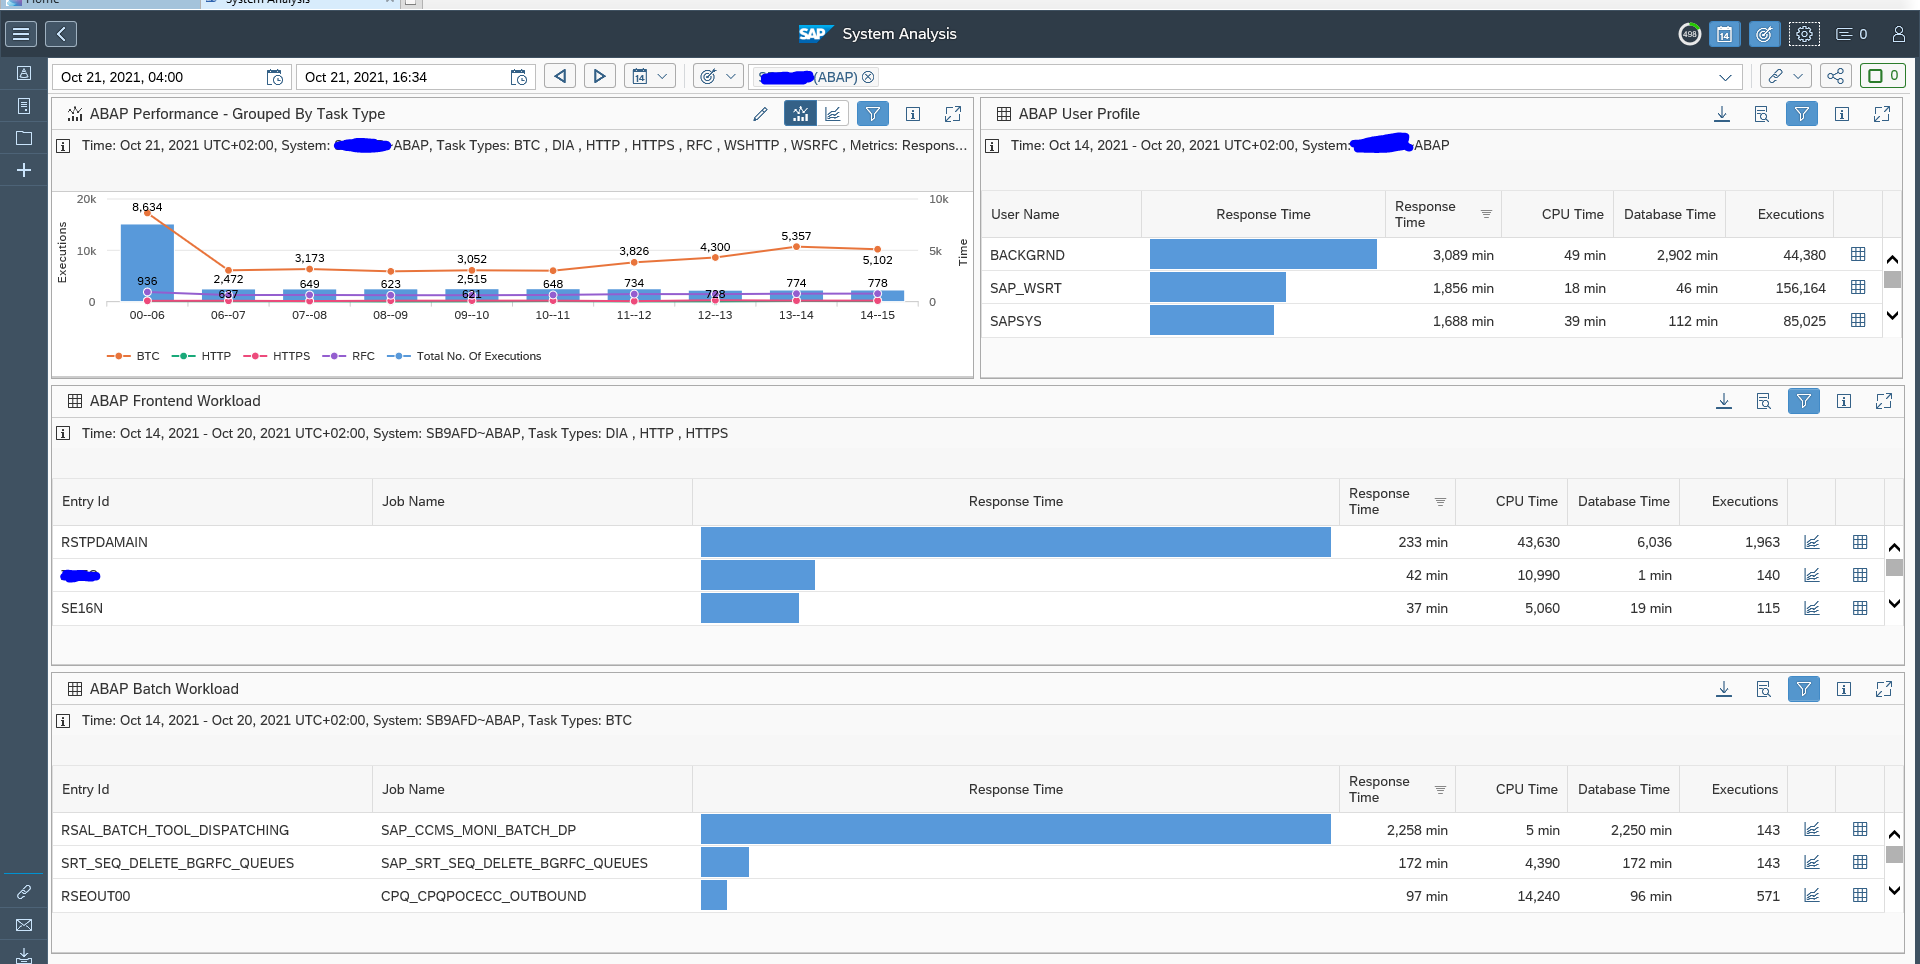
SAP netweaver gateway is used to host FIORI apps. Attention must be paid to the generic system performance of the system to avoid FIORI users to complain about performance.
Regular clean up jobs
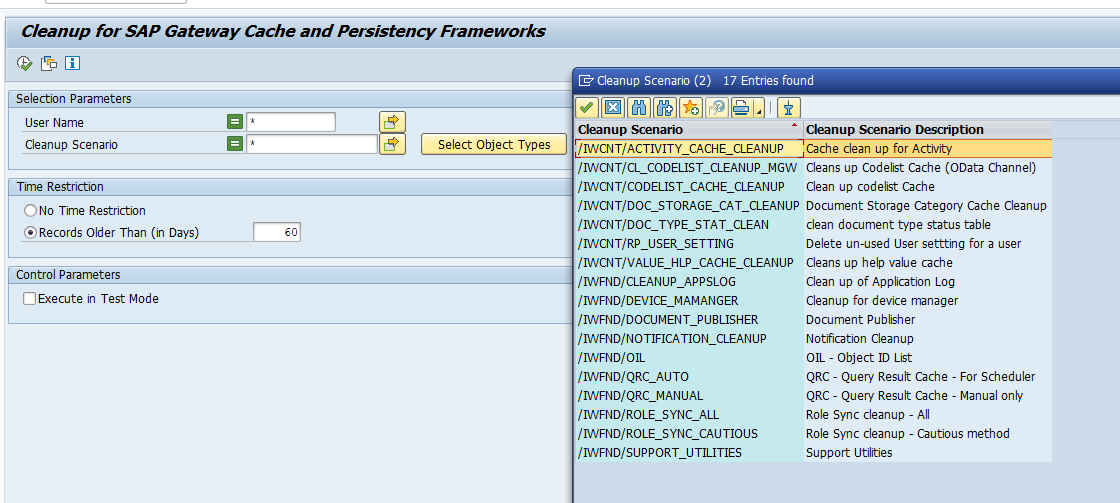
Run program /IWFND/R_SM_CLEANUP in batch to clean up the application log. See notes 2499354 – Report /IWFND/R_SM_CLEANUP and 3278472 – What is the job /IWFND/APPL_LOG_CLEANUP ?. You can run with clean up scenario * for all, or select a specific scenario:
/IWFND/CLEANUP_APPSLOG will clean up the application log.
/IWFND/SUPPORT_UTILITIES will clean up support utilities.
See more on periodic tasks on help.sap.com.
See OSS note 2620821 – Periodical jobs and corresponding reports to also run programs /IWBEP/SUTIL_CLEANUP and /IWBEP/R_CLEAN_UP_QRL regularly (daily).
Run report /UI2/PERS_EXPIRED_DELETE weekly to clean up old personalization data (see note 2031444 – Cleanup of expired Fiori personalization data on the frontend server).
After system copy the clean up jobs might be gone. Check OSS note 3453368 – SAP_IWFND_* cleanup jobs missing after client/system copy.
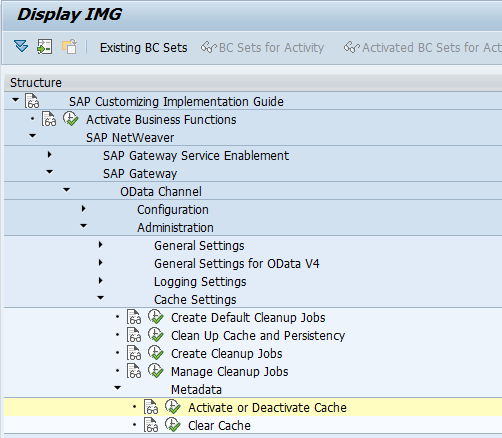
Cache settings
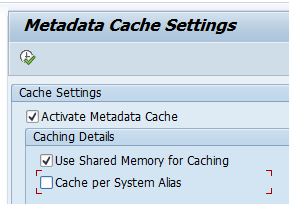
Metadata cache settings
In customizing go to this path:
Setting should look like following in a productive system:
In a development system you should de-activate this cache.
HTTP/2 usage
Check if you have enabled HTTP/2 already. If not, activate it. See this blog.
Log level settings
In a productive system you can reduce data footprint and improve performance by reducing the log level settings. Only in case of issues, you can increase the log levels again.
To avoid excessive SLG1 logging of type “MESSAGE_TEXT”, make sure to apply solution from OSS note 3247600 – Fiori: /IWFND/MED170 – No service found for namespace ‘/IWBEP/’, name ‘MESSAGE_TEXT’, version ‘0001’.
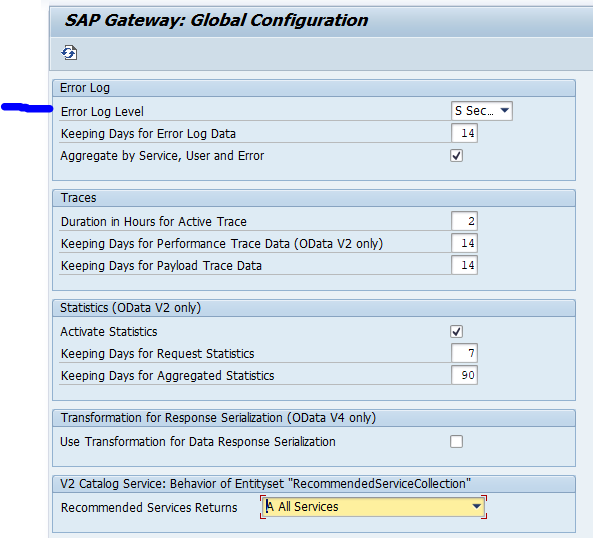
Gateway error log
Go to transaction /n/IWFND/ERROR_LOG. Now select menu Error Log/Global Configuration. Now the configuration opens:
Set the Error log level in production to Secure. And check the days to realistic dates (settings above in the screen shot are per SAP advice).
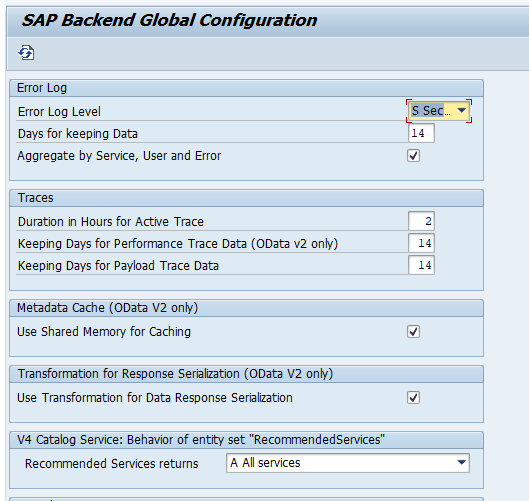
Backend error log
Go to transaction /n/IWBEP/ERROR_LOG. Now select menu Error Log/Global Configuration. Now the configuration opens:
Set the Error log level in production to Secure. And check the days to realistic dates (settings above in the screen shot are per SAP advice).
Metering
Make sure you don’t keep all metering data too long. You can aggregate and delete it. See this blog.
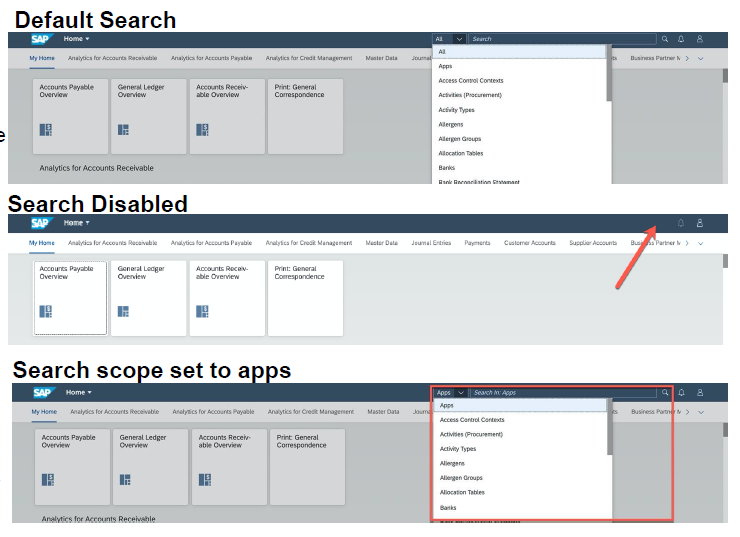
Check search settings
Check your FIORI search settings. The setup of search is described in this blog and is very powerful. But search might not be needed at all, or most users want only to search for apps:
See note 2871580 – SAP Fiori Launchpad Settings: new Parameters for Enterprise Search for the settings to optimize, and SAP blog on explanation of the settings.
See note 2885249 – How to disable Enterprise Search in Fiori Launchpad to disable the enterprise search part.
See note 2051156 – Deactivation of search in SAP Fiori launchpad for deactivation.
Amount of tiles assigned to the user
The amount of tiles assigned to a user has a big impact on performance. Try to reduce the amount of tiles assigned to the user as minimal as possible.
See OSS notes 2829773 – Fiori Launchpad performance with a large volume of Tiles and 2421371 – Understanding Launchpad performance Issues.
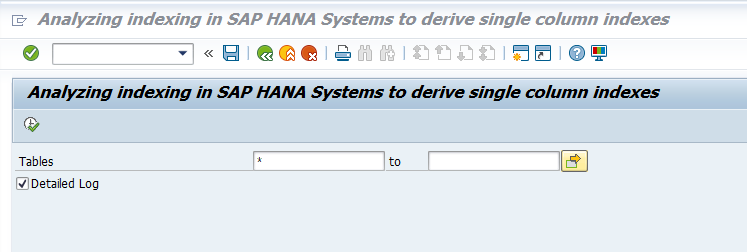
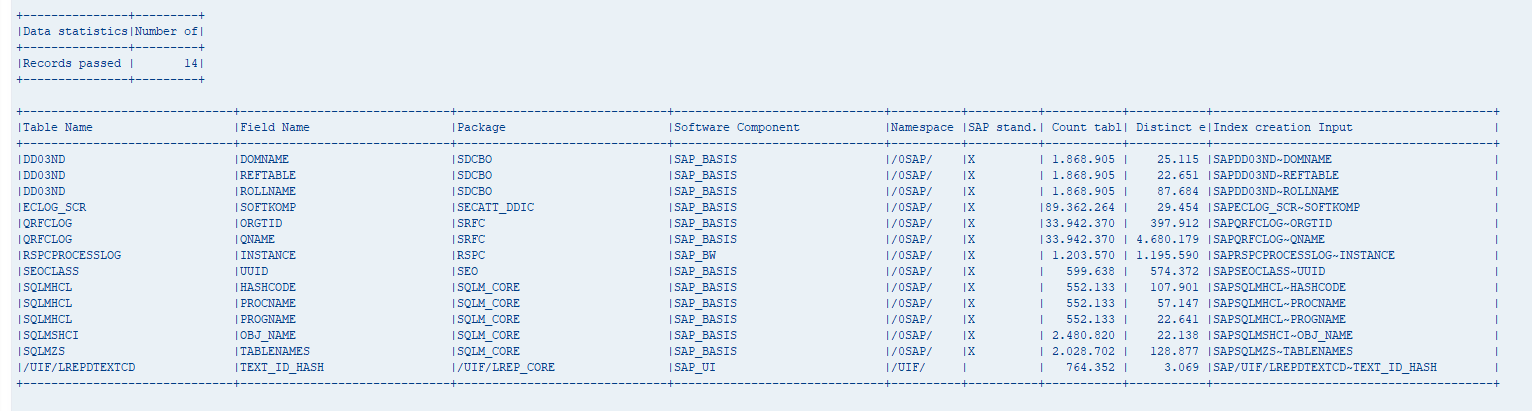
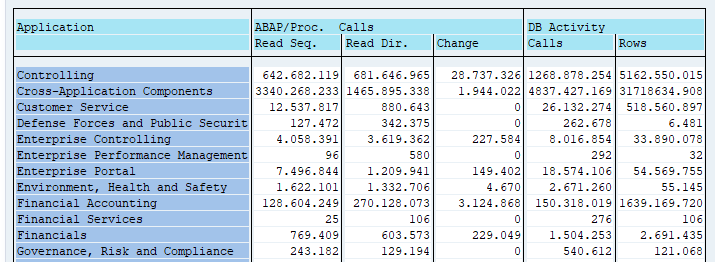
Tables that are growing
Specific notes and solutions for tables that are growing fast in a netweaver gateway system:
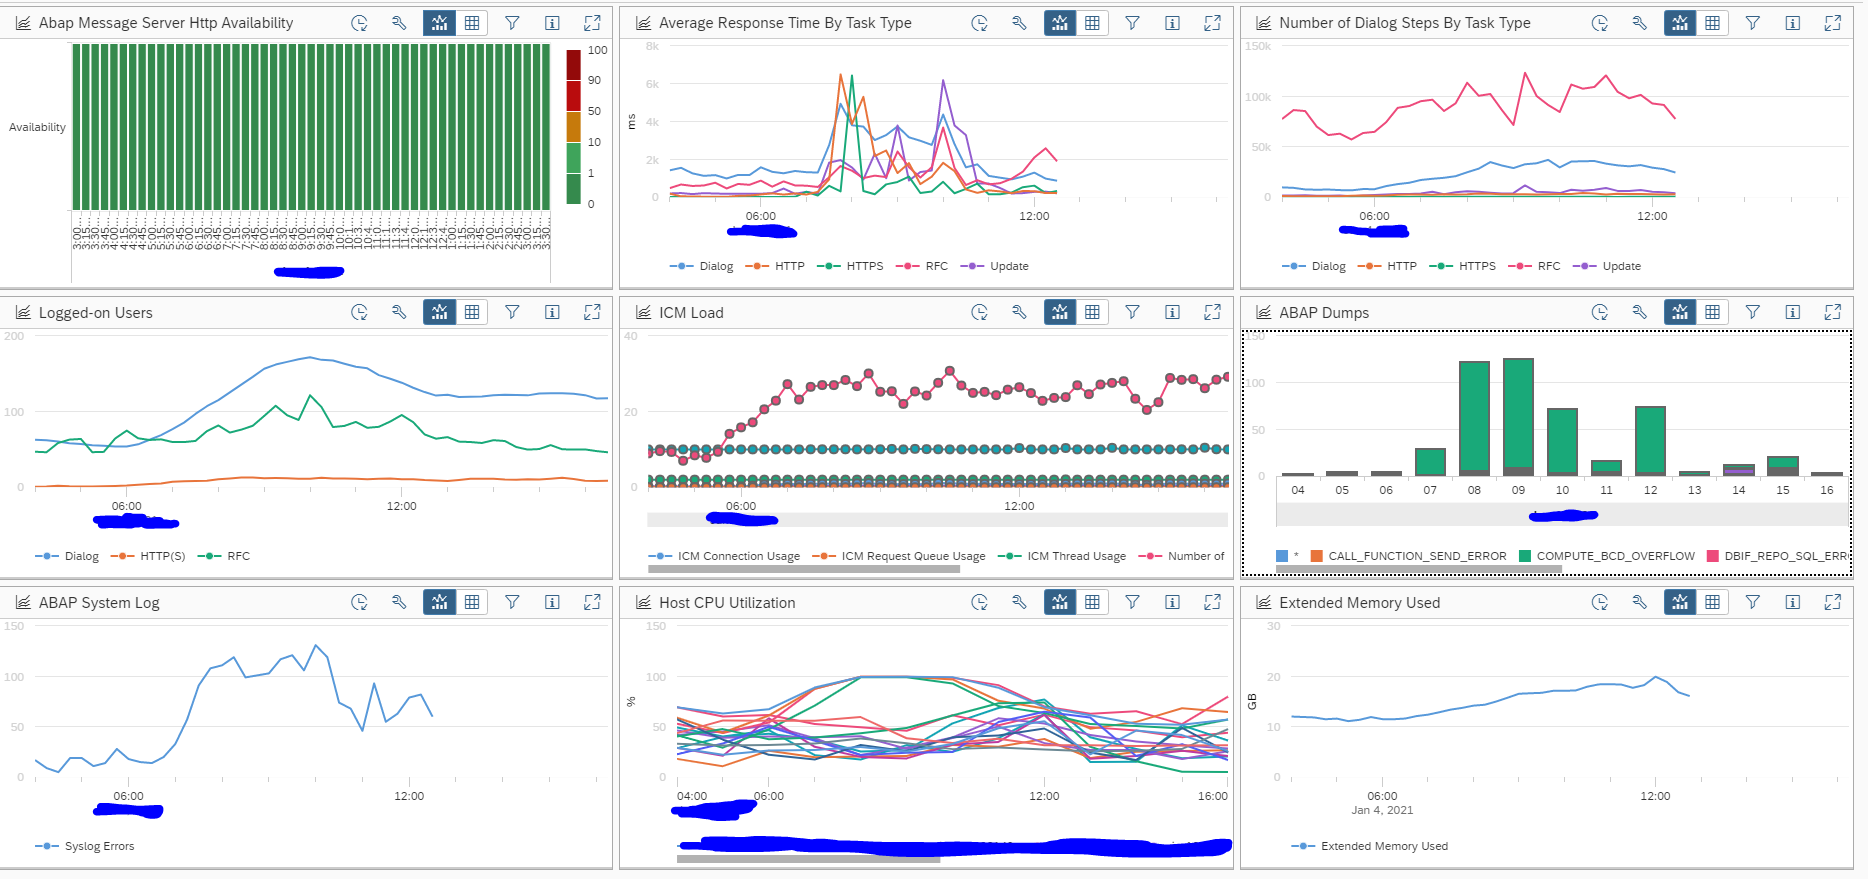
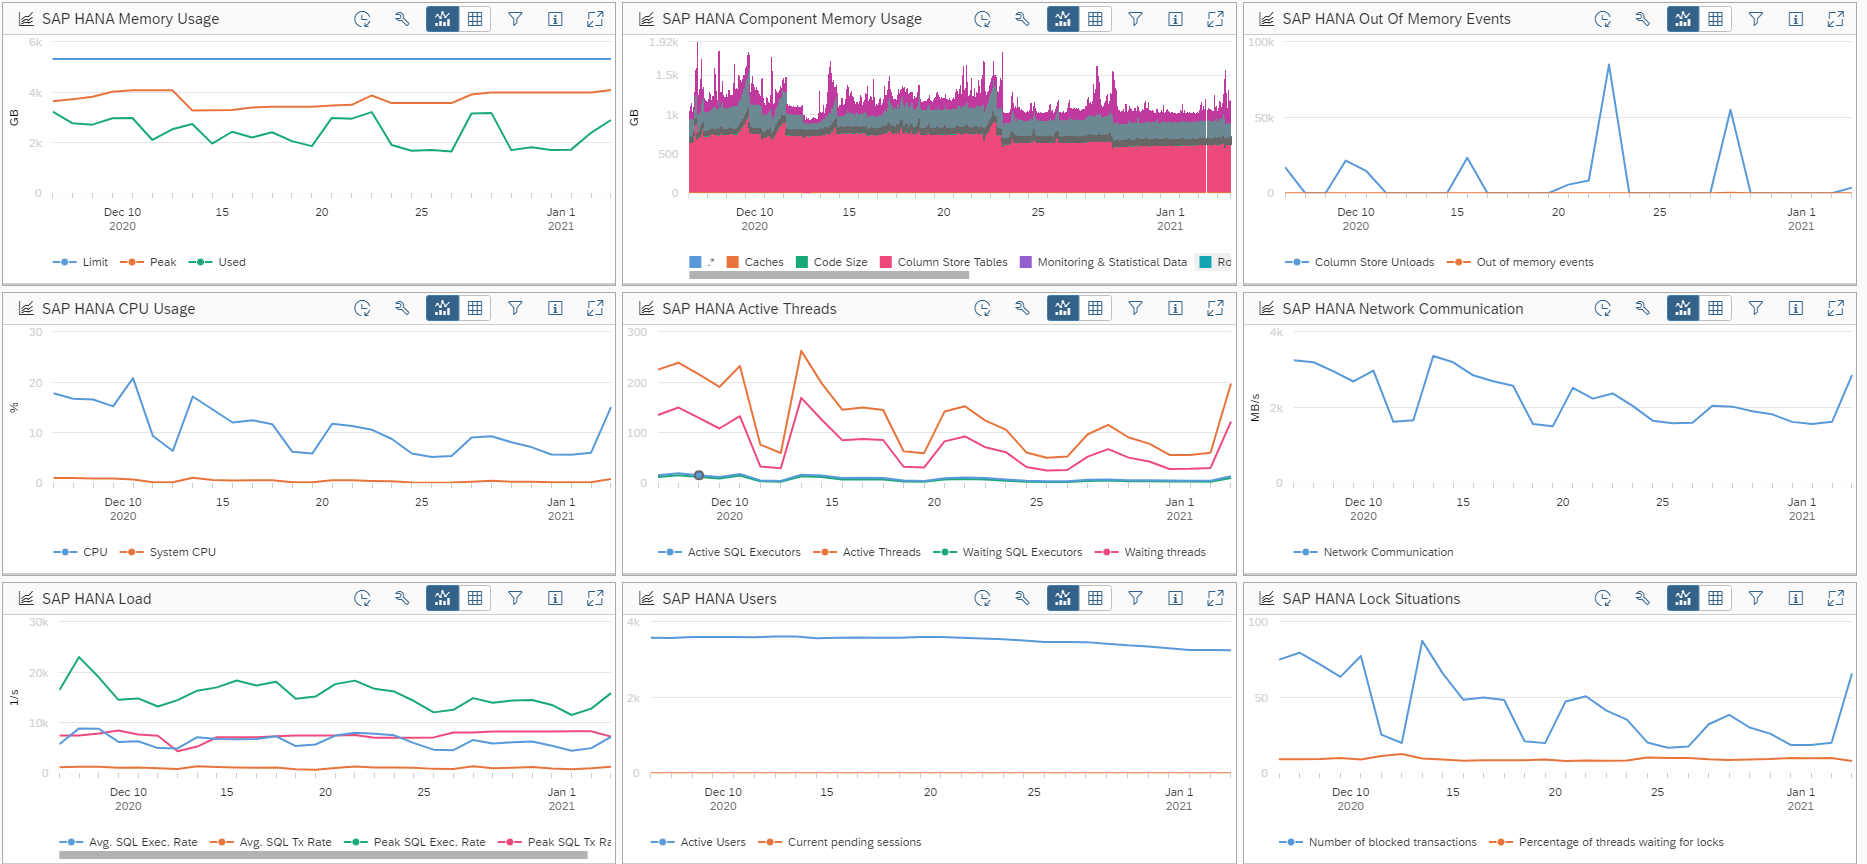
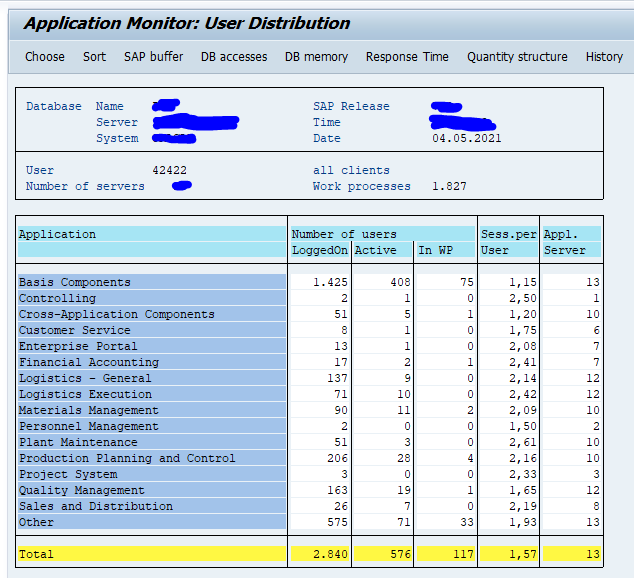
Sizing
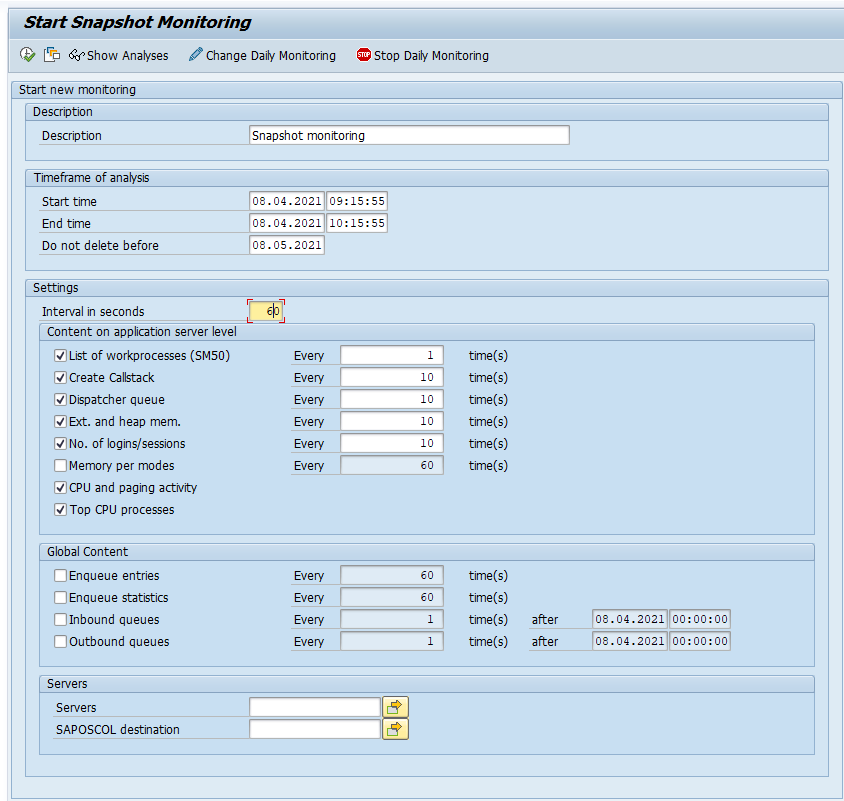
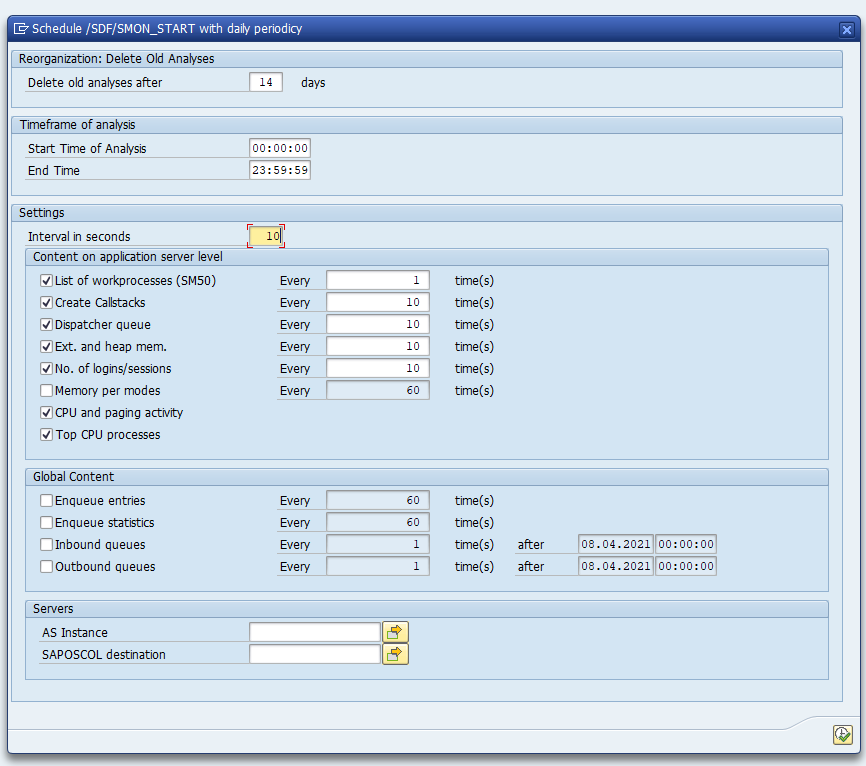
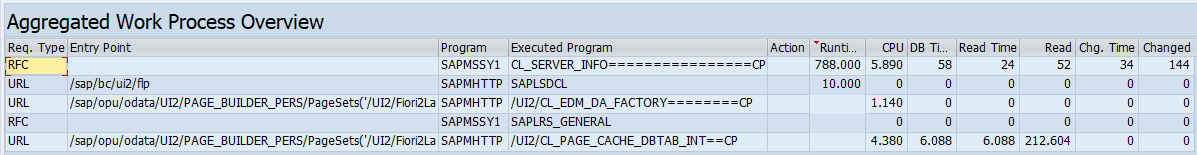
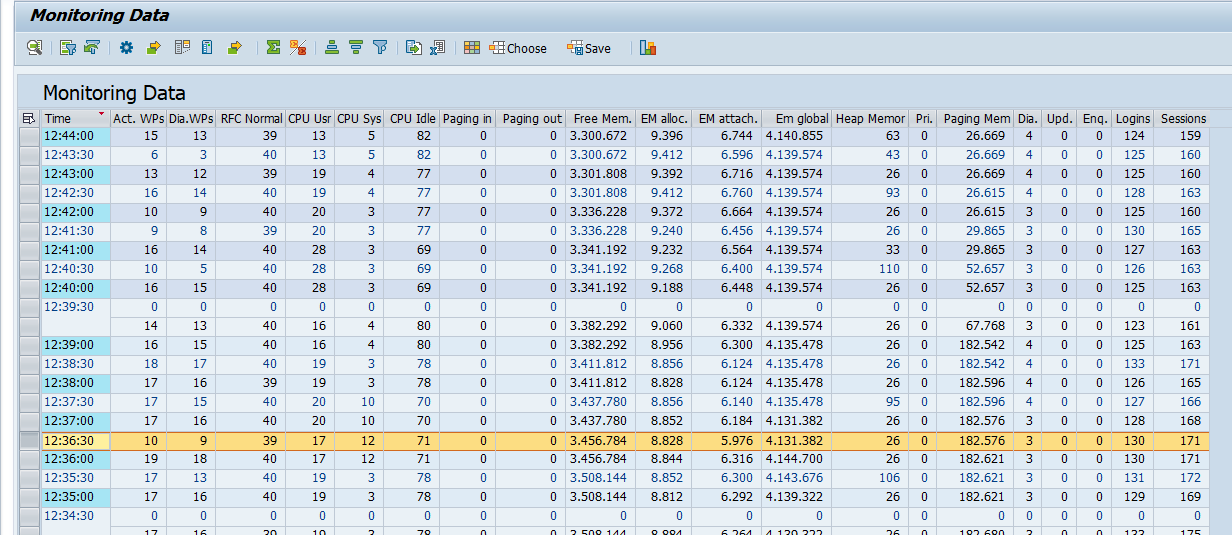
This should be simple one, but it isn’t. Sizing of Netweaver Gateway should not be done based on day or week average. Determine your peak times. And at those peak times check the CPU and memory load. If you take averages that include weekend and night, then system sizing might be totally fine. But to avoid complaints, you must be able to handle the peak load.
Overload
When system is really overloaded dumps with GW_TABLE_OVERFLOW: “Active connection table is full” (thRc=249) might happen. See OSS note 2545122 – CALL_FUNCTION_OPEN_ERROR dump on ST22: Resources exhausted. Solution: increase rdisp/max_comm_entries parameter.
Full checklist
SAP has a checklist called “SAP Fiori launchpad best practice verification checklist”. Follow this link for the document.
Good other blog with checklist: follow this link.