The me.sap.com data volume management function was terminated. This blog will explain how you can use SAP Focused Run to get an overview of the top 20 tables on HANA based system. There data volume really matters for both cost of the infrastructure and HANA database license costs.
Set up
The setup is part of SAP Focused Run System Analysis. Select the System Analysis tile:
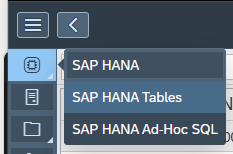
Then select the HANA system for which you want to perform the analysis. Select the tool HANA Tables:
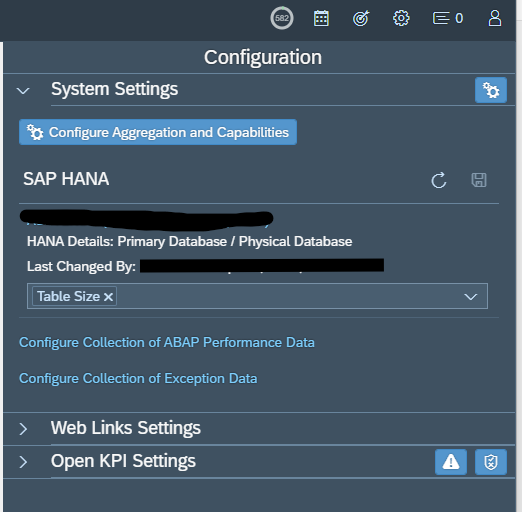
Depending on your SSI settings data might be shown already. If not, select the configuration item to open the configuration screen:
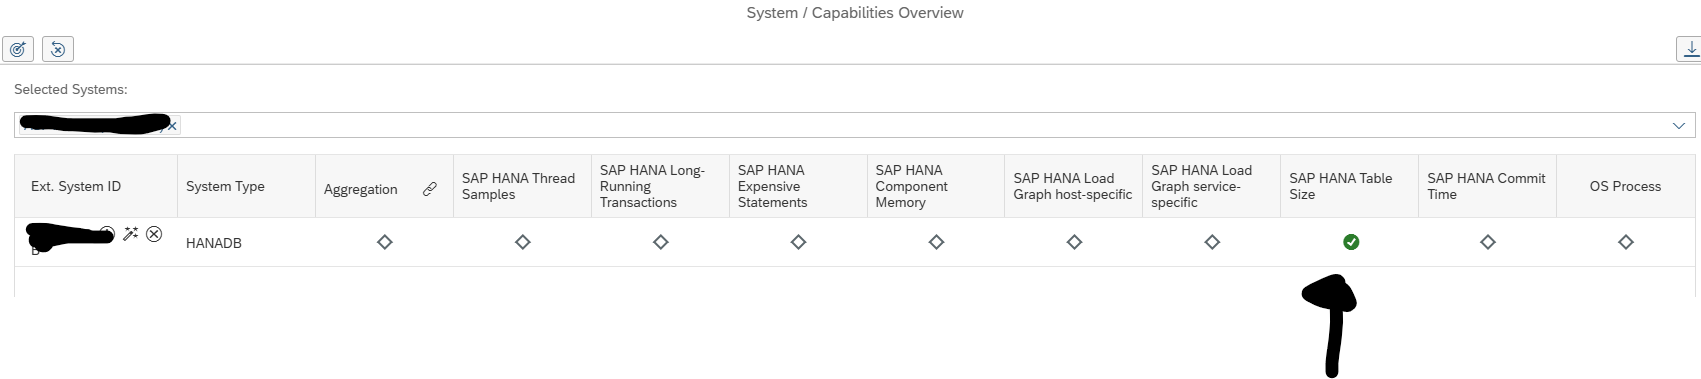
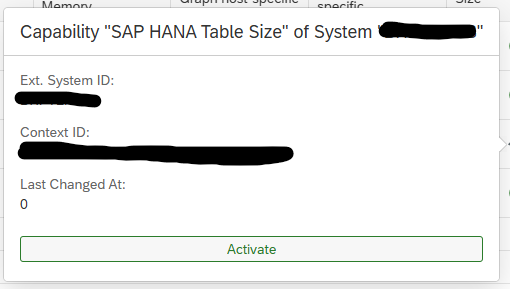
Click the Configure Aggregation and Capabilities button. In the next screen make sure the switch for SAP HANA Table Size is green:
If it is not green yet, click on the grey diamond to activate it:
Hit the Activate button to confirm activation.
After activation wait 1 day for data collection.
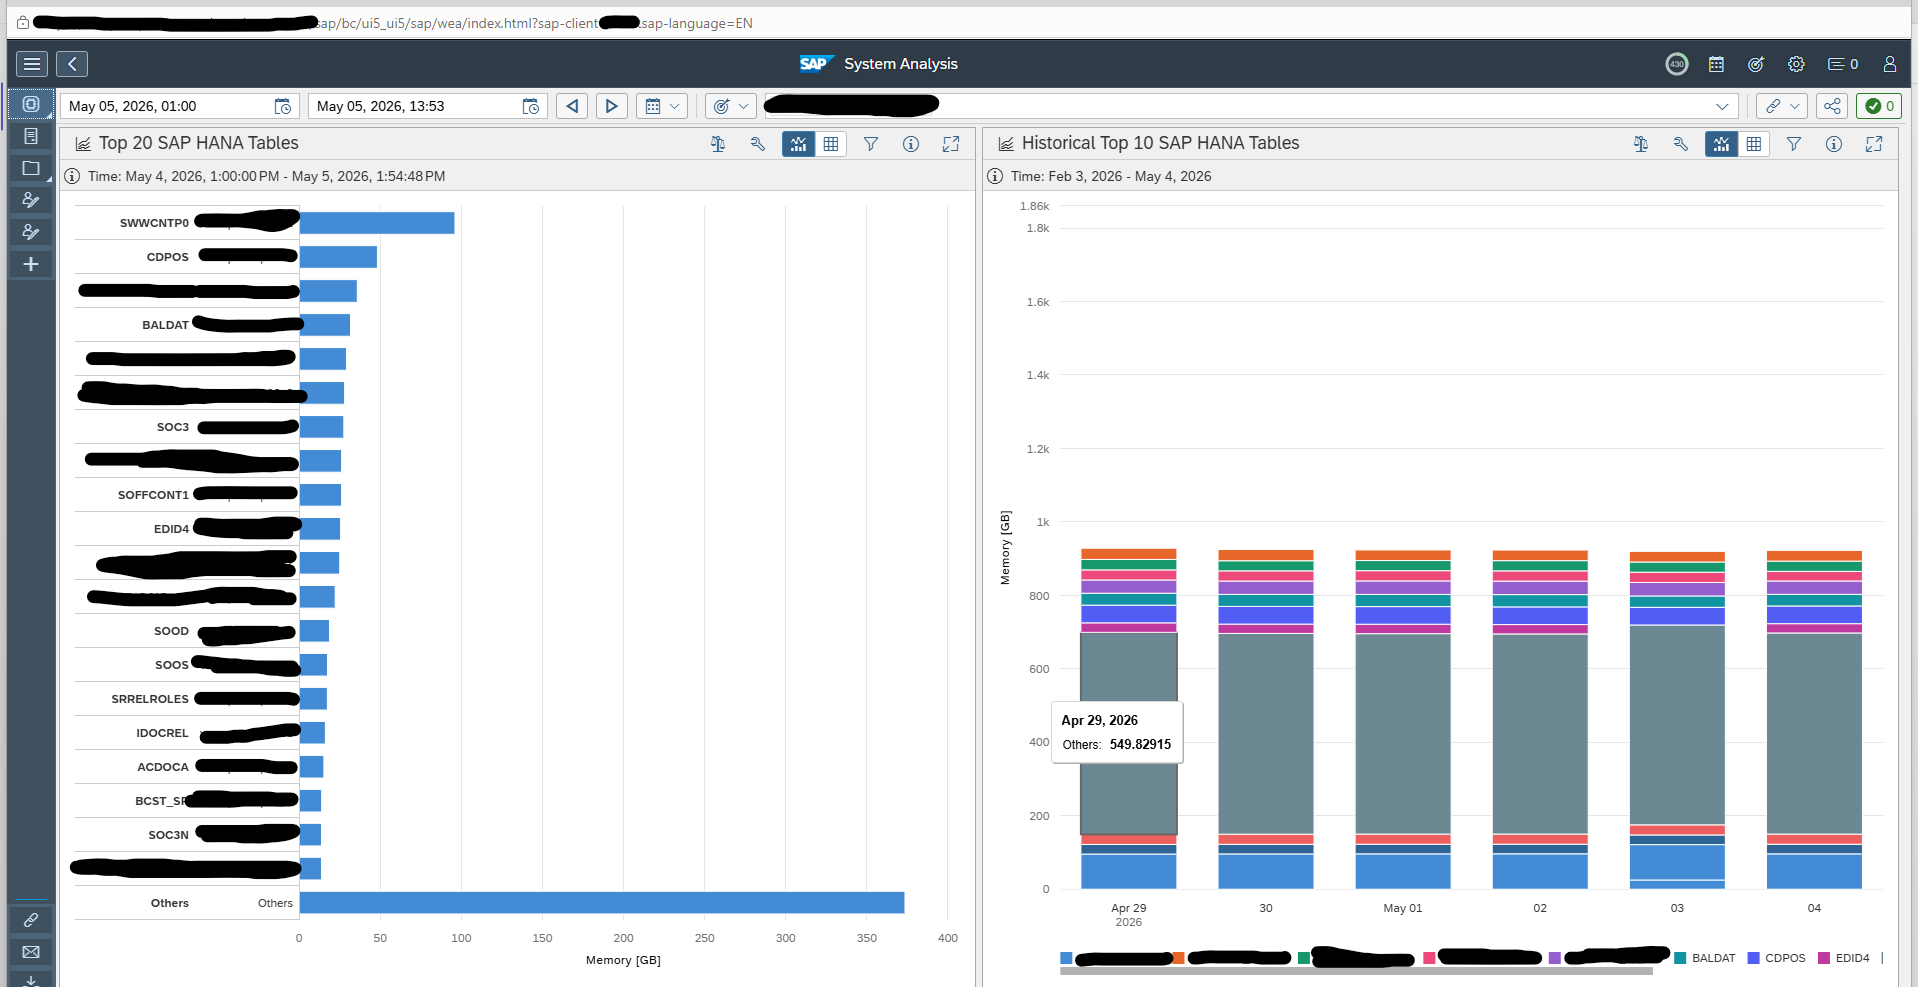
Top 20 results
Now you can see the results. On the left hand side the current top 20 tables, and on the right hand side the growth:
Optionally you can set the function default as active in the SSI by going to table RCA_SSI_CONF with SM30 and add the entry HANA_TABLE_SIZE with activation X.
SAP Focused Run offers some nice API’s that you can use and re-use.
API’s available:
LMDB API
Work mode management API
Guided procedure API
Advanced analytics API
SSI API
LMDB API
The LMDB now has a REST API available to read data in structured way. You can search for hosts, technical systems, software components, installed product versions and instances.
The full specification for this API can be found on this link.
Via function module FM_START_ADHOC_WORKMODE you can create an ad-hoc work mode to stop monitoring for a system. You can start monitoring again by stopping the work mode by calling function module FM_STOP_ADHOC_WORKMODE.
Function module FM_EXTRN_GP_EXEC can be used to call a guided procedure. Unfortunately, you need to pass the GUID of the guided procedure to the function module.
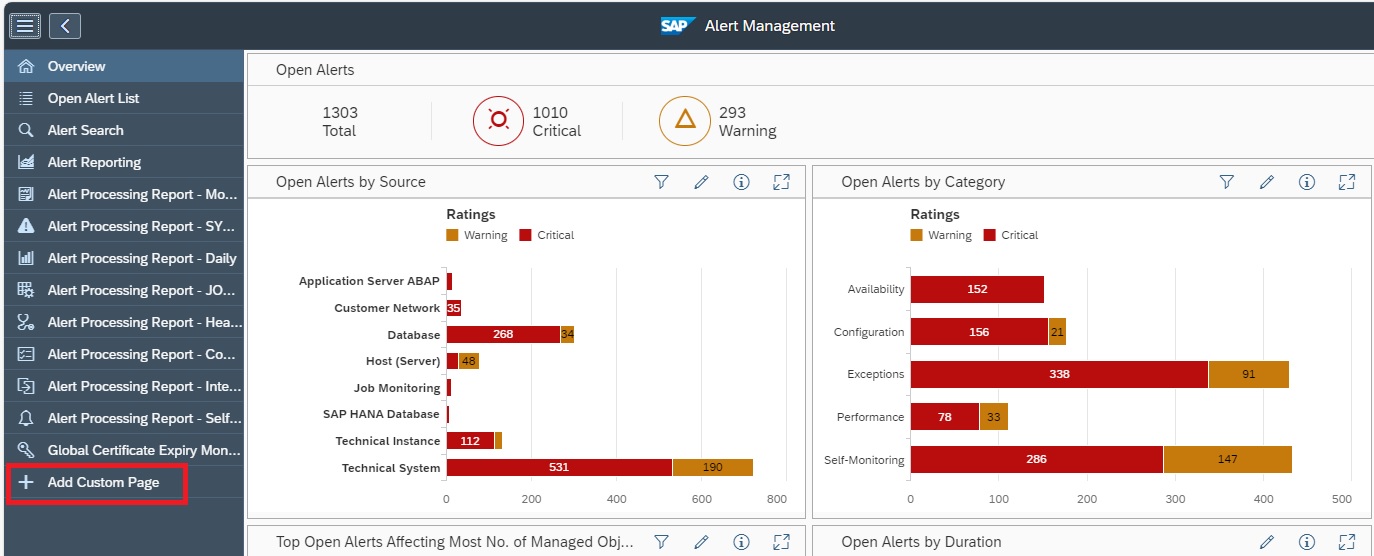
The SAP Focused Run Alert Management application allows us to create a custom dashboard that can help us to report on alerts as per our custom alert reporting needs.
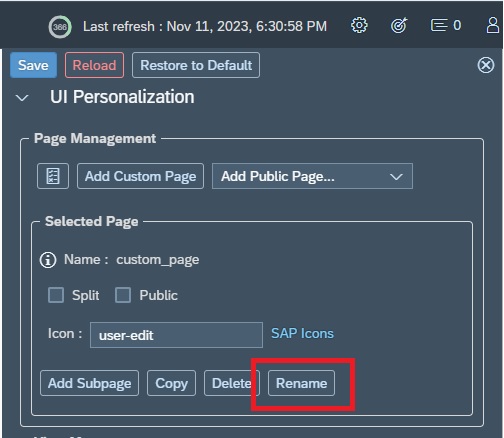
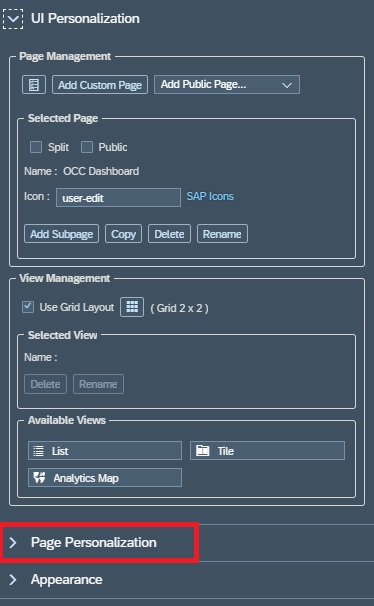
To create a custom dashboard, in the Alert Management App, click on the +sign (Add Custom Page) on the navigation panel.
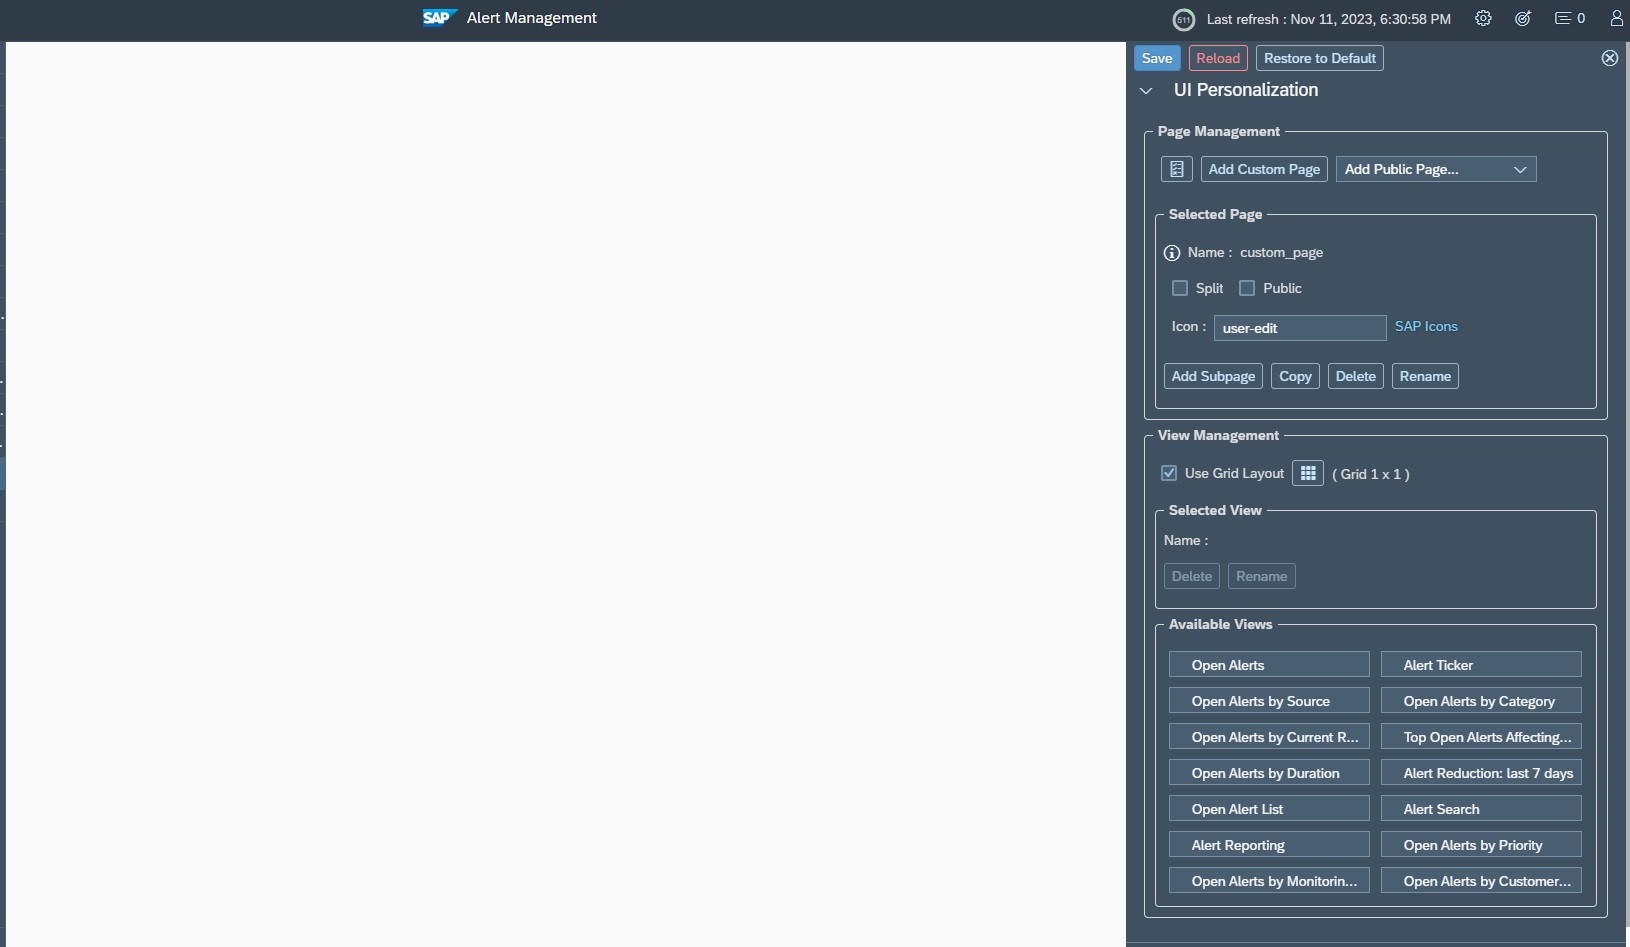
Upon clicking on Add Custom Page , a blank pane is displayed along with the setup panel to its right.
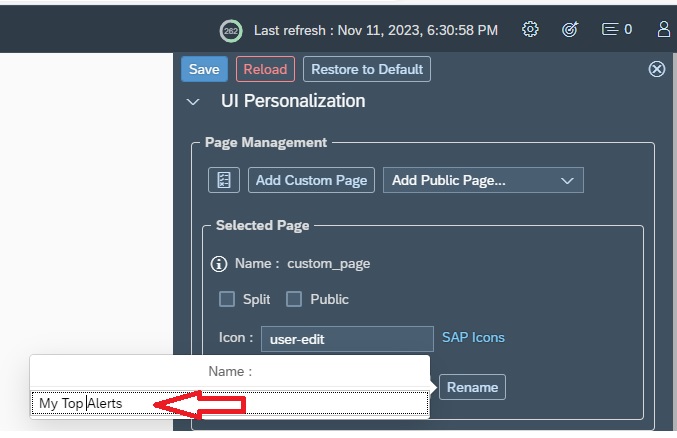
The first step in setup is to give a name to your dashboard. For this click on Rename button in the setup area Page Management.
In the pop-up provide the name for your dashboard.
You can also give a meaningful Icon to your dashboard that will be displayed in the navigation panel. For this provide the sap icon name in the Icon field. To get a list of available icons you can also look in the SAP Icons link which takes you to the Icon explorer.
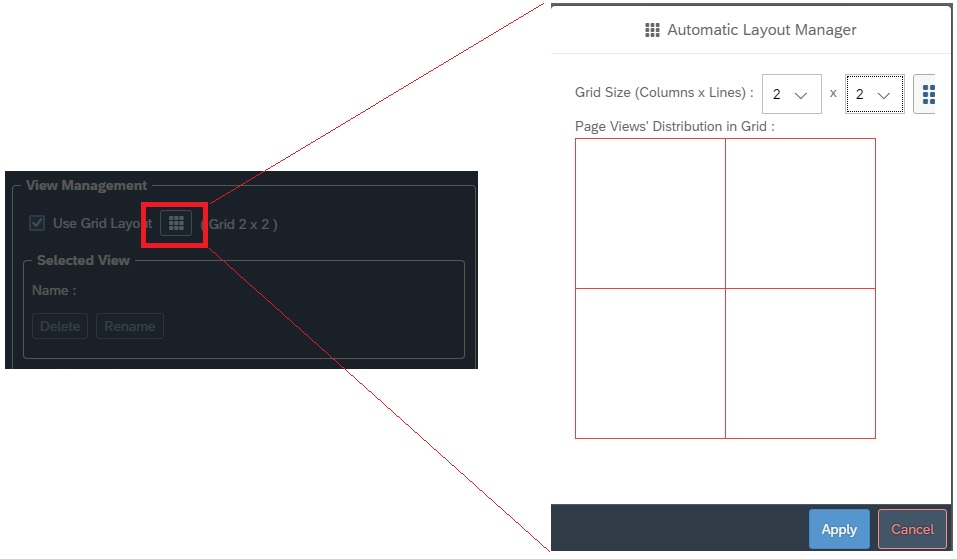
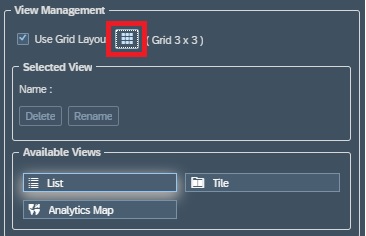
The next is to specify the grid layout (Number of rows and columns)in the view management section of setup area. By default it is 1×1 which means you can add only 1 dashboard. If you want to add more dashboards, accordingly you can adjust the grid.
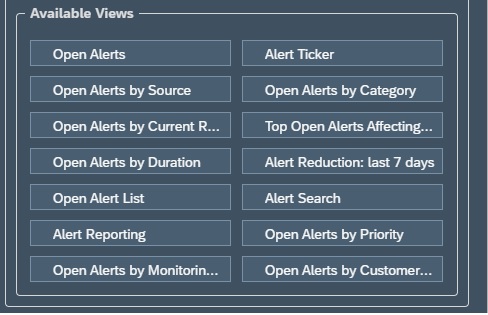
Then you need to select a view, based on what you want to show in the dashboard, by selecting from the list of available views. You can select a view by simply dragging and dropping in the dashboard layout.
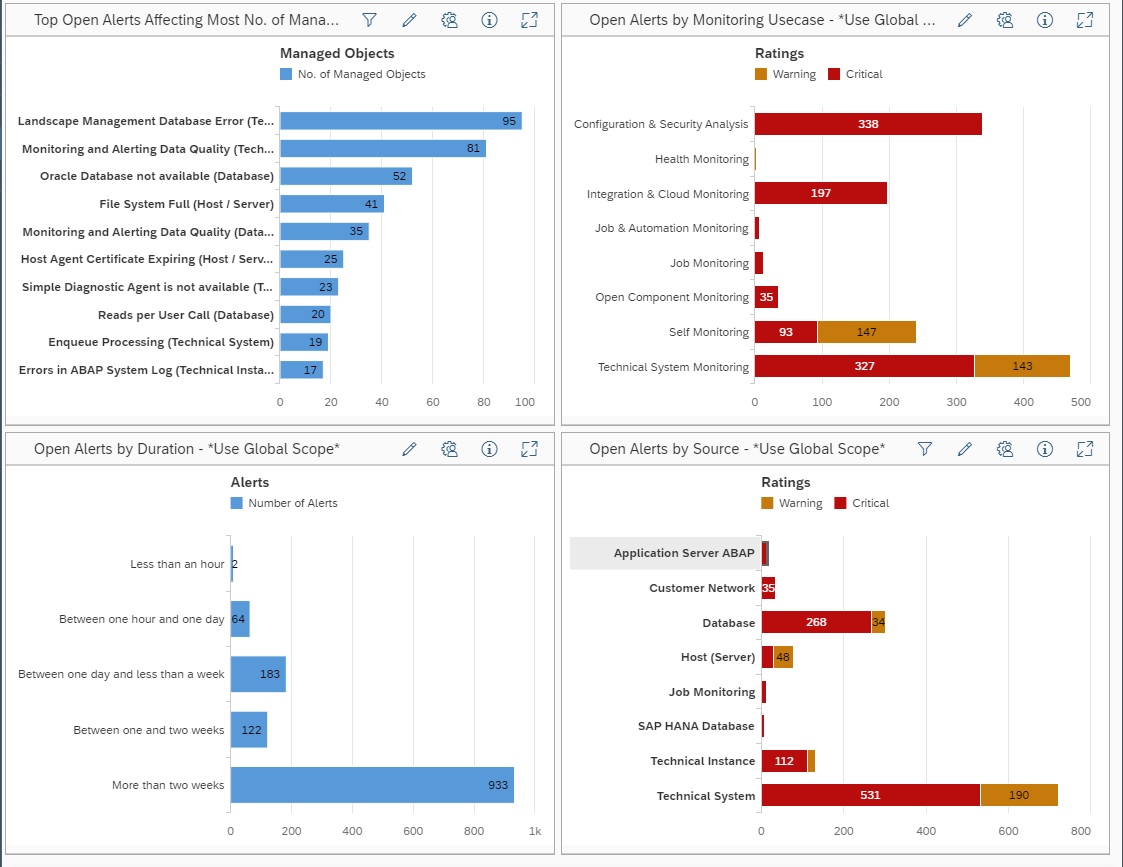
In this example we have selected 4 views in the 2×2 grid layout.
Top Open Alerts affecting most no. of Managed Objects
Open Alerts by Monitoring Usecase
Open Alerts by duration
Open Alerts by source
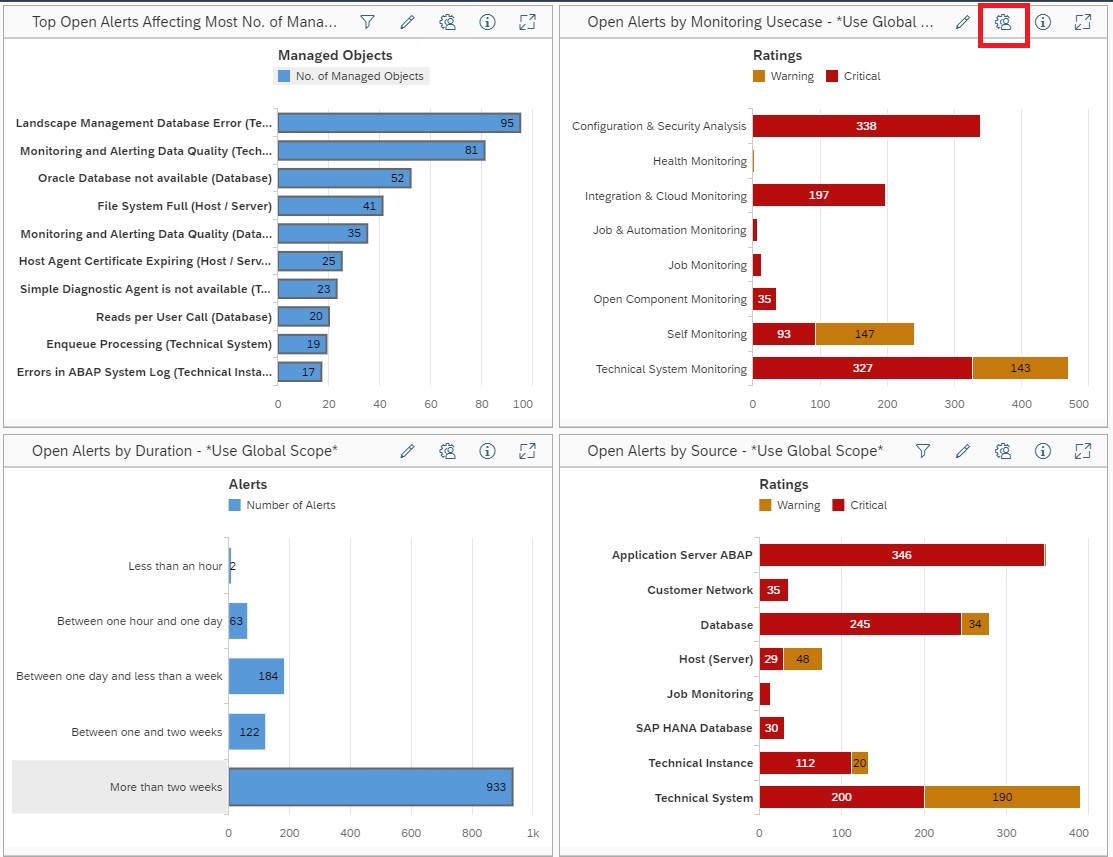
By default all the dashboards in your custom dashboard will use the Global Scope, the scope inherited from the scope you selected while opening the Alert Management App. You can also select a custom scope for your dashboard. For example in this case we want to filter for all production system alerts. For this click on the setup button of the dashboard you want to specify the scope.
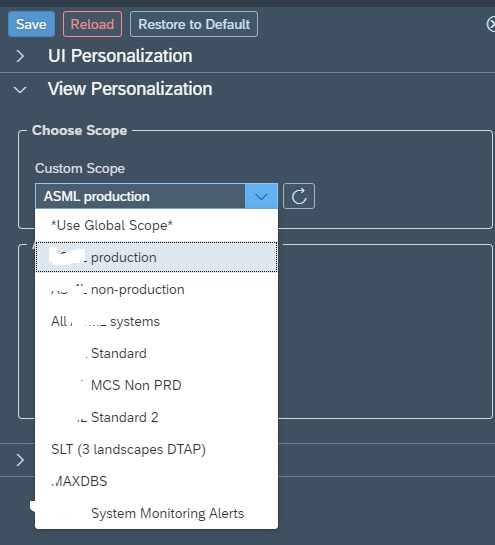
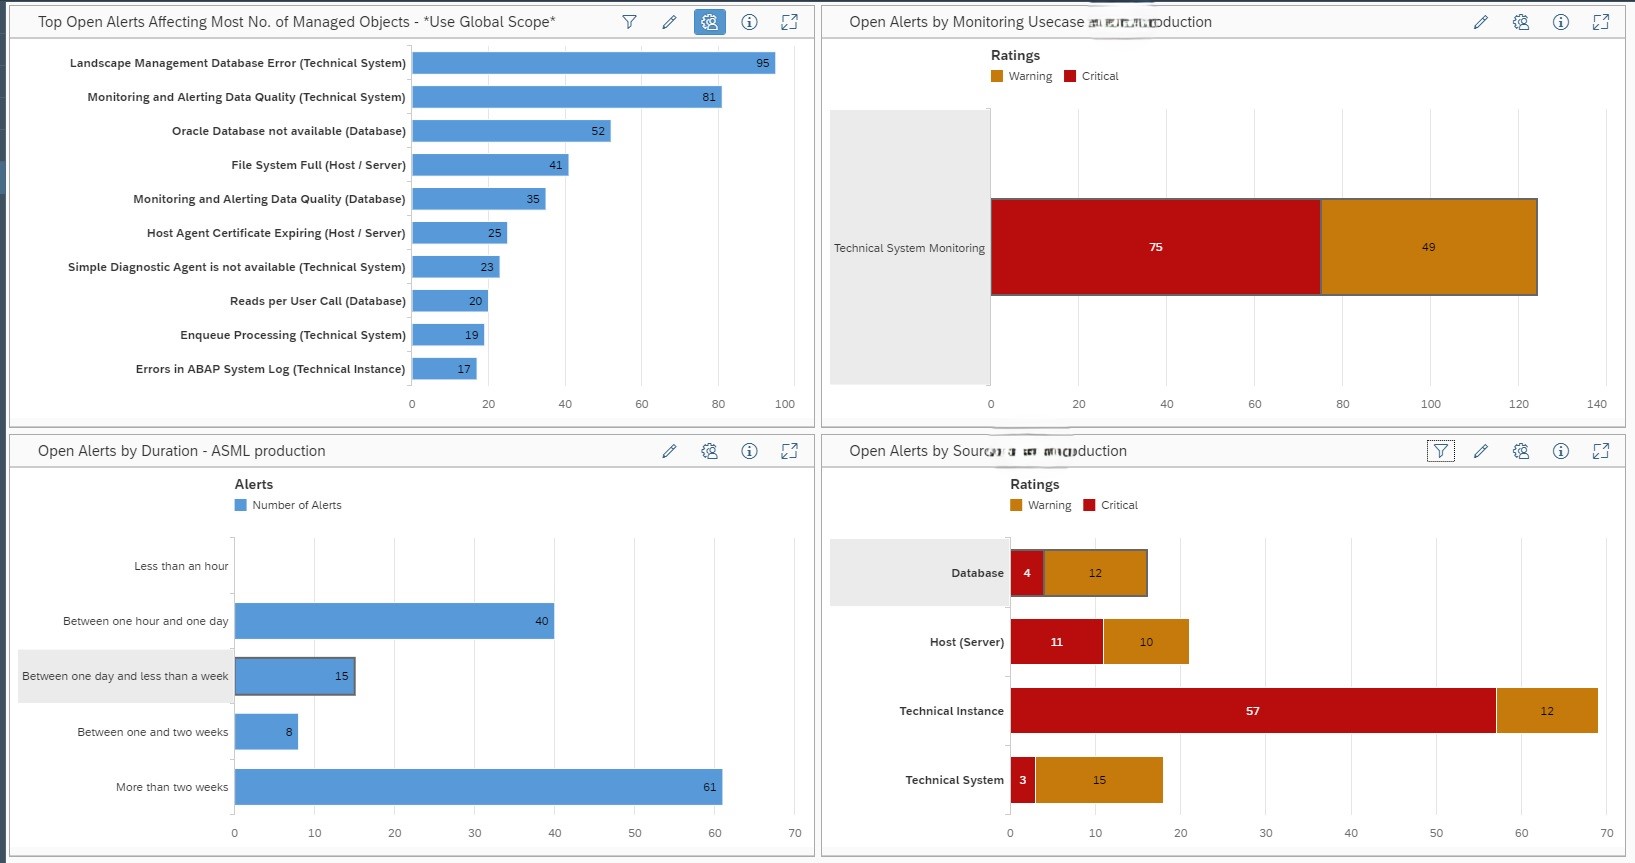
Then in the setup area, in the scope selection, select your custom scope from the drop down list. Note: You must have already created your custom scope in the Scope management section.
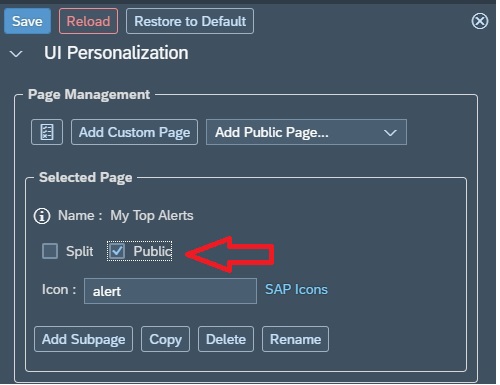
Once you have finalized your dashboard you can publish your dashboard by marking it as public so that others can also use the dashboard.
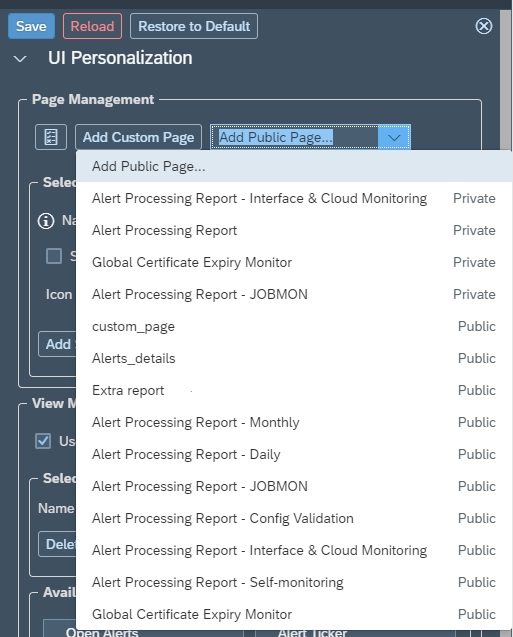
However, by default the public custom dashboard is not added in the navigation panel of all other users. To be able to view the dashboard a user has to again click on the + sign in the navigation panel, and then in setup area select the public page.
<< This blog was originally posted on SAP Focused Run Guru by Manas Tripathy (Simac). Repost done with permission. >>
Process Chain Monitoring in SAP Focused Run is possible via Job And Automation Monitoring which is available as of SAP Focused Run 3.0 FP02.
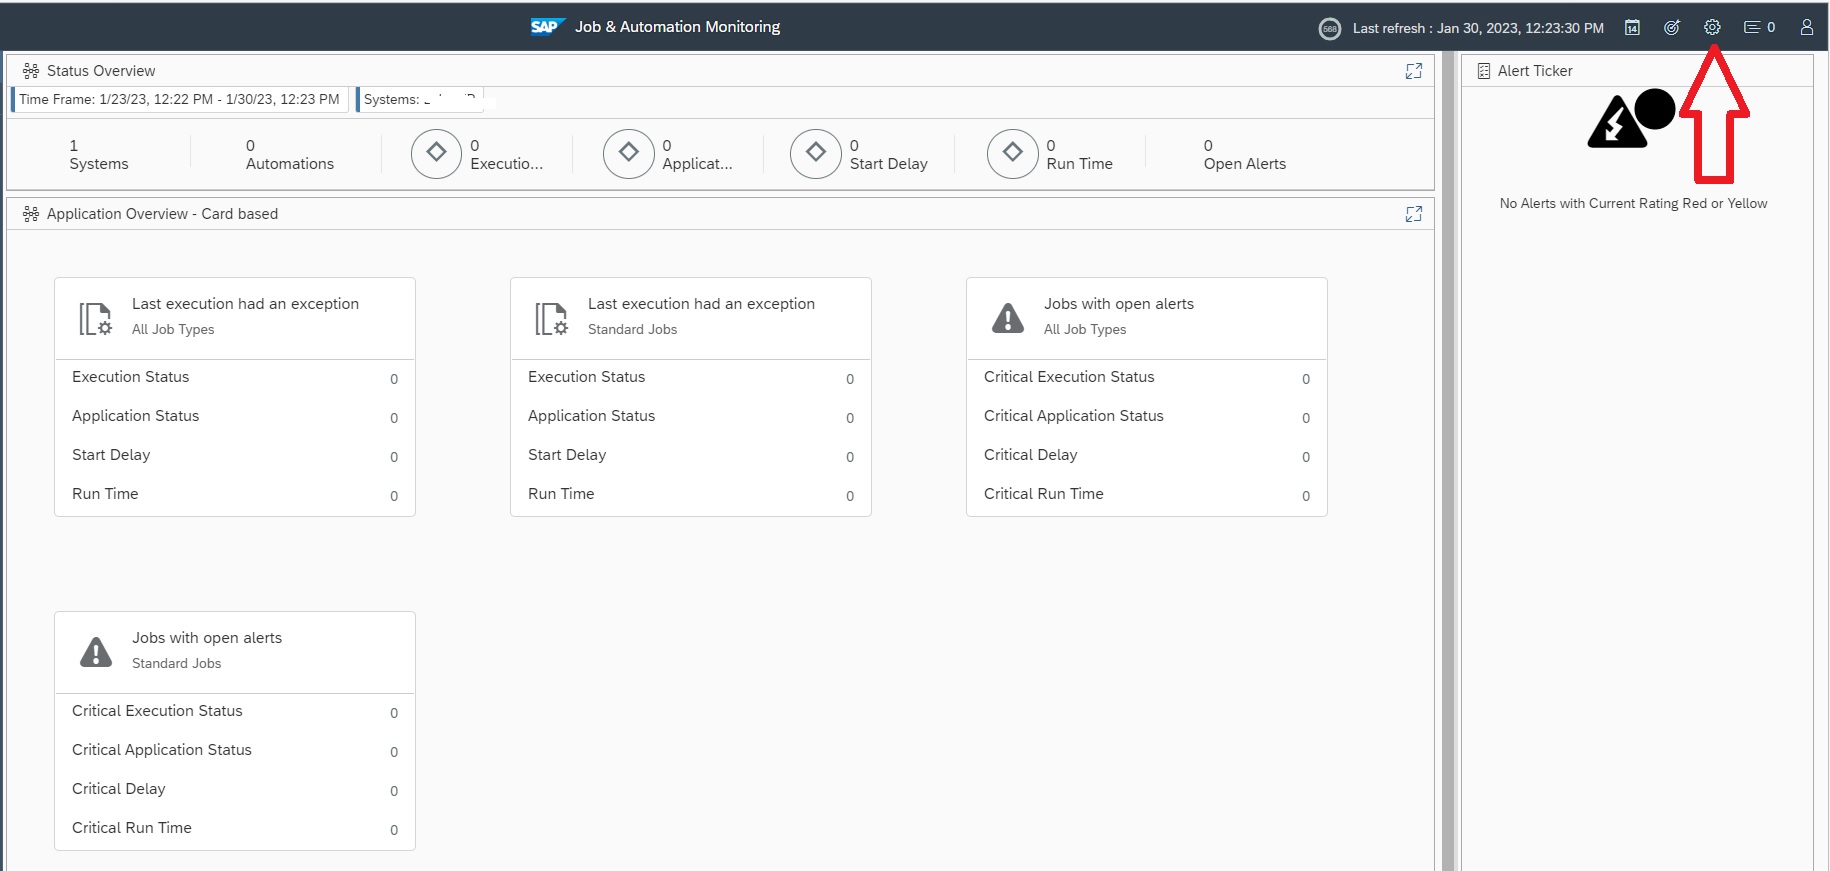
You can launch the Job & Automation Monitoring app in the Advanced Application Management section in the Focused Run launchpad.
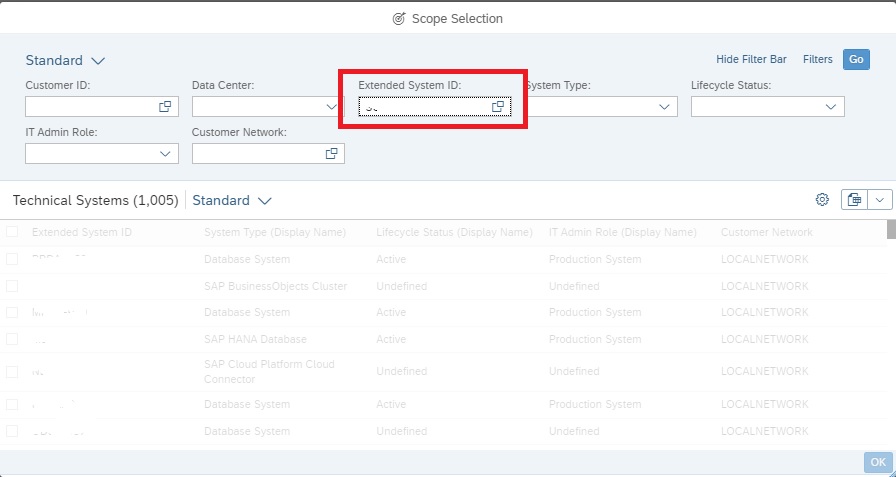
When you launch the app you will be asked for a scope selection for which you can specify the systems for which you want to activate Process Chain Monitoring.
To start the setup of Process Chain Monitoring click on the settings button.
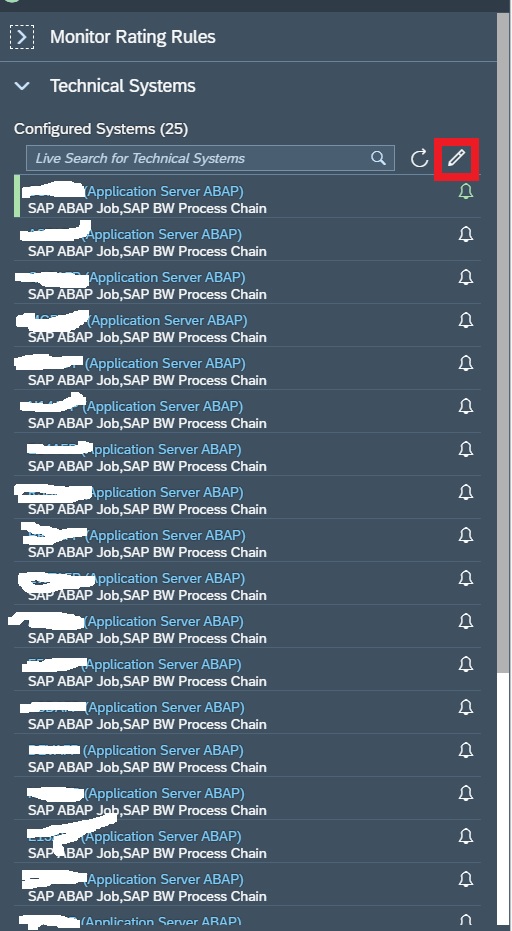
In the settings popup click on the pencil button under Technical Systems.
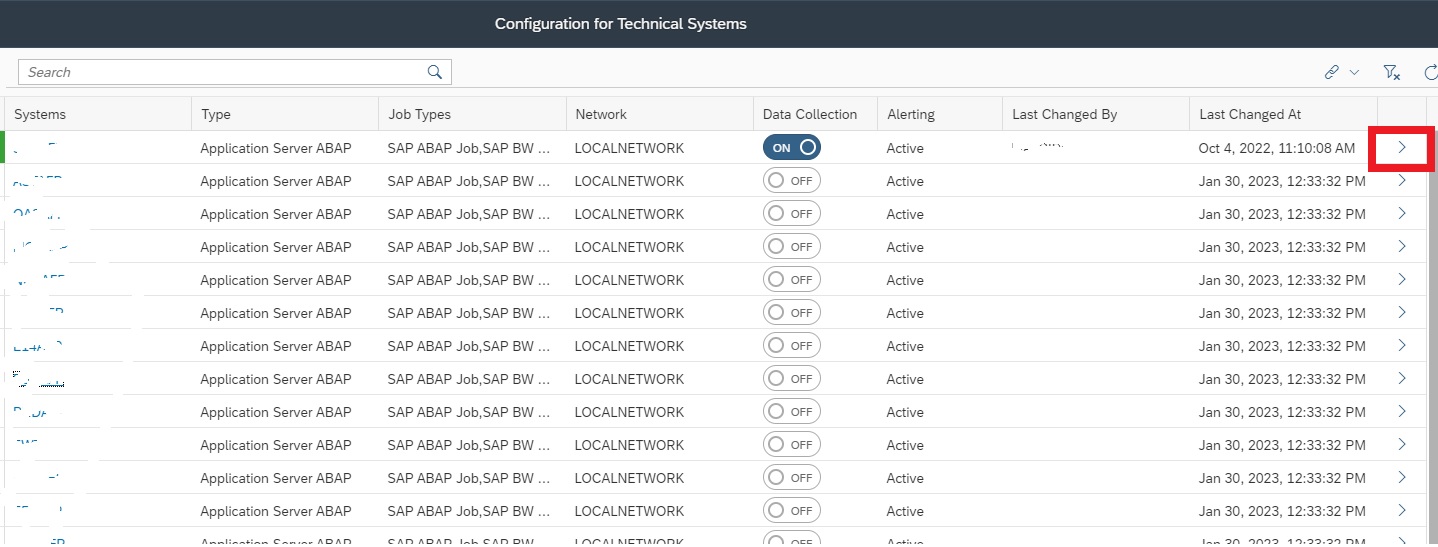
In the next popup select the system for which you want to configure process chain monitors by clicking on the area as shown below.
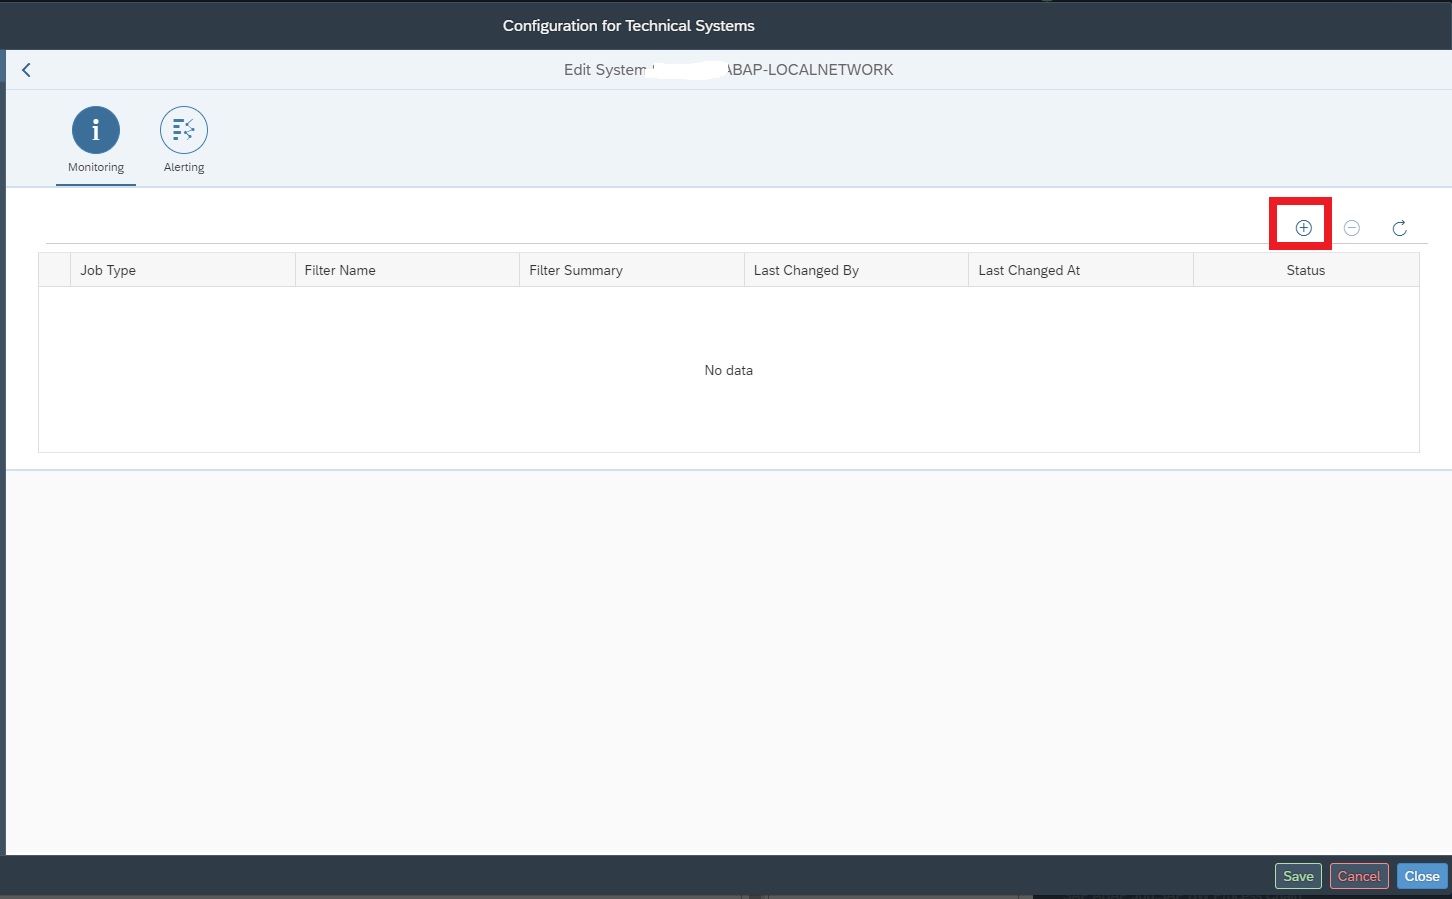
In the next screen , in the Monitoring tab click on the + sign to create a new filter to activate data collection.
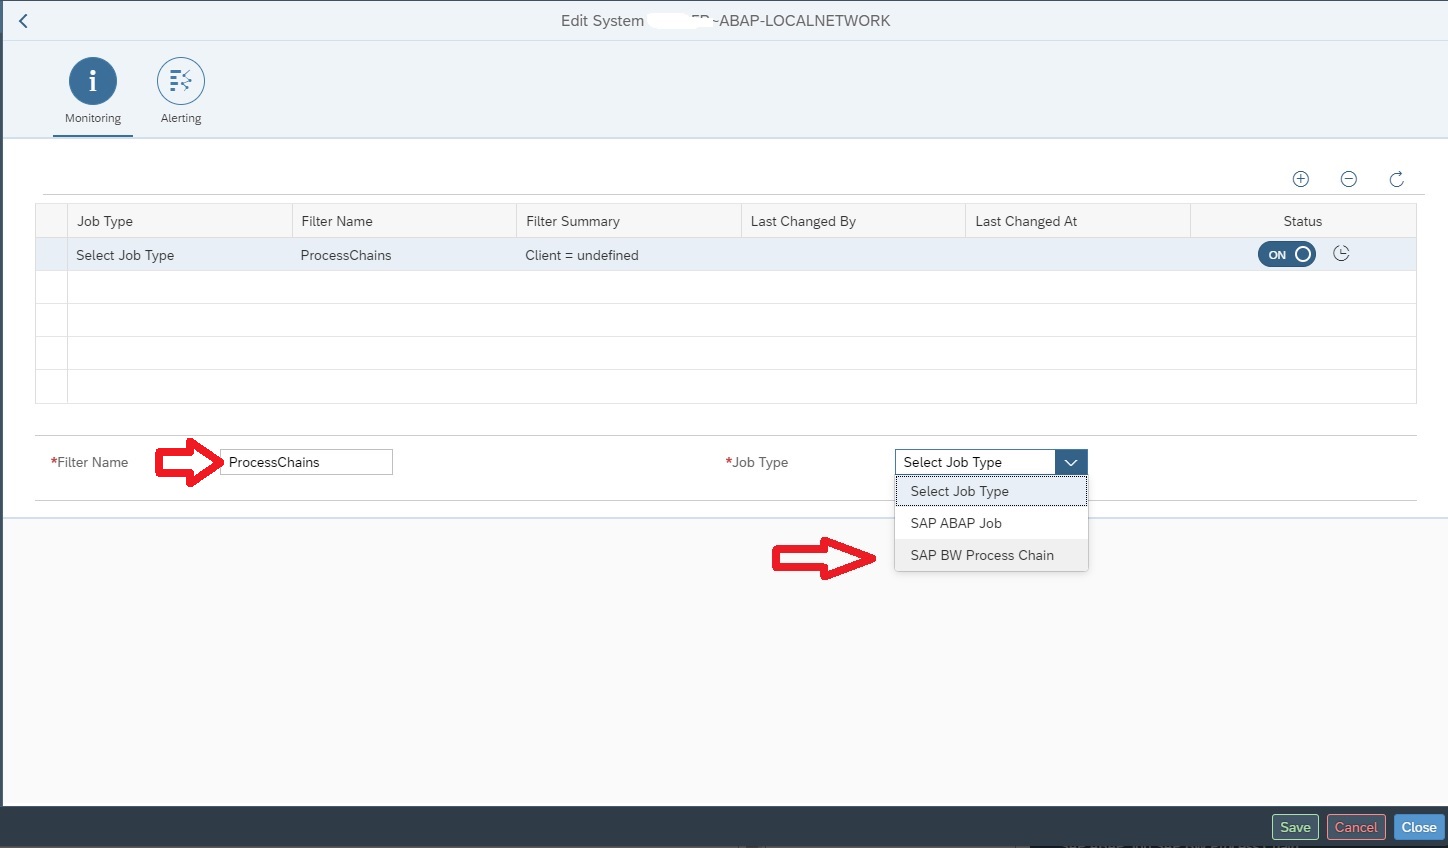
Now provide a filter name and then in Job Type select SAP BW Process Chain and save.
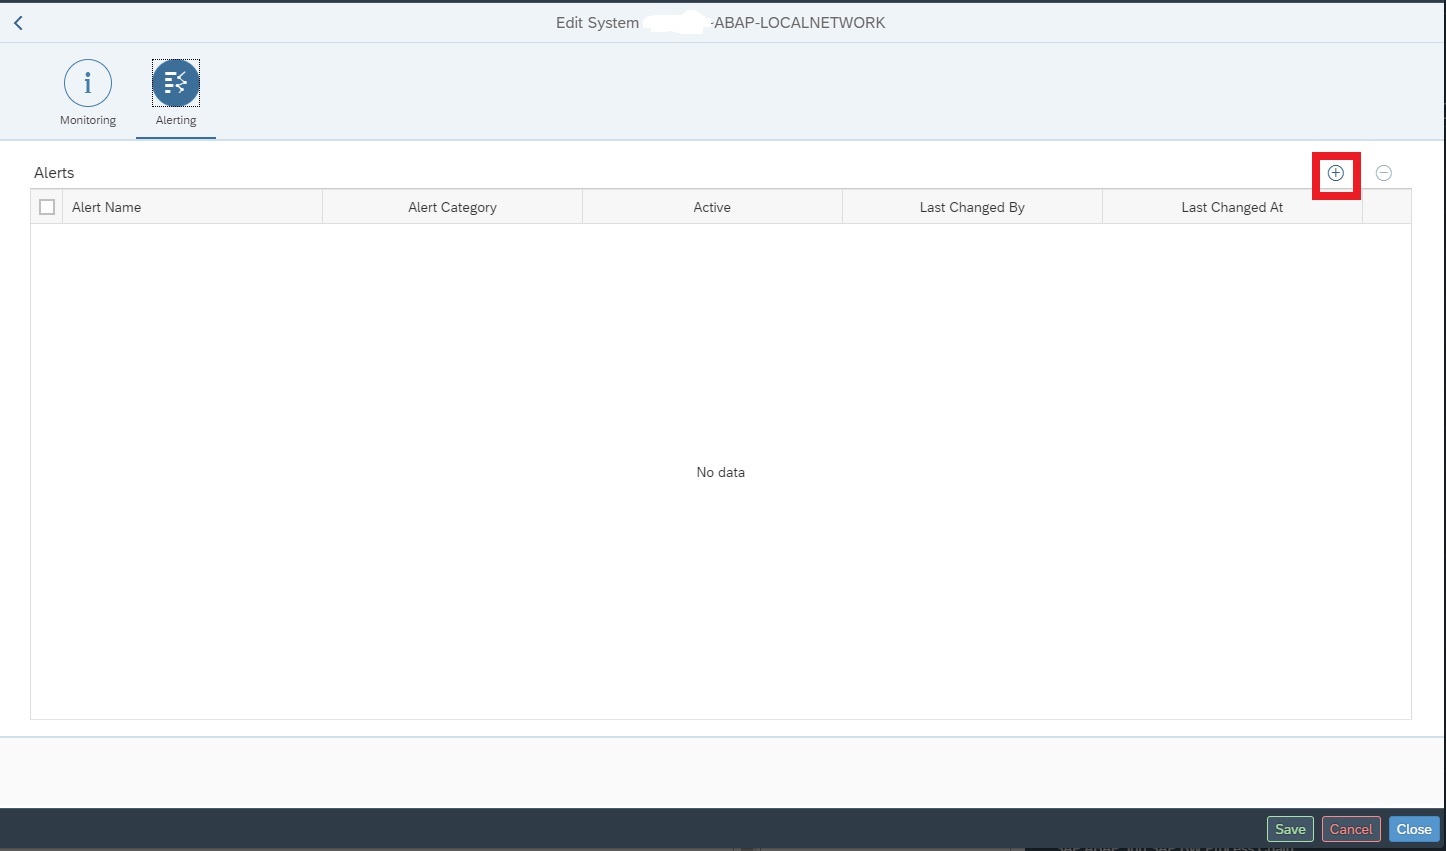
After creating the filter move to Alerting tab and click on the + sign to create a new alert.
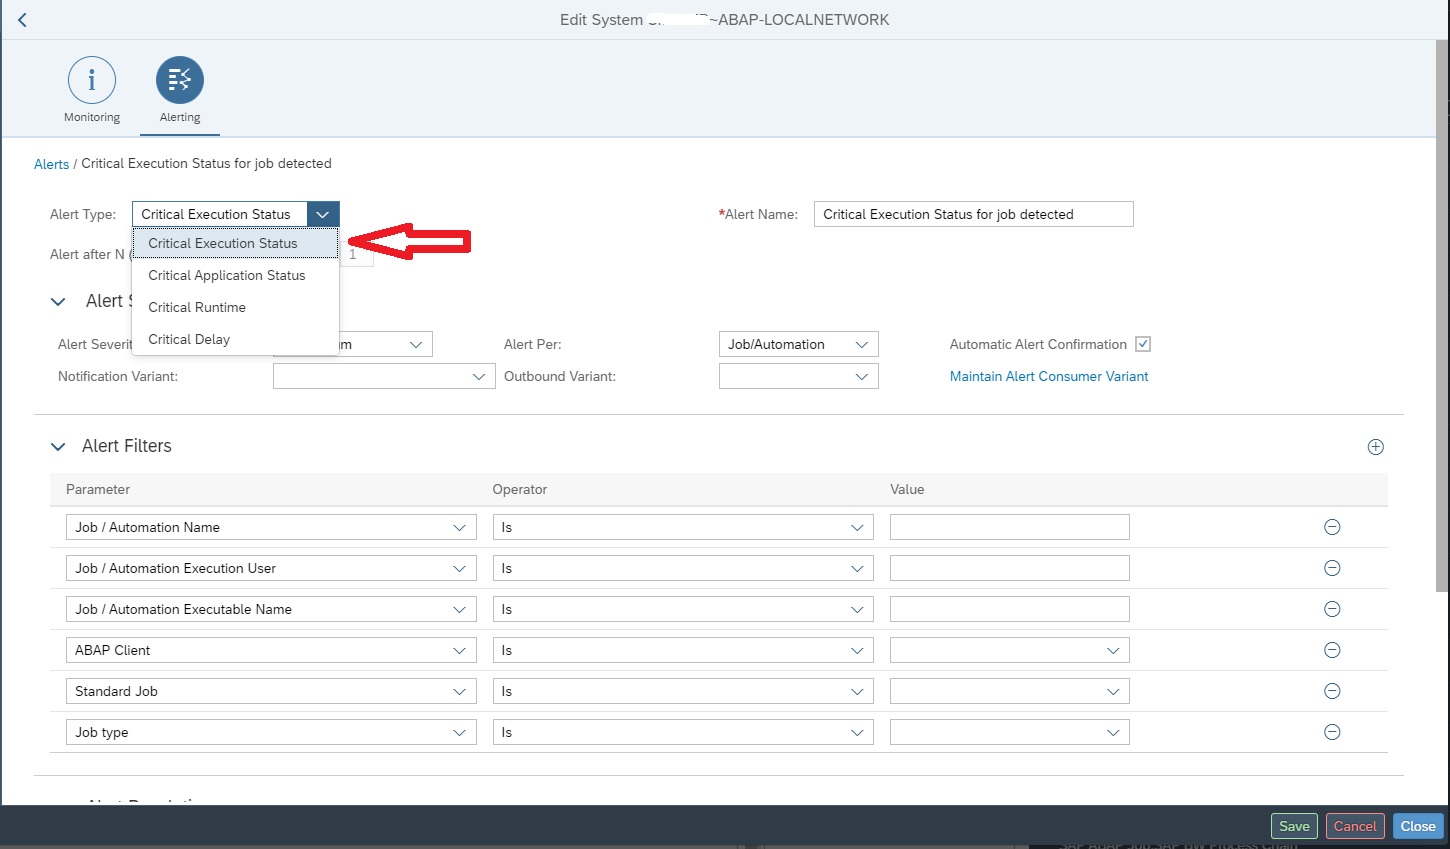
You can create the following types of alerts.
Critical Execution Status: The Execution Status is rated green, if a job finished successfully and red, if the job execution did not finish, i.e., aborted. It is rated yellow, if a job finished with warnings or errors without aborting.
Critical Application Status: The Application Status is rated green, if a job successfully processed the application data. It is rated red, if e.g., an ABAP job execution writes errors into the application log and yellow, if there are warnings, but no errors.
Critical Delay: The Start Delay rating is rated green, if the technical delay of a job (e.g., in case of an ABAP job the time passed until a job gets a work process assigned) did not exceed the threshold defined.
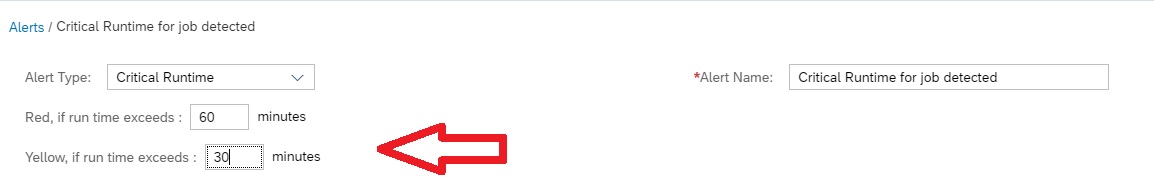
Critical Runtime: The Run Time is rated green, if the runtime of a job did not exceed the threshold defined.
To create the alert first select the alert type.
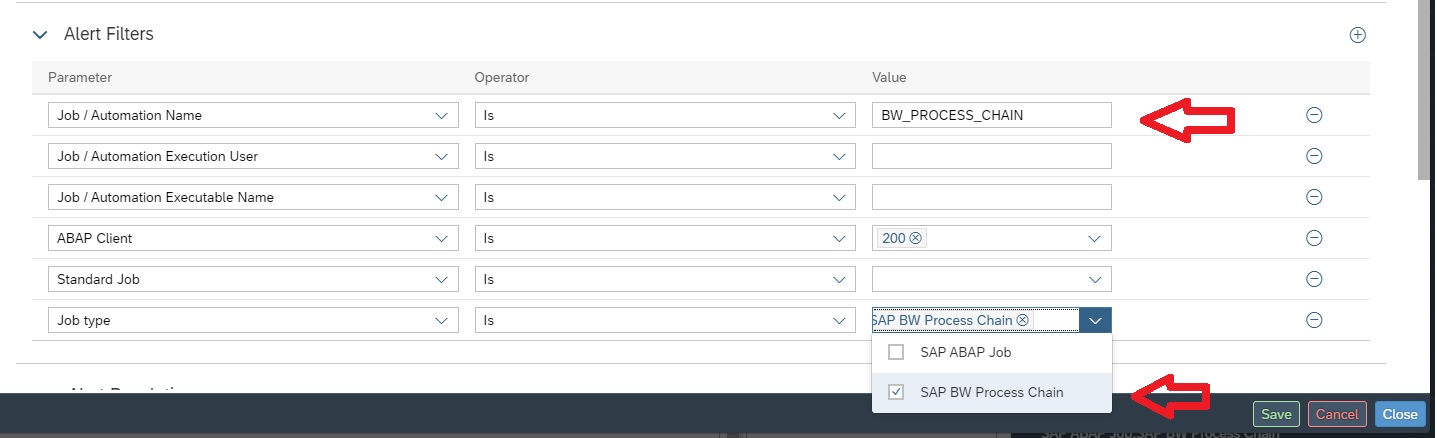
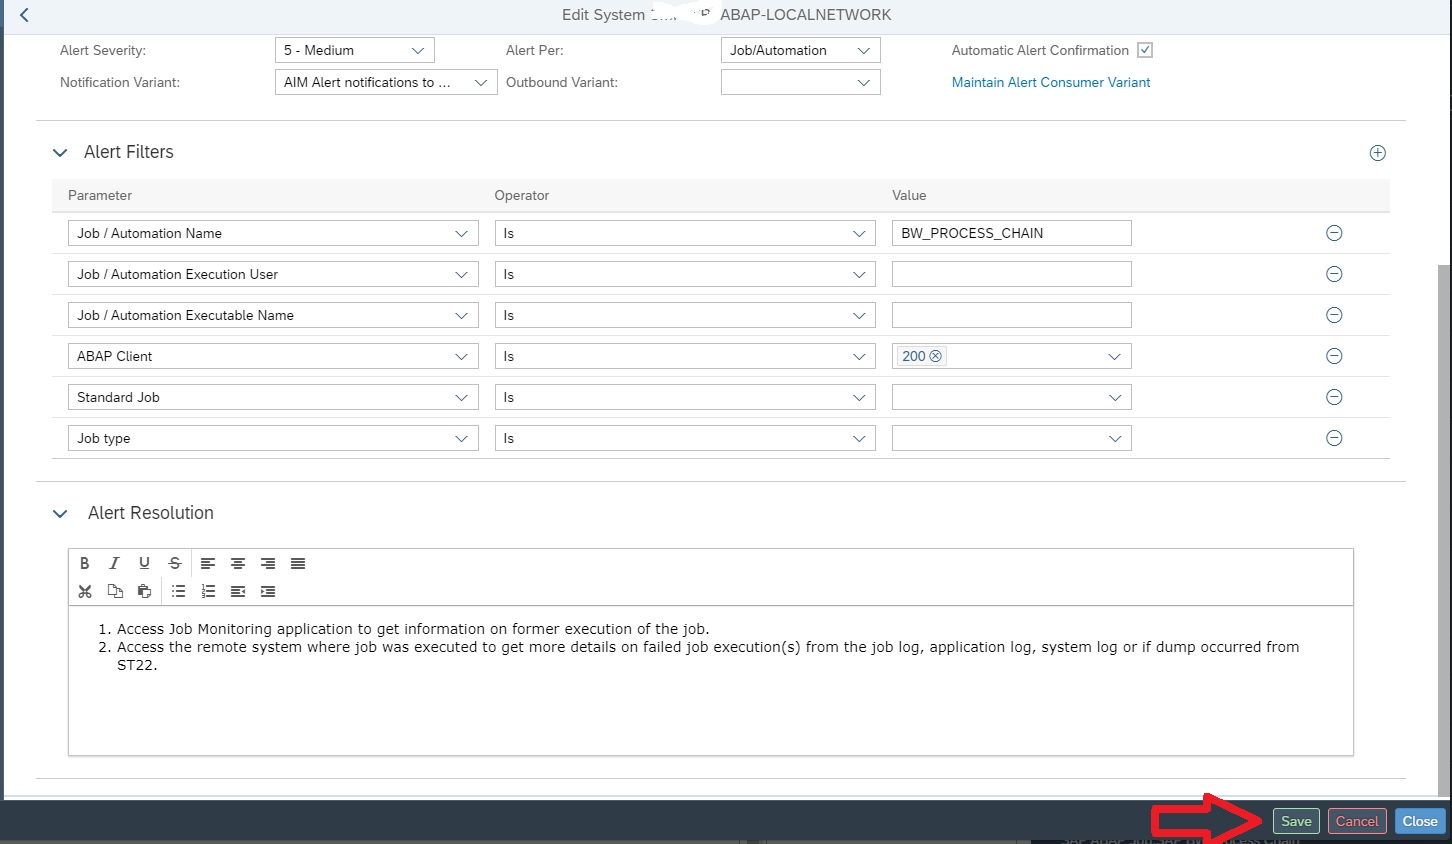
Then in Alert Filters section provide the BW Process Chain name for which you want to activate alerting. Also you must provide the job type as BW Process Chain. You can optionally enter further filters like Execution User, Executable Name, ABAP Client and whether it’s a Standard Job or not.
Note: With Job & Automation monitoring you can create alerts for Standard ABAP jobs as well. The filters Executable Name and Standard Job is applicable only for ABAP Job type.
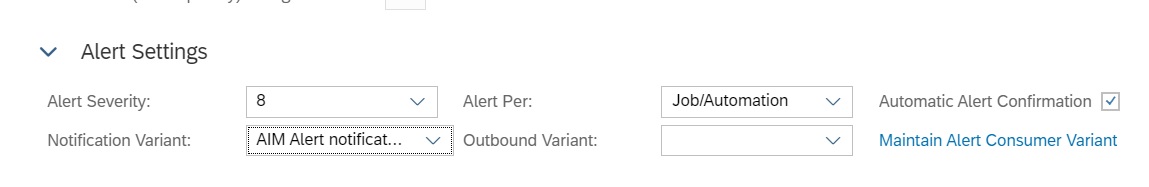
Optionally you can also set Notification Variant, Alert Severity and enable Automatic Alert Confirmation in the Alert Settings section.
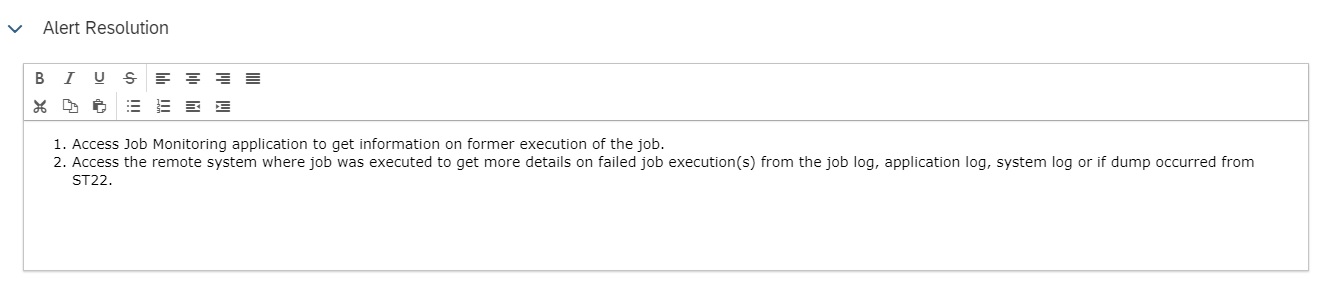
Optionally you can also provide Resolution Instructions in the Alert Resolution area.
If you select alert type Critical Delay or Critical Runtime you also have to enter the thresholds.
Finally click on the Save button to save and activate the alerting.
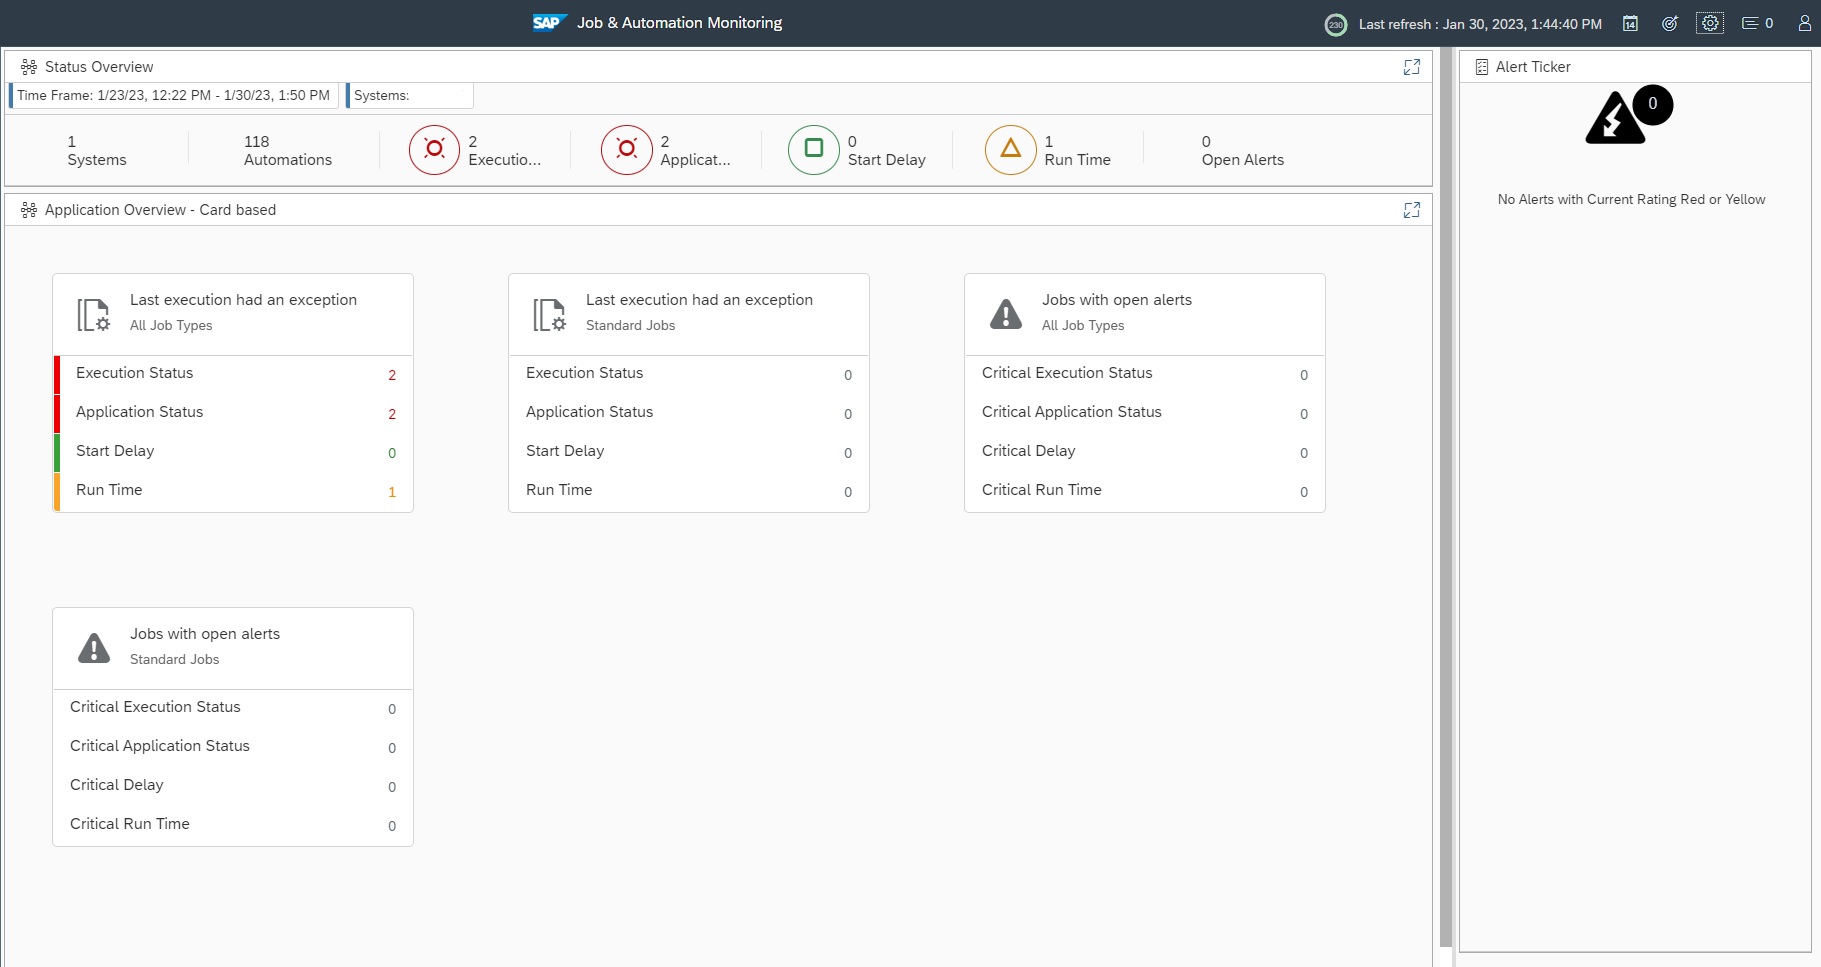
Note: When we activate monitoring of process chain by creating the filter in the Monitoring tab, we activate data collection for Process Chain monitoring. This will enable data collection of all process chains of that managed system. You can see status of all process chain runs for that system in the main page of the Job & Automation Monitoring app. Additionally and optionally you can create/enable alerting in the Alerting tab to alert on specific process chain failures.
Note: Since the launch of Job & Automation Monitoring in Focused Run 3.0 FP2 the old Job Monitoring feature has been renamed to Job Monitoring ABAP Only. The Job Monitoring ABAP Only functionality is completely deprecated as of release of Focused Run 4.0.
For more details on Job & Automation Monitoring you can refer to SAP documentation here.
<< This blog was originally posted on SAP Focused Run Guru by Manas Tripathy (Simac). Repost done with permission. >>
For activating SAP Focused RUN monitoring functionalities on an SAP ABAP system you need to perform Simple System Integration of SAP ABAP Systems
Simple System Integration, or shortly known as SSI, is a guided procedure similar to the managed system setup in SAP Solution Manager. SSI is used for integrating a managed system to SAP Focused Run system. Unlike SAP Solution Manager managed system setup, SSI is fully automatic and has no manual steps.
In order to ensure SSI is completed successfully we need to ensure all -prerequisites are met.
The term SSI is bit misleading. It is not so simple as it seems. Once you have the procedure known for your landscape it does become simple. The first one is NOT simple.
Focused Run Prerequisites
Before you can perform SSI for any managed system, you need to ensure the basic framework setup prerequisites are met. For this ensure all activities mentioned in section 5.2.4 Preparing Simple System Integration of the SAP Focused Run master guide.
Managed System Prerequisites
1.) Simple Diagnostics Agent deployed on all hosts of ABAP Managed system.
See below for description on how to do this. You can also refer the SAP documentation here.
2.) ABAP Managed system is registered in LMDB and Data Supplier Completeness check is green.
In our future blogs we will explain how to register various types of managed systems into LMDB. And for troubleshooting in case Data Supplier Completeness check is not green, you can follow SAP’s documentation here.
3.) Database preparation is complete.
You need to perform certain database specific pre-requisite configurations in order to perform the integration of the underlying database of the managed system. In this SAP documentation SAP has outlined the steps for various types of databases.
4.a) For ABAP a system user is created in the managed system production/main client. This user will be required for RFC connection to the managed system. We refer to this user as FRUN user. You can refer to this SAP documentation to get the list of roles that needs to be assigned to this FRUN user for an ABAP based system.
4.b) For JAVA a system user is created in the managed system production/main client. This user will be required to authenticate local HTTP and P4 calls by the simple Diagnostics Agent for data collection. We refer to this user as FRUN user. You can refer to this SAP documentation to get the list of JAVA roles that needs to be assigned to this FRUN user.
Deploying Simple Diagnostic Agents on Managed Systems
Deploying Simple Diagnostic Agents (SDA) on Managed System hosts is a prerequisite to performing Simple System Integration (SSI) of Managed systems on focused run system.
The SDA is installed/deployed as an add-on to the SAP host agent. Hence it’s mandatory to install SAP Host Agent on each host of the managed system which needs to be monitored by SAP Focused Run System.
The deployment of the SDA on the managed system system host is carried out from the SAP Focused Run system itself.
Below steps need to be performed for deploying SDAs on managed system hosts.
Download binaries from marketplace
Download the latest version of the binaries SDA and SAP JRE (Java Runtime Environment) from SAP Support Portal as follows:
Select tab Support Packages & Patches –> By Category –> SAP Technology Components –> Focused Run –> Focused Run 3.0 –> Downloads –> Comprised Software Component Versions
Download from SAP JRE 8.1 and SIMPLE DIAGNOSTICS AGENT 1.0
Following platforms are supported:
IBM AIX
HP-UX on IA64
Linux on Power BE & LE
Linux x86_64
Oracle Solaris SPARC
Oracle Solaris x86
Microsoft Windows Server on x86_64
You can find all information regarding latest available version of SDA and its compatible JRE version in SAP Note 2369401 – Release Note for Simple Diagnostics Agent 1.0.
Upload Binaries onto SAP Focused Run system
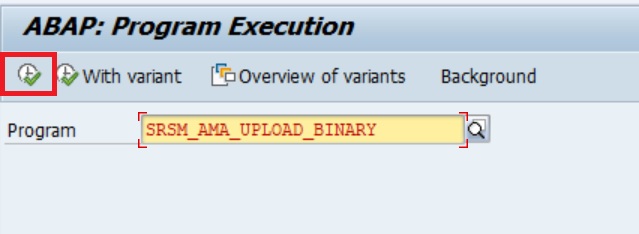
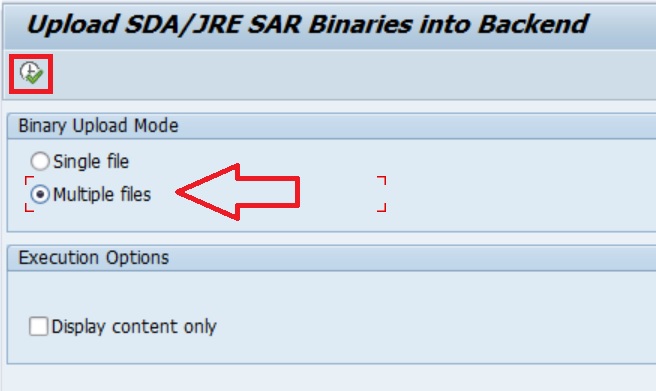
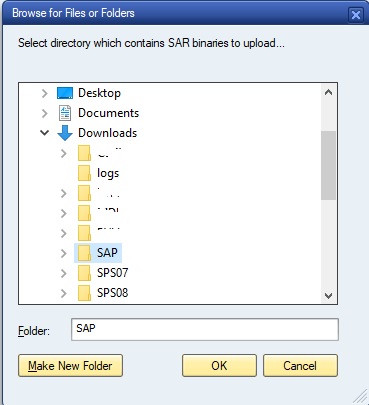
Upload the binaries to SAP Focused Run, by running the report SRSM_AMA_UPLOAD_BINARY, with transaction SA38.
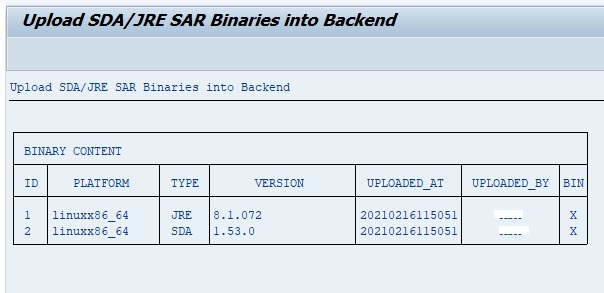
Upon completion of the upload you will see the below output.
Deploy SDA on Managed system host
Register Managed system host on Focused Run system: Before you can deploy SDA on managed system host, the host has to be registered to the Focused Run System. For this execute the following script at OS level as sapadm user from folder /user/sap/hostctrl/exe
./saphostctrl -function ConfigureOutsideDiscovery -enable -sldusername FRN_LDDS_FRS -sldpassword xxxxxxxxxx -sldhost <hostname of FRUN system> -sldport <http/https port of FRUN system>
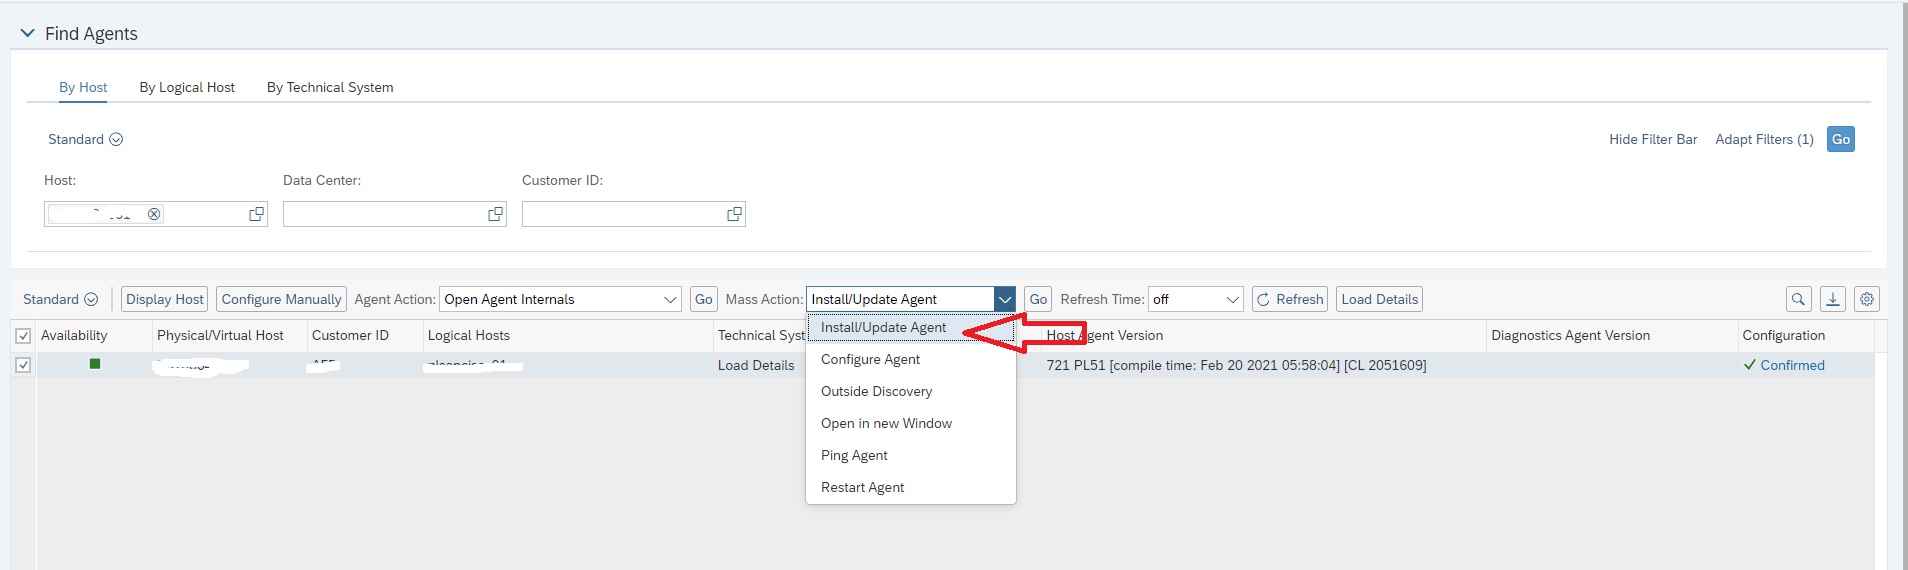
Upon executing the above commands at host level, you can see the host listed in Agent Administration of Focused Run system. Navigate to the Agent Administration app in the Infrastructure Administration block of the Focused Run launchpad.
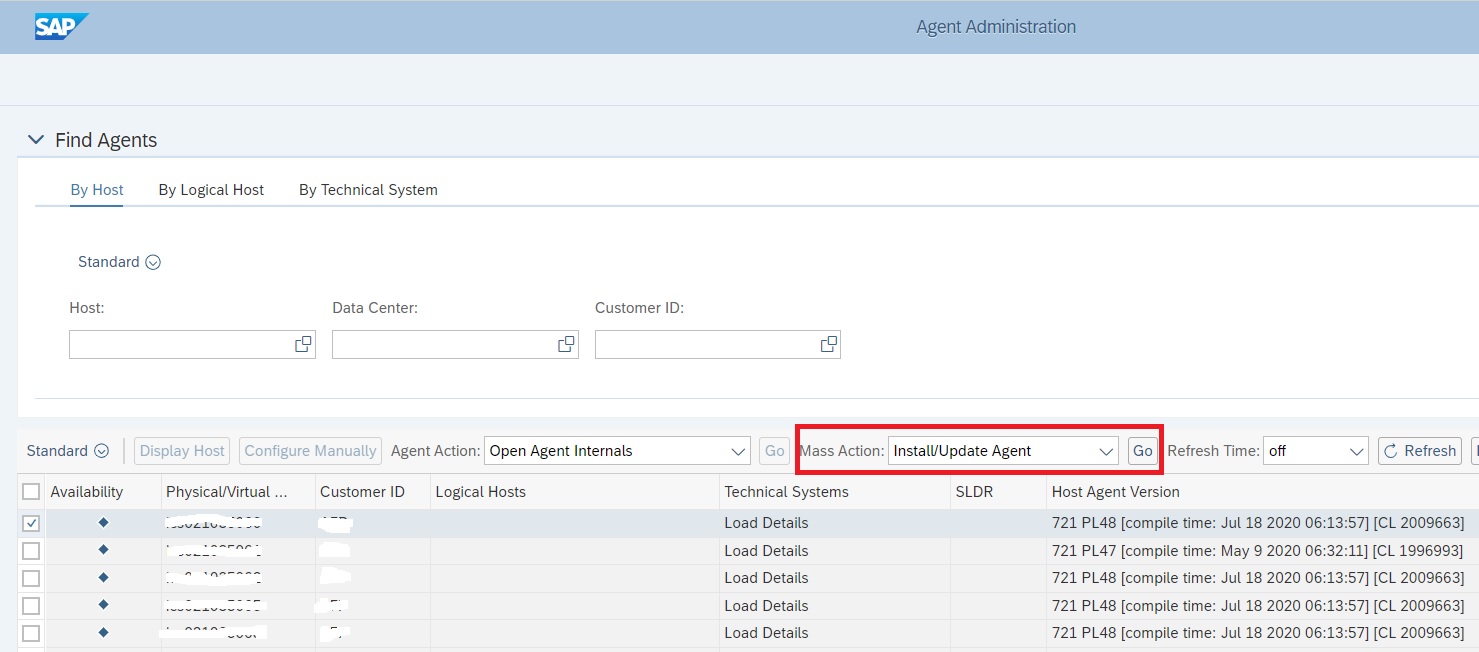
In the Agent Administration App, select the host for which you want to deploy the SDA, select Install/Update Agent and click on Go.
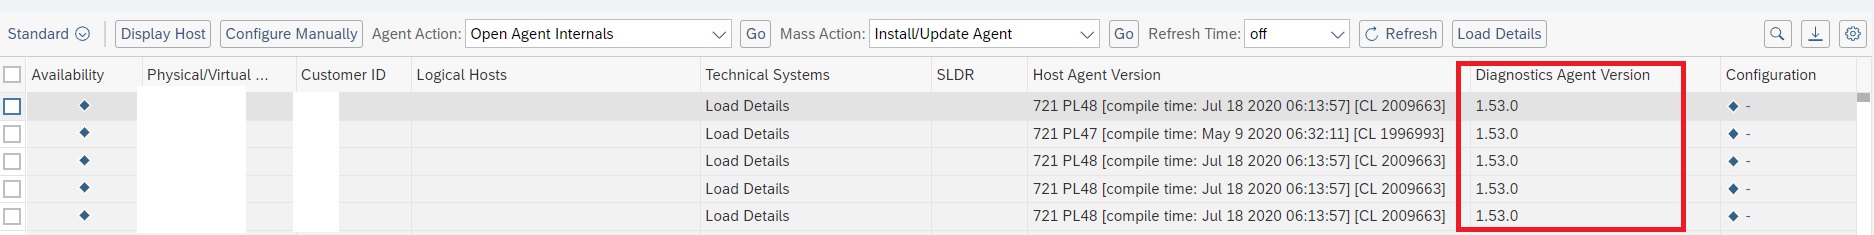
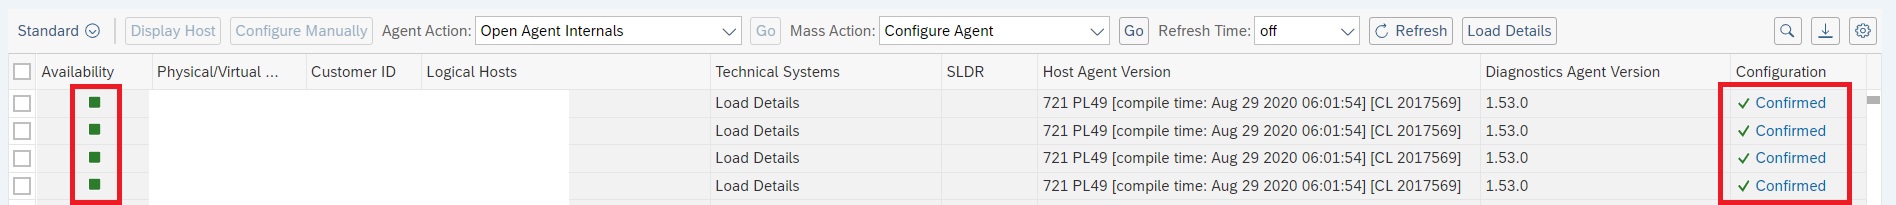
Upon completion of the deployment, you will see the agent version listed in the Diagnostic Agent Version column.
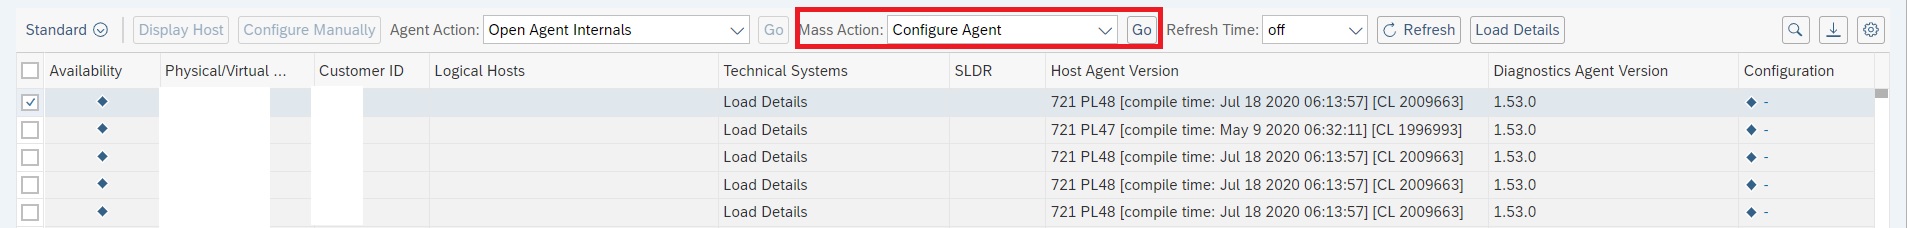
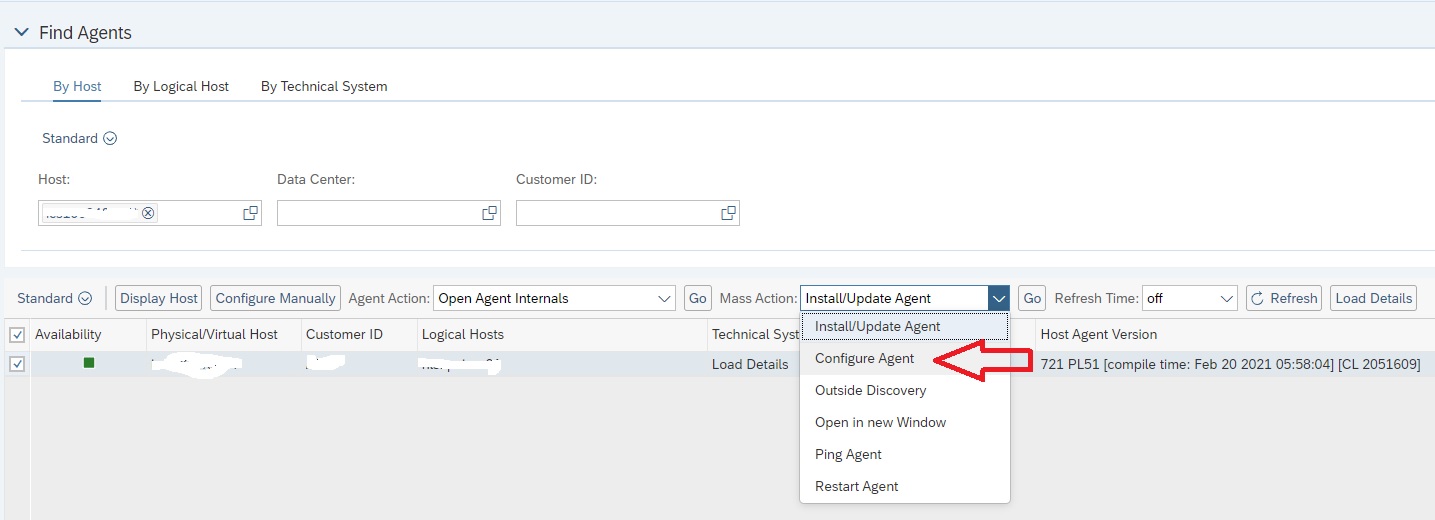
After SDA installation/update is successful you also need to configure the agent. This will enable the agent to receive monitoring definitions from the focused run systems as well as enable Self Monitoring of the agent.
Upon completion of configuration, you will see green icon under availability column. Also Configuration status updated to Confirmed.
You need to follow the same steps for installing and configuring agents on all application server hosts as well as database hosts of the managed system.
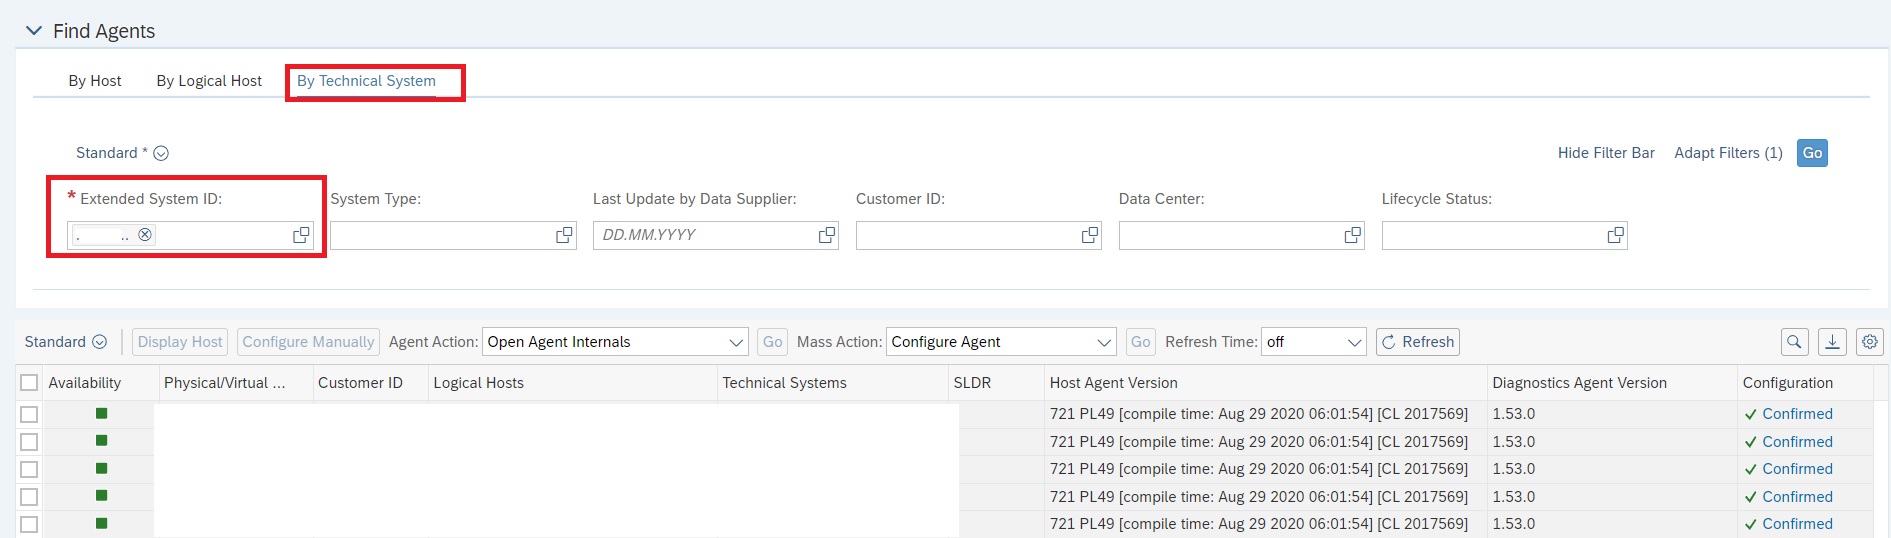
Note: You should perform the Simple System Integration of a managed system only after you install and configure agents on all its hosts. You can also list hosts and their agent status of a particular managed system in the By Technical System tab of the Agent Administration app.
Performing SSI of ABAP managed system
For executing SSI navigate to the SSI app in the Infrastructure Administration section of the Focused Run launchpad.
In the SSI app scope selection area you can enter the managed system extended SID individually or you can select a more generic filter to list multiple systems.
SSI is performed in 2 steps for ABAP systems.
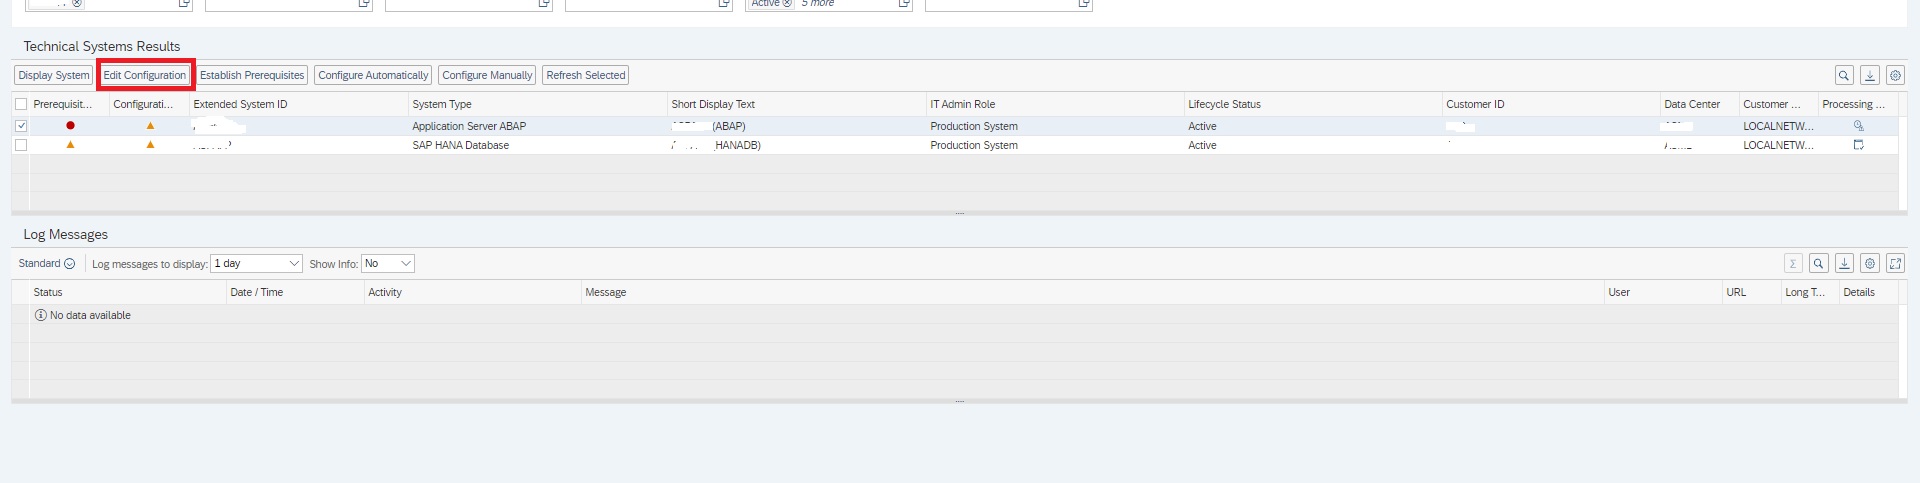
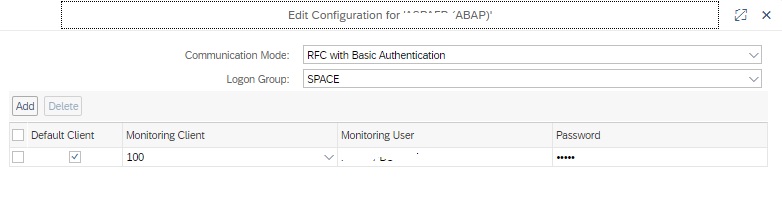
Step 1: Edit Configuration
For ABAP systems in this step you need to enter the details of the FRUN user that you created as a prerequisite.
For this select the row for the ABAP system and click on the Edit Configuration button as shown in below screenshot. Next in the pop-up enter the credentials of the FRUN user.
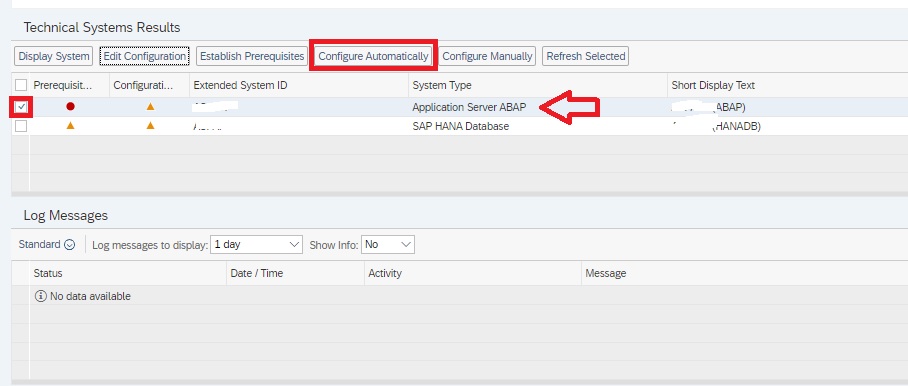
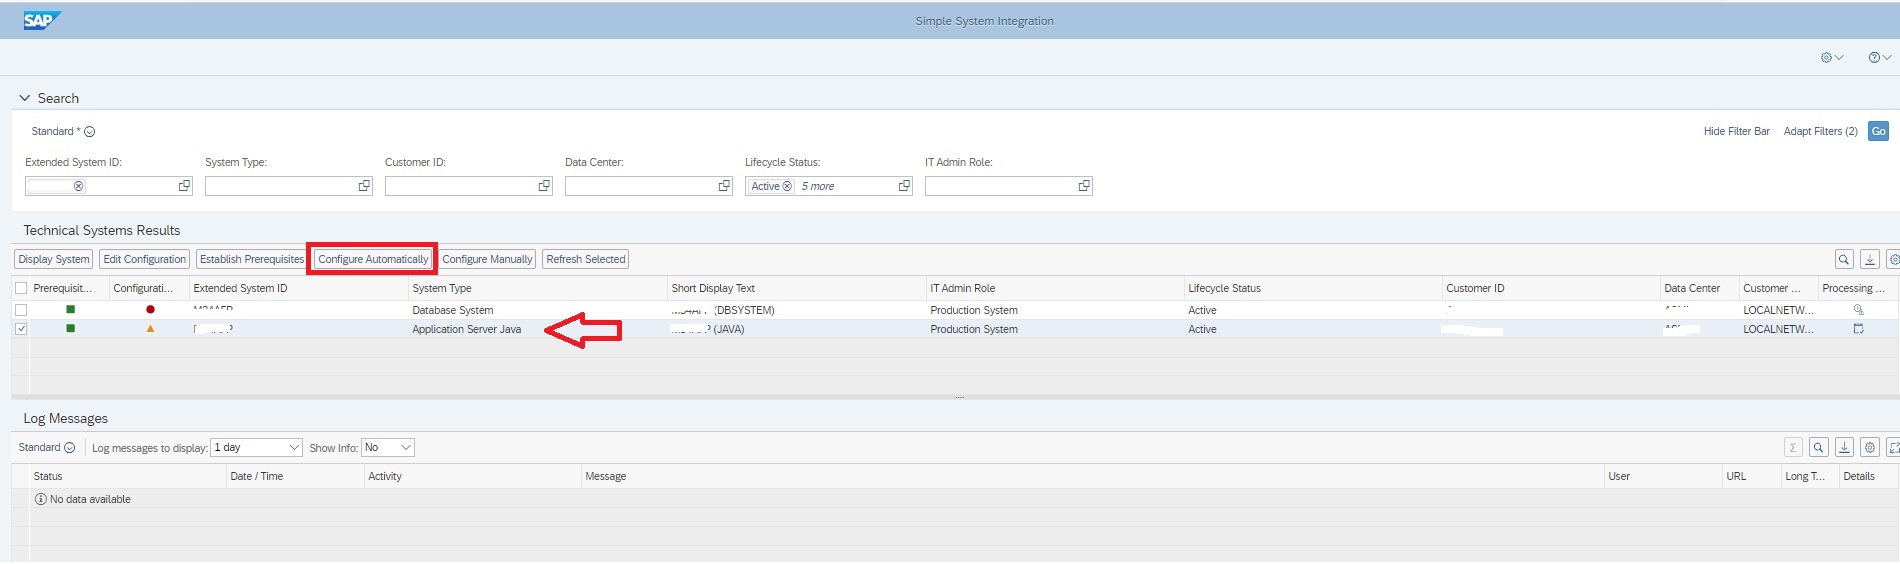
Step 2: Configure Automatically
In this step, select the ABAP managed system for which you want to perform the SSI and click on the button Configure Automatically.
Note: When you perform SSI for the main technical system, it will automatically perform the SSI for all the underlying components in the system hierarchy. That is, if you perform SSI for Application Server ABAP, it will also perform the SSI for the system's database. However the if you perform first the SSI of the system's database it will not automatically perform the SSI of the main technical system and you will again have to perform the SSI for the technical system again separately.
Additional Pre-requisite for JAVA Managed Systems.
Other than the above mentioned pre-requisites, for JAVA systems, you also need to Install BCI Adapter (CA Introscope Wily Adapter) to collect performance metrics and trace data of the NW Java.
You can also refer to section SAP NetWeaver Application Server Java in this SAP Focused Run expert portal blog for managed system preparation.
Installing CA Wily Introscope BCI Adapter for SAP Java Systems
SAP Focused Run system collects performance metrics and trace data of the SAP Netweaver Java systems through the CA Wily Introscope Byte Code Injection (BCI) Adapter.
Before you perform SSI for a SAP JAVA system you need to install and configure the BCI Adapter on each instance of the Java stack
Upon installing the BCI Adapter, SAP JAVA system reports performance and trace data to the CA Wily Enterprise Manager (Wily EM) and later on SAP Focused Run monitoring will collect the data from Wily EM for the relevant monitoring metrics.
Unlike SAP Solution Manager, for SAP Focused Run BCI Adapter setup for managed system is a completely manual step. This blog is therefore intended for the technical or SAP Basis consultants who are responsible for installation and setup of SAP Focused Run system.
The following steps are required to install and configure the Introscope Agent
Extract the Introscope Agent files
Configure the Introscope Agent
Introscope-enable the application code by setting Java VM parameters
Pre-Requisite for BCI adapter
The BCI Adapter needs to connect to a Wily Enterprise Manager. You must ensure the Wily Enterprise Manager is already connected and configured for your SAP Focused Run system. In our blog we have explained how to configure Wily EM to connect to a Focused Run system.
Extract the agent installer file ISAGNTJ5STD*.zip into the Netweaver CCMS directory, usually: :\usr\sap\ccms.
Upon extracting you will find wily directory in the :\usr\sap\ccms directory
Configuring Introscope Agent Settings
For a SAP JAVA System the agent configuration settings are found by default in the file :\usr\sap\ccms\wily\core\config\IntroscopeAgent.profile.
To configure the Introscope Agent you need to locate the following parameter and set the values.
1. introscope.agent.enterprisemanager.transport.tcp.host.DEFAULT = <IP address or hostname of the Enterprise Manager
2. introscope.agent.enterprisemanager.transport.tcp.port.DEFAULT = <port on which the Enterprise Manager listens for Agent connection. Default is 6001>
3. introscope.autoprobe.directivesFile = < DEFAULT is sap_typical.jar,sap_ep.jar,sap_ep_iviews.jar,sap_xi_typical.jar > . You may need to add further duirective jar files by adding entries to the property, separated by comma.
Below table shows the various directive file names for various java application types.
sap_typical.jar
Main instrumentation set for SAP Netweaver. Includes support for generic Netweaver functionality, like database, JCO, Web Services. This jar is always mandatory.
sap_sapvm.jar
For SAP Netweaver 7.10 and higher with JDK5 or higher. Specific instrumentation, e.g. memory allocation. Do not activate for Java 1.4!
sap_bo_enterprise.jar
SAP Business Objects Enterprise 3.x instrumentation
sap_boe_webapp.jar
SAP Business Objects Enterprise 4.x instrumentation
sap_ep.jar
SAP Portal specific instrumentation
sap_ep_iviews.jar
AP Portal instrumentation: One node per iView – should be preferred for installations with many roles or when collaboration rooms are used. Requires sap_ep.jar
sap_ep_iviews_rolename.jar
Re-activate metrics for each iView/rolename combination. Activate only one of these 2: sap_ep_iviews.jar or sap_ep_iviews_rolename.jar!
sap_duet.jar
SAP Duet specific instrumentation
sap_hybris.jar
Instrumentation for Hybris.
sap_smp.jar
Instrumentation for SAP Mobile Platform.
sap_omnichannelbanking.jar
SMP instrumentation extension for Omni Channel Banking
sap_xi_typical.jar
Default and mandatory instrumentation file for PI
sap_xi_adapters.jar
Extended instrumentation for PI adapters.
sap_xi_passport.jar
Extended PI instrumentation to detect passport propagation.
sap_xi_full.jar
Extended instrumentation for PI. Some of these metrics might have a performance impact
sap_smd.jar
Solution Manager self-monitoring
sap_mdm.jar
SAP Master Data Management
sap_compliance.jar
SAP Compliance (SAP GRC, SAP EC, SAP REACH, …)
sap_epm.jar
SAP EPM (SAP SSM, …) instrumentation
sap_retail.jar
SAP Retail (SAP POS, SAP Triversity…)
sap_hilo.jar
SAP Visual Intelligence instrumentation
sap_srm_crm.jar
SAP SRM & SAP CRM (SAP Convergent Charging, SAG Frictionless e-Commerce, …)
sap_manufacturing.jar
SAP Manufacturing (SAP SAP Manufacturing Execution, SAP xMII, …)
Sap_hadoop.jar
SAP Hadoop instrumentation
sap_partner.jar
Instrumentation for SAP partner products. See SAP Note 1852015.
sap_tomcat_typical.jar
Default and mandatory instrumentation file for Apache Tomcat
sap_tomcat_full.jar
Extended instrumentation for Apache Tomcat
sap_websphere_typical.jar
Default and mandatory instrumentation file for IBM WebSphere Application Servers
sap_websphere_full.jar
Extended instrumentation for IBM WebSphere Application Servers
sap_weblogic_typical.jar
Default and mandatory instrumentation file for Oracle WebLogic Server
sap_cem_integration.jar
Instrumentation for integration with CA product CEM (only for SED)
Activating the Agent: Set Java VM Parameters
You have to add Java VM options to enable the agent. Typically, you will only want to activate the agent on the SAP J2EE server nodes, not on dispatchers.
You need to set the following parameters for the Java VM.
Run the SAP J2EE Configtool.
Navigate to Instance/VM Parameters/System and enter the following new parameters
3. Navigate to Instance/VM Parameters/Additional and enter the following new java parameter
-javaagent:/usr/sap/ccms/wily/Agent.jar
4. Save and Repeat steps 1 to 3 for all instances of the SAP JAVA system.
5. Restart the SAP instances.
To verify that Config tool changes were made, open the file: :\usr\sap\\\j2ee\cluster\instance.properties and check for a line beginning with ID.JavaParameters, and see if it contains the lines you entered in the step above.
Configuring Wily Enterprise Manager for monitoring in SAP Focused Run
Configuring Wily Enterprise Manager for monitoring in SAP Focused Run
The BCI adapters send the monitoring data to the central Wily EM . The Wily EM then sends the monitoring data to Focused Run System
Configuring Wily Enterprise Manager (Wily EM) for monitoring in SAP Focused Run is required if you monitor following types of systems where many monitoring metrics data is collected by BCI adapters.
SAP Netweaver AS Java
SAP BusinessObjects Business Intelligence
BOE Web Application Server
SAP Data Services
Apache Tomcat
SAP Archiving and Document Access (ADA) by OpenText for Tomcat
SAP Invoice Management (IM) for OCR Option by OpenText
SAP Convergent Charging
SAP Mobile Platform
SAP Hybris Commerce Suite
Unlike SAP Solution Manager, no Wily EM is required for monitoring in Focused Run if none of the managed systems use BCI adapters for their monitoring.
For connecting to a SAP Focused Run System the Wily EM installation should be of version 10.5 or higher and the EM Management Module (MM) Packages shall have minimum version MM 10.5 SP02 Patch 0 or higher.
Note: You can have only one Wily EM per customer network, however, if you install an Enterprise Manager Cluster, you can install any number of Enterprise Manager Collector Instances in the same Customer Network.
You can follow SAP Note 797147 for instructions on how to install Wily EM.
Prerequisite for Wily EM
The only prerequisite for connecting a Wily EM to a Focused Run system is that you should have installed host agent on the host of the Wily EM and have configured outside discovery of the host agent to connect to the Focused Run system.
To configure outside discovery of the host agent execute the following command:
Execute the below script from /usr/sap/hostctrl/exe:
./saphostctrl -function ConfigureOutsideDiscovery -enable -sldusername <FRUN LDDS or SLDR user> -sldpassword xxxxxxxxxx -sldhost <FRUN host or SLDR host> -sldport <FRUN or SLDR port>
Configuring the Wily EM
To connect the Wily EM to the Focused Run system perform the following steps.
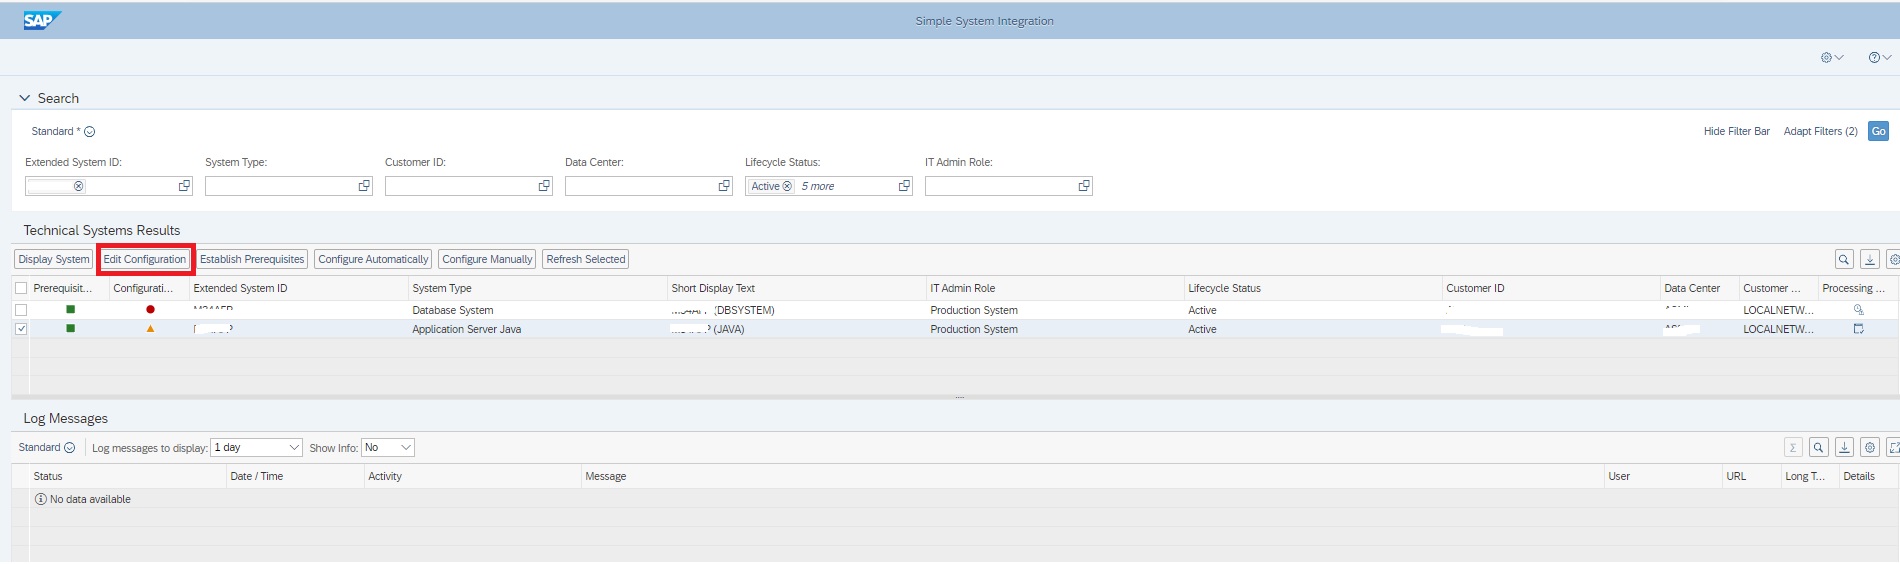
For executing SSI navigate to the SSI app in the Infrastructure Administration section of the Focused Run launchpad.
In the SSI app scope selection area you can enter the managed system extended SID individually or you can select a more generic filter to list multiple systems.
SSI is performed in 2 steps for JAVA managed systems.
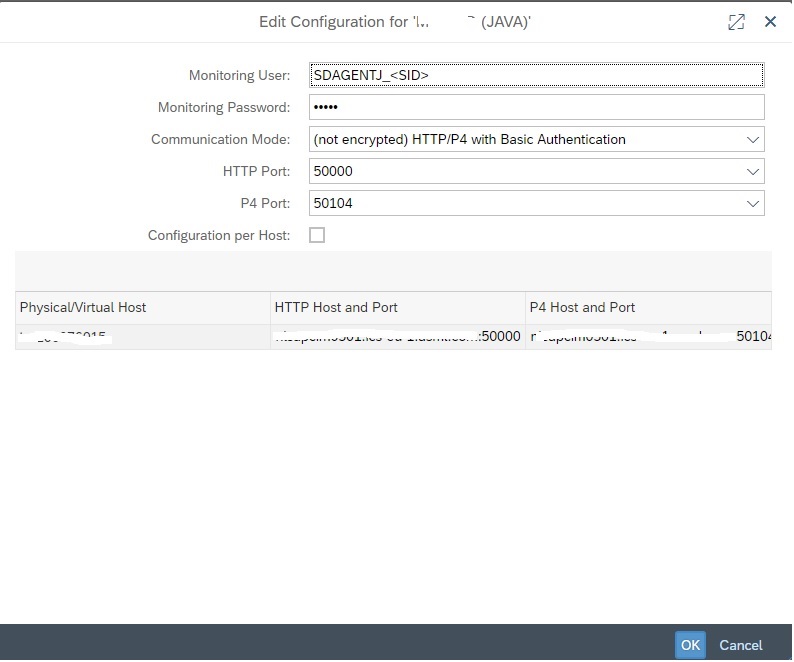
Step 1: Edit Configuration
In this step you provide the credentials for the SDA agent to connect to JAVA Managed System.
The FRUN User and password you created as a pre-requisite
The HTTP and P4 ports for connecting to the Java managed system.
Step 2: Configure Automatically
In this step, select the JAVA managed system for which you want to perform the SSI and click on the button Configure Automatically.
Note: When you perform SSI for the main technical system, it will automatically perform the SSI for all the underlying components in the system hierarchy. That is, if you perform SSI for Application Server JAVA, it will also perform the SSI for the system's database. However the if you perform first the SSI of the system's database it will not automatically perform the SSI of the main technical system and you will again have to perform the SSI for the technical system again separately.
Mass SSI and Mass Agent Update
Focused Run also provides even higher level of automation by allowing to perform SSI at a time for multiple systems.
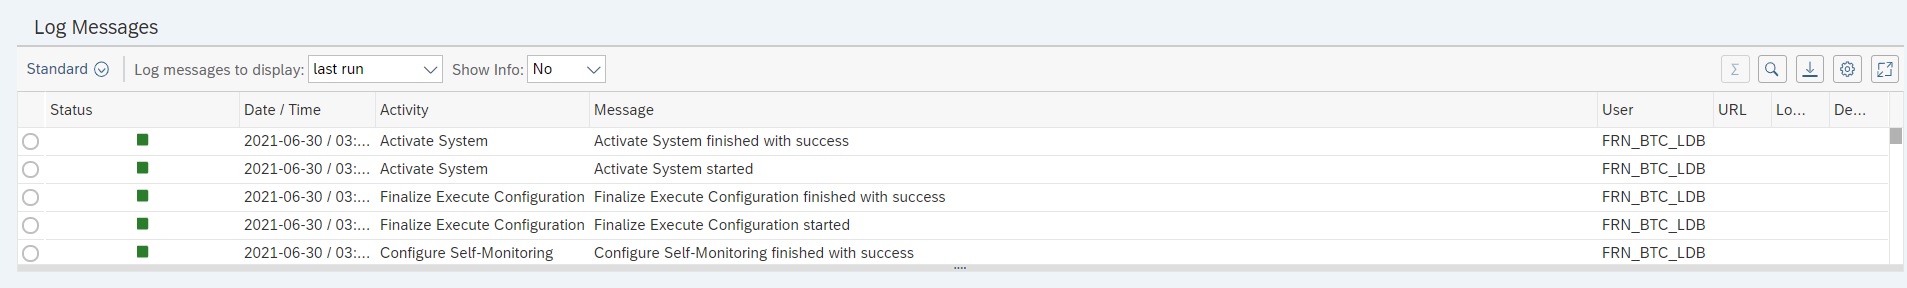
Once the SSI automatic activities finish, you can check the logs of the SSI automation steps in the Log Messages area.
SAP Focused Run also provides a mass agent update app in the Focused Run launchpad using which you can update SDAs in all connected hosts of a particular data center on a single go. This is specifically useful for updating the SDA’s for all hosts after SAP releases a new version of SDA.
You can access the Agent Mass Update app in the Infrastructure Administration section of Focused Run Launchpad.
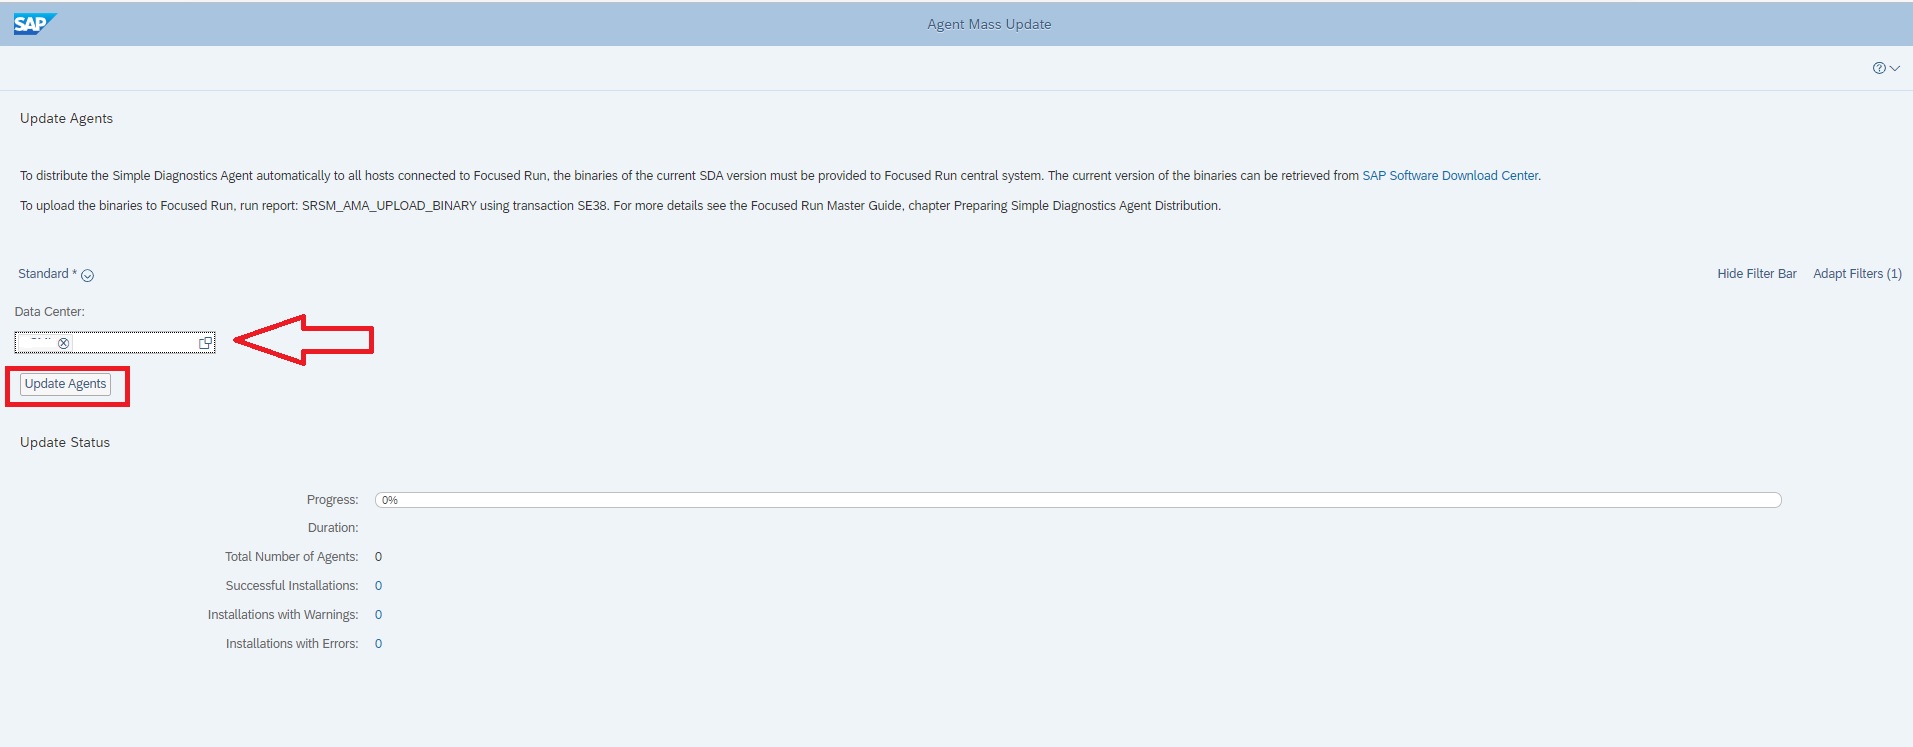
However before you use this app , you have to ensure that you have already uploaded the binaries as we have explained above.
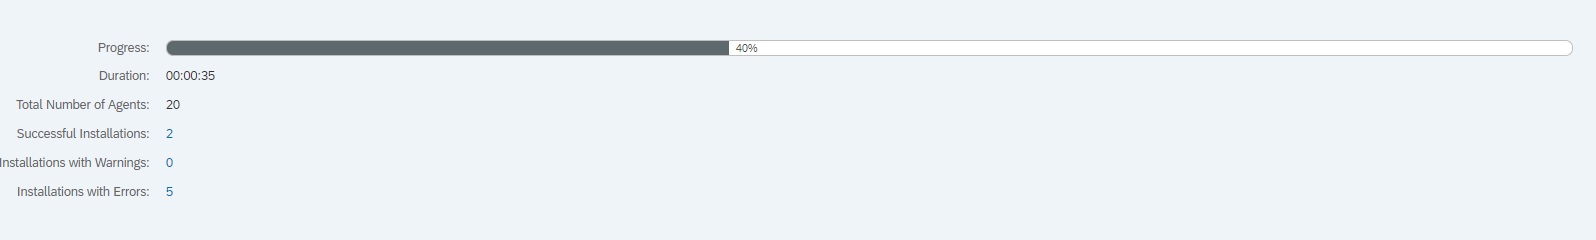
For updating the agent just open the app and select the Data Center for which you want to update the agents and click on Update agents to start the update.
After you start the update, you can monitor the progress with the progress bar where it also lists how many agent installations were successful and how many have failed.
Note: SAP normally releases a new version of SDA every 2 to 3 months. You can download the latest version of SDA from here.
Connecting Managed Systems to Multiple Focused Run Systems
You may need to connect the same managed system to more than one Focused Run System. For instance, connecting a sandbox managed system to a development Focused Run system for test purpose and to a production Focused Run system where it is actually monitored.
For connecting the same system to one more Focused Run system you basically need to perform the same steps again but this time targeting to the new Focused Run systems.
Perform host outside discovery to register the host on focused run system. Execute the following commands using the credentials of the new focused run system to which you want to connect the managed system.
On the new Focused Run system agent administration configure the agent on the host you registered in previous step..
Install/Update Agent
2. Configure Agent
Note: The agent installation will not deploy a new SDI binary to the hostagent in this case as there is already a SDI in the host agent coming from the previous Focused Run system. However the installation step will simply link the new Focused Run system to the existing SDI by pushing its new configuration XML file to the SDI. This you can check by logging on to agent internals.
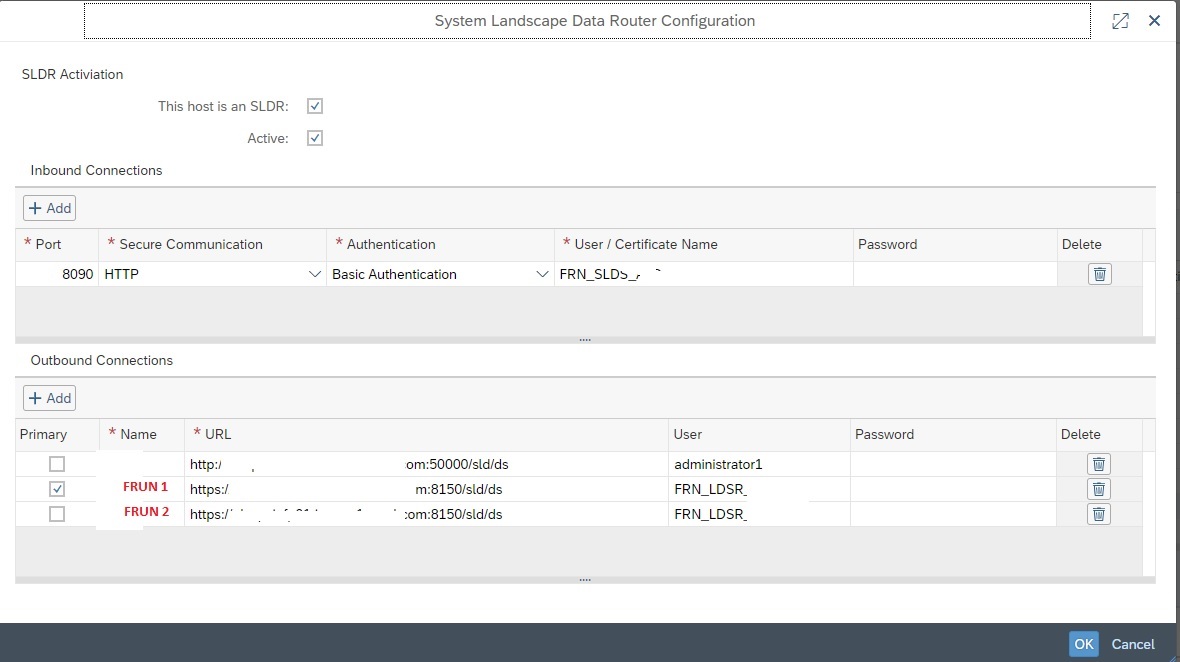
Configure SLDR to send data to both Focused Run Systems. This the most important step that you do differently than connecting the managed system to the first Focused run system. This will ensure data suppliers from managed system get forwarded to both Focused Run systems. Two know more about SLDR setup you can follow the SAP documentation here.
Now update the data supplier settings of the managed system to send data to this SLDR .( For example RZ70 in SAP ABAP system and NWA in SAP JAVA system).
Now the managed system will be listed in the Simple System Integration app of the new Focused Run system. Configure the SSI of the managed system to enable the managed system in the new Focused Run systems monitoring.
Decommissioning Managed Systems
We need to perform decommissioning of a managed system if
1. The managed system itself has been decommissioned or
2. The managed system is not required to be monitored in the Focused Run system anymore.
Case 1: Managed System is Decommissioned
Step 1: The first step of decommissioning would be to disconnect the Simple Diagnostic Agent from the Focused Run system. For this you can directly uninstall the Host Agent.
You can uninstall by running the following command at OS level
UNIX, IBM i: ./saphostexec -uninstall
Windows: saphostexec.exe -uninstall
Step 2: Deactivate all monitoring for managed system in Focused Run system
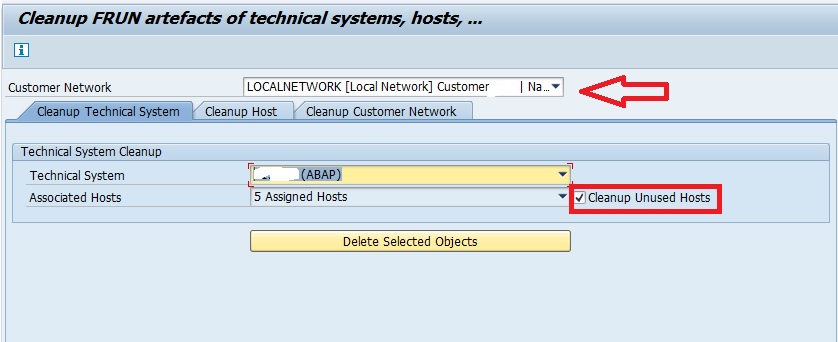
For this in transaction SA38 execute report RSRSM_SSI_CLEANUP
Select a Customer Network
Go to the Cleanup Technical System tab
Select a Technical System
Select the option to Cleanup unused hosts
Press Delete Selected Objects
Case 2: Managed System is not required to be monitored in the Focused Run System
Step 1: You have to ensure the managed system is no more sending landscape data to the Focused Run system. For this disable all SLD data suppliers for the technical system. (In case of ABAP systems its in transaction RZ70 and in case of Java systems its the Data Supplier settings in the NWA.)
Step 2: Disable outside discovery for all hosts of the technical system by executing the following command.
UNIX, IBM i: ./saphostctrl -function ConfigureOutsideDiscovery -disable
Step 3: Execute the decommissioning report RSRSM_SSI_CLEANUP as mentioned in step 2 of case 1.
For further details you can refer to SAP documentation here.
In addition to the above two cases, you might need to decommission system if the system is being migrated or upgraded to a different or higher version. For example migrating a standard ECC system to S4HANA. Instead of adjusting the monitoring of existing system, you decommission the system and then reconnect the system to Focused Run system. In our future blog we will explain how to decommission in such cases.
Agent Log Configuration – enabling debugging for troubleshooting
In case of data collection issues you will need to troubleshoot Simple Diagnostic agent logs .
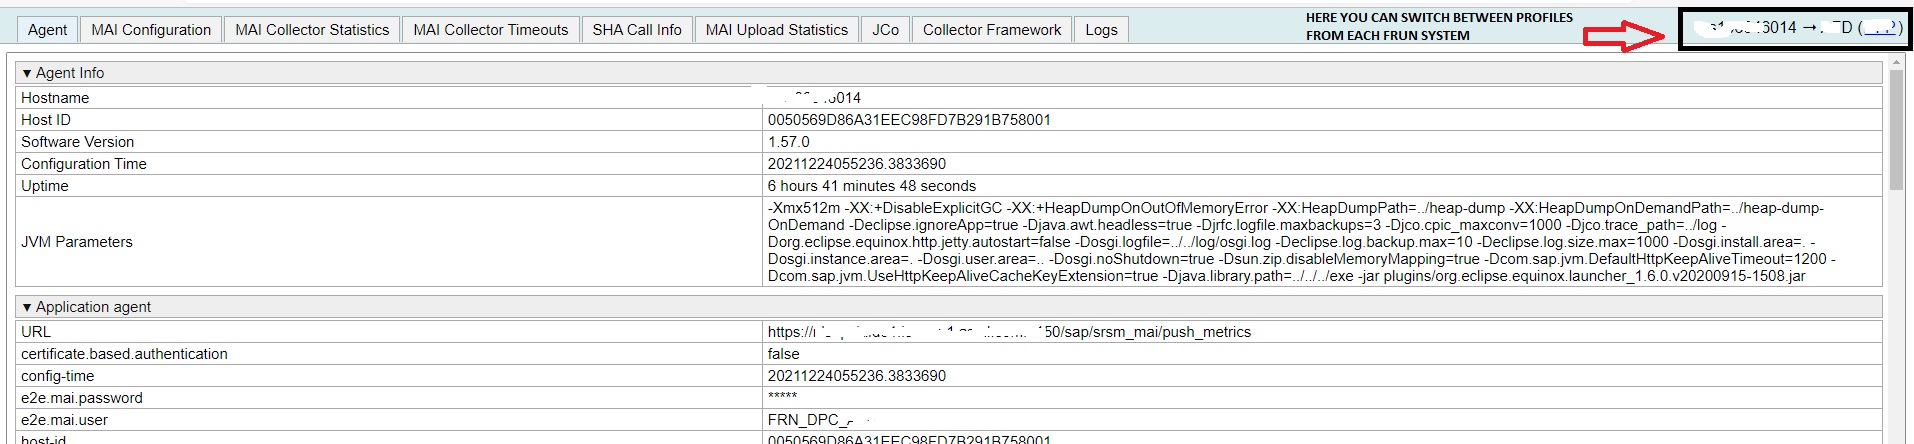
In some cases you might need to get further details after you see an error message in the standard SDA logs in Agent Internals. In such cases you will need to enable application specific logging. E.g. activate debug logging in order to analyze issues with a specific application or component of the SDA
For E.g.: You saw an error in agent internals like
2019-08-15 15:48:01,696 ERROR [MAI FRD 5] com.sap.solman.agent.mai.http.WebDispGetServerListCollector com.sap.solman.agent.mai.cim.EvaluationException: division by zero at com.sap.solman.agent.mai.cim.ExpressionEvaluator.evaluate(ExpressionEvaluator.java:72)
In this case, you will want to put to debug this class: com.sap.solman.agent.mai
Following Application components of SDA for which logging can be enabled.
Application / Component
Name (Column in Log Configuration Dialog)
JCo
com.sap.solman.agent.conn.jco
MAI
com.sap.solman.agent.mai
SDA Core
com.sap.solman.agent.core
SSL
com.sap.solman.agent.core
SLDR
com.sap.solman.agent.sldr
To enable logging you can follow the following steps.
Step 1 : Open Agent Administration
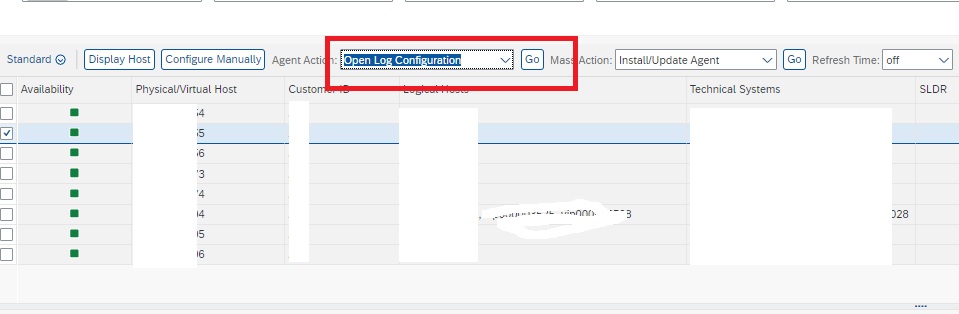
Step 2: Select the agent/host for which you want to enable logs in Debug, on the option Agent Action select “Open Log Configuration” and click on Go.
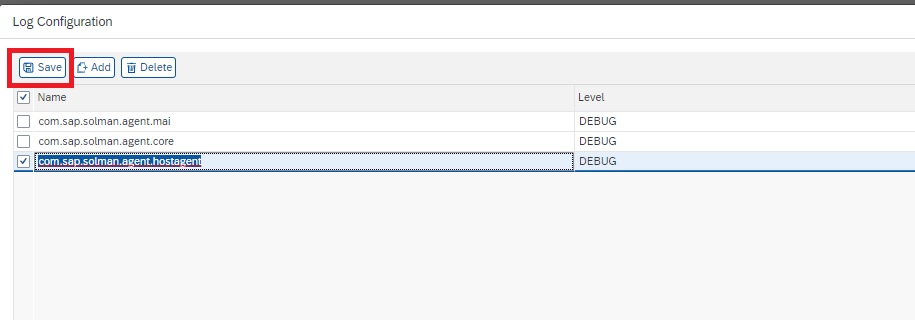
In the next dialog screen enter the application classes for which you want to enable debug as shown below. After entering the classes click on Save.
In the next execution, the Agent logs will present more details.
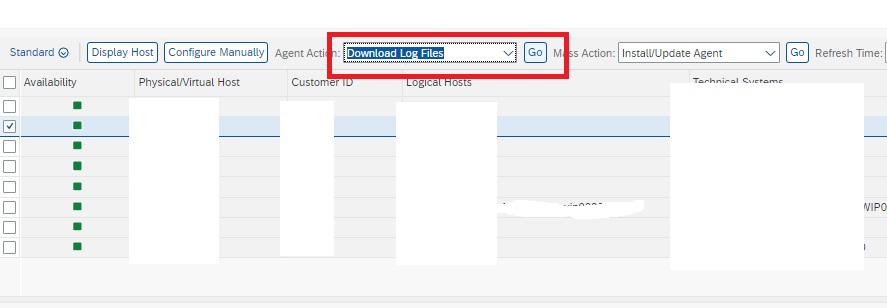
You can collect the log files by selecting the Option Download Log File and then click on Go. It will download all SDA logs in a zip file to your desktop/laptop.
Note: Do not forget to remove the log configurations after downloading the logfiles.
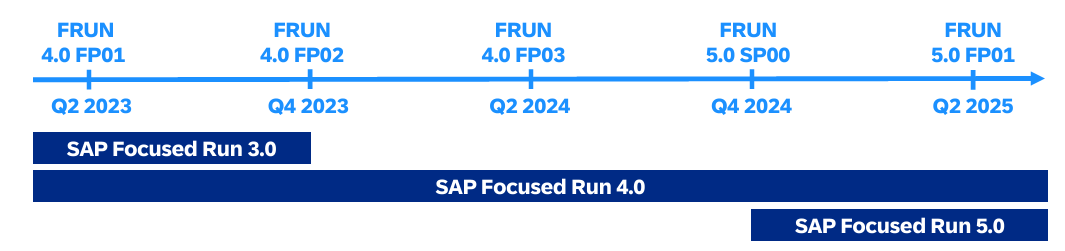
All new functions and innovations for SAP Focused Run are delivered in either upgrades or feature packs. This blog will explain how to plan and execute upgrade for SAP Focused Run.
Needed versions of the SDA (simple diagnostics agent)
Scenario specific pre and post actions required
Updates to authorizations in SAP Focused Run
Updates to authorizations in the connected systems
Pre upgrade and post upgrade actions to be performed
The HANA database can be upgraded before the actual upgrade or can be combined with the upgrade. The same applies for the SDA agent.
Best practice is to execute the HANA and SDA upgrades before. Upgrade your Focused Run test system first, leave the versions there for a few weeks to prove stability, then deploy on productive Focused Run system.
In case of changes to authorizations in the connected systems, you can already update these before the upgrade.
Start your upgrade first on your SAP Focused Run development system and write down all the steps you execute. You will need to repeat all steps in your productive system later on.
During the technical upgrade, you will have to perform with the SUM tool, you will need to execute the SPDD and SPAU technical upgrade actions. Store the actions in transport to be used in productive upgrade. After SPUA is done, also apply the updated collective notes listed in the central note 3374888 – Release Information Note for SAP Focused Run 4.0 FP02.
After the technical upgrade has been completed, follow and document carefully all the steps in the OSS upgrade note. For example running extra tasks lists, programs, redo SSI for JAVA, etc.
It can also be you come across items and issues that are not documented in the OSS note. Please write them down in your own runbook for production. When upgrading to SAP Focused Run 3.0 we found that the standard jobs are switched to the technical job repository SJOBREPO (since the 3.0 ABAP stack is based on the S4HANA 1909 version).
Apply all collective notes for all functions you are using. The collective note numbers are listed in the Release Information Note.
After the documented steps, update the authorizations in SAP Focused Run to get the new tiles for new functions available.
Rerun the task lists for the initial setup in STC01 (SAP_FRUN_SETUP_FOUNDATION and SAP_FRUN_SETUP_USECASE) with the variants of the use cases that you are using.
Before deploying the Focused Run upgrade in production, you must test all your functions in the Focused Run development system. It is very helpful if you have a set of documented test cases that you can easily repeat each upgrade. With testing first focus on testing the current functions you are using. In a later stage you can explore, activate and test new functions.
While testing you will find issues. Solutions are normally:
Updates in authorizations
OSS notes to be applied
SICF services and Gateway services activation
Forgotten step in the activation
Capture all fixes in either transports or in your runbook.
If you still have key issues with bugs, you will need to raise a message to SAP.
<< This blog was originally posted on SAP Focused Run Guru by Frank Umans. Repost done with permission. >>
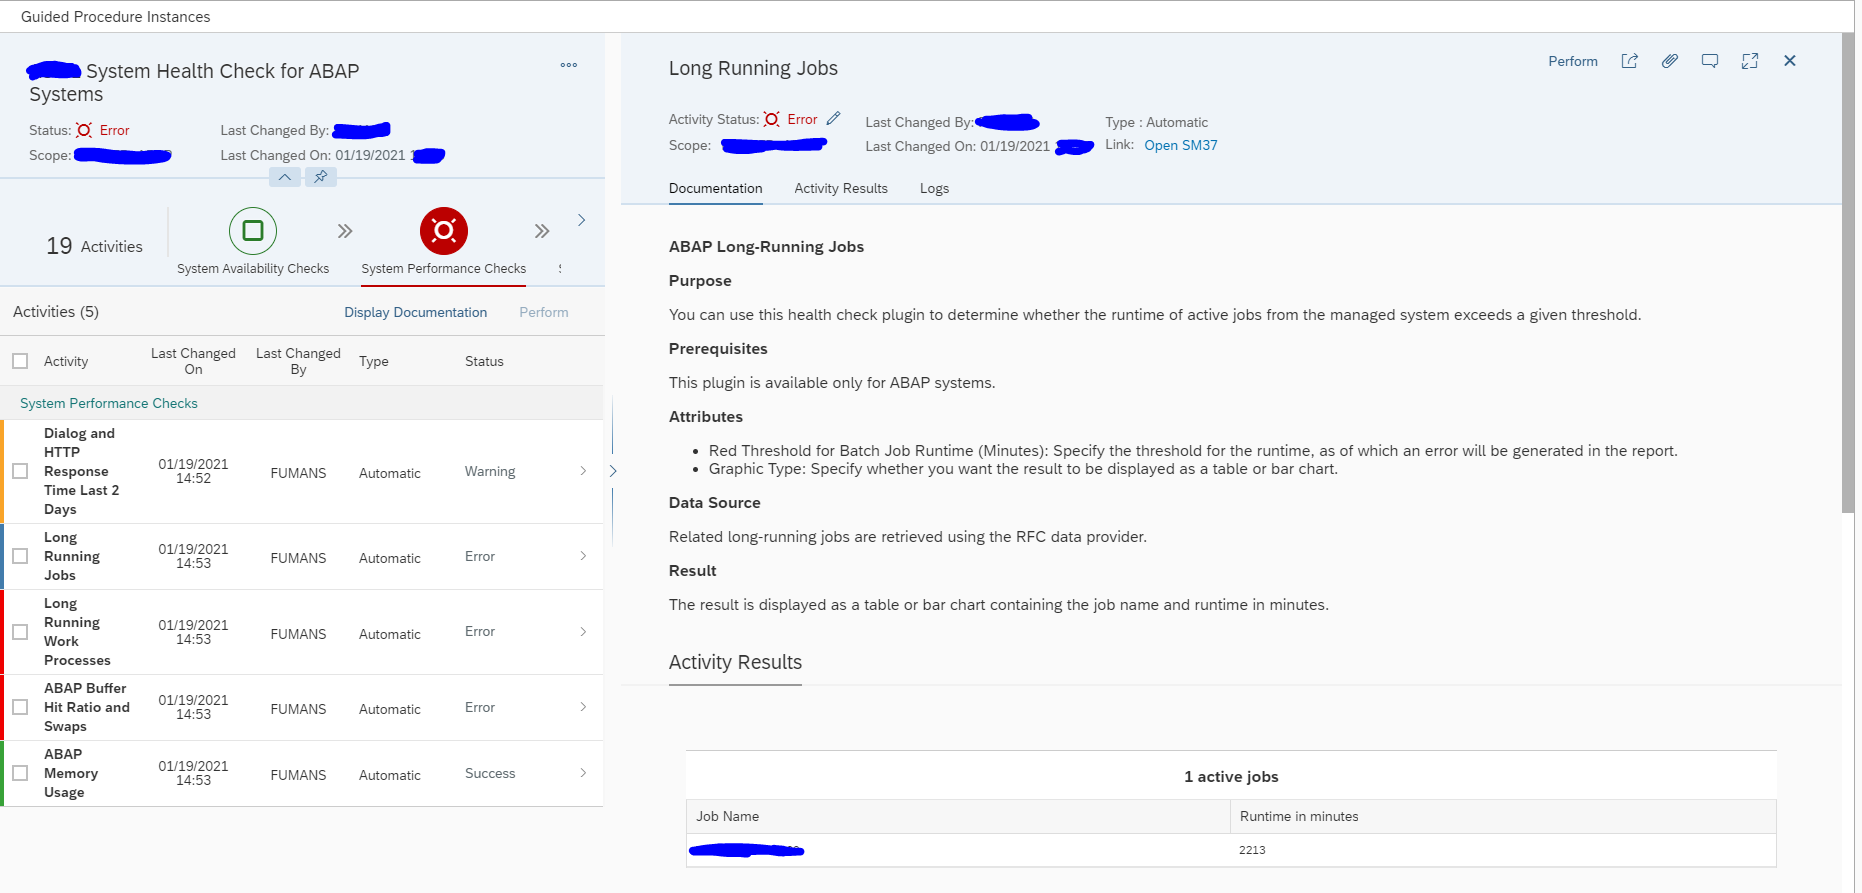
The goal of the ABAP health check guided procedure is to structurally check the health of an ABAP system.
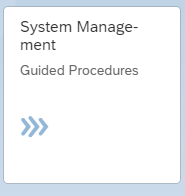
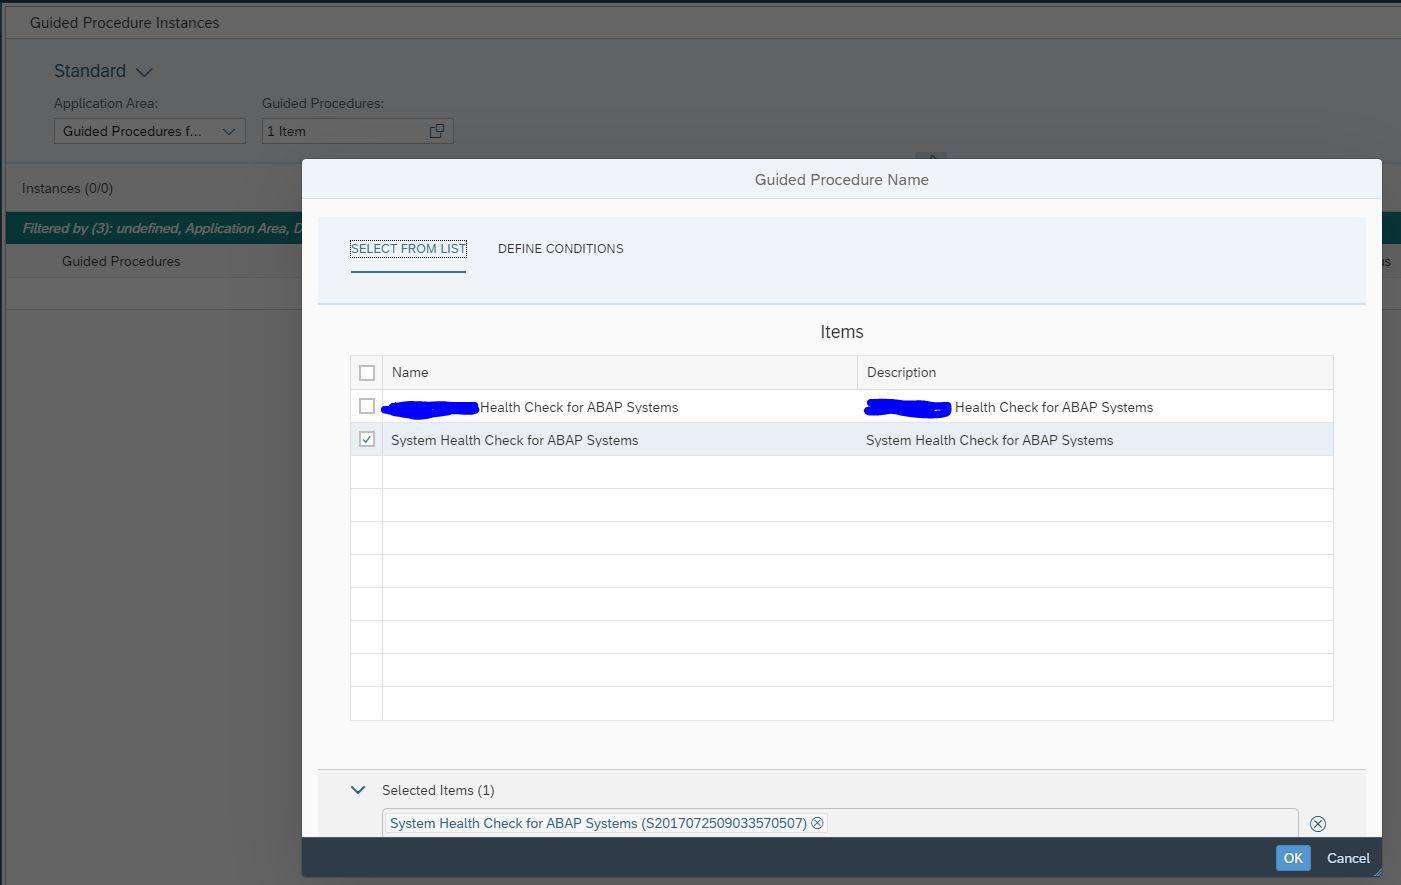
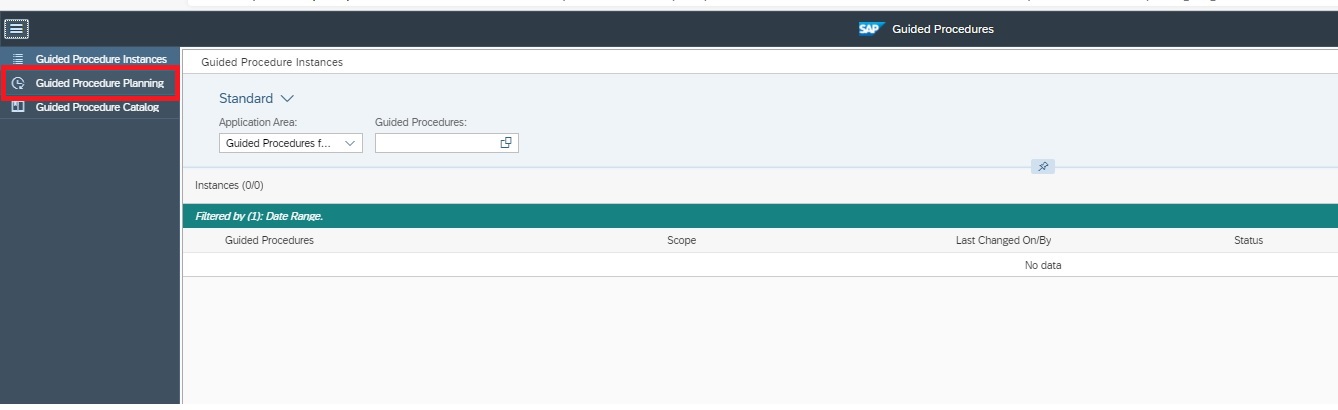
To start the guided procedure for system health check, open the Guided Procedures Fiori tile:
Now select from the guided procedure for advanced system monitoring the System health check for ABAP systems:
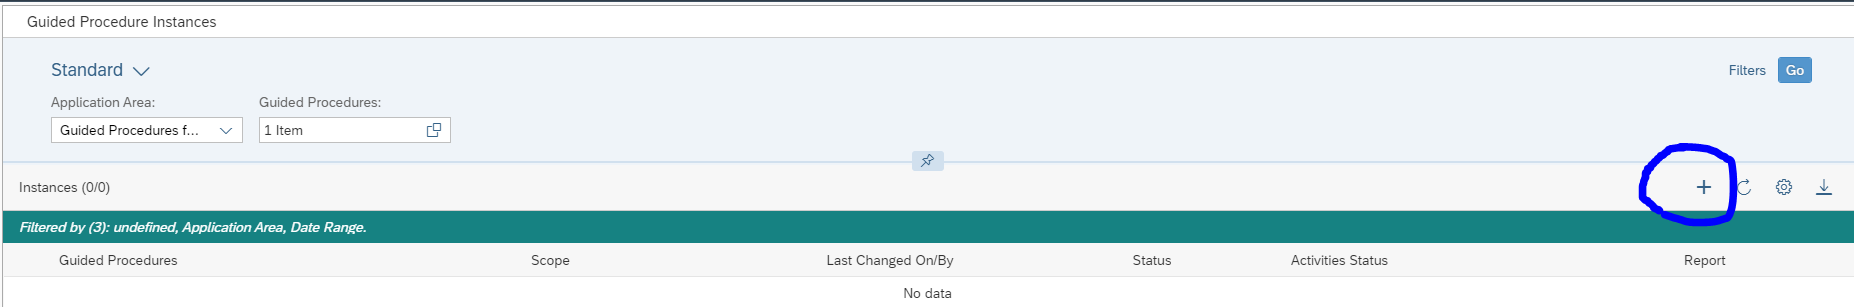
Select the Plus icon to execute a new guided procedure:
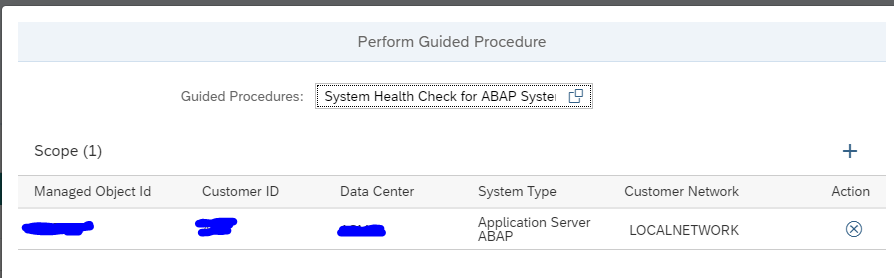
Add the scope of systems to the guided procedure:
Then press the Execute Manually button to start.
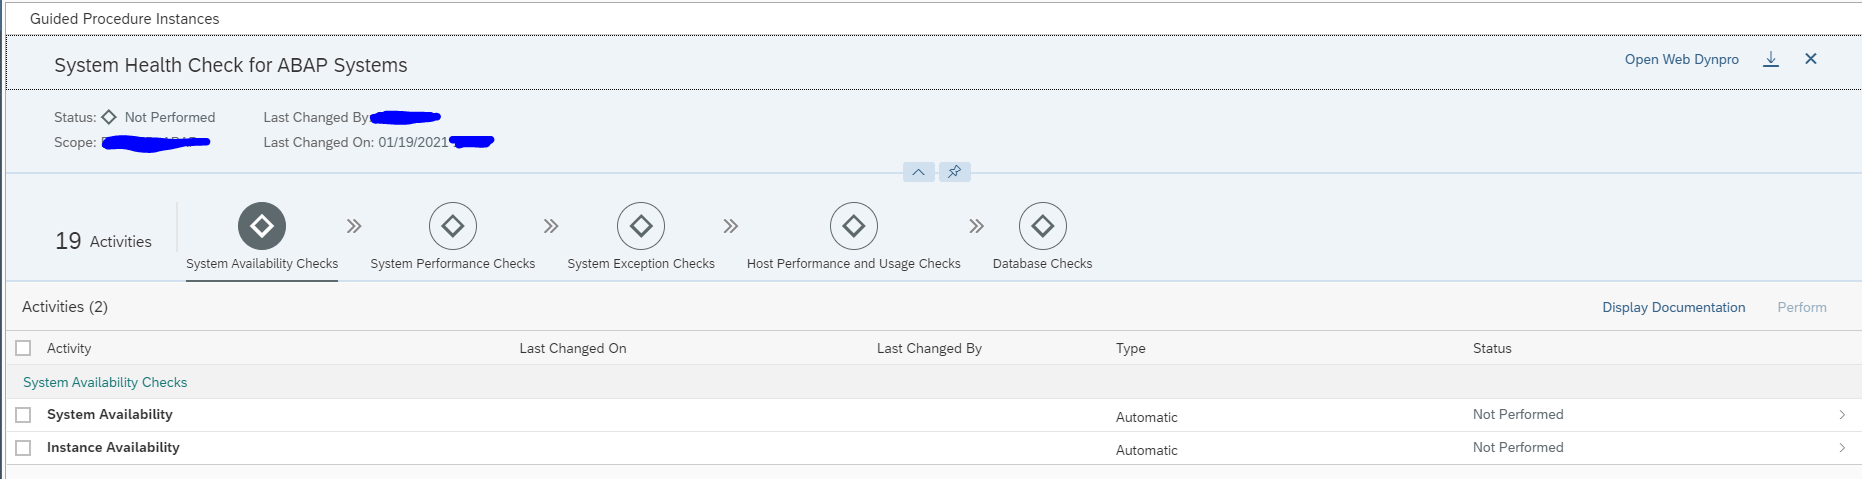
The guided road map will now open:
Select the checks and press Perform to execute the checks. After the checks are done, you can zoom in the detailed results:
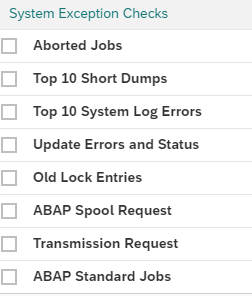
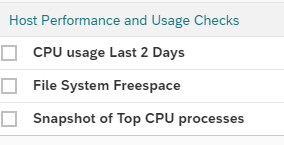
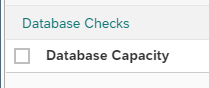
The next checks are shown below:
When to run this ABAP system health check guided procedure?
he ABAP system health check guided procedure can be run:
In case of reported system issues with performance: to quickly find potential root cause
For example monthly or quarterly to check how system is doing
You can also automate the guided procedure and run it on scheduled basis and mail the results to you. This you can for example setup for your primary ECC production system on daily basis.
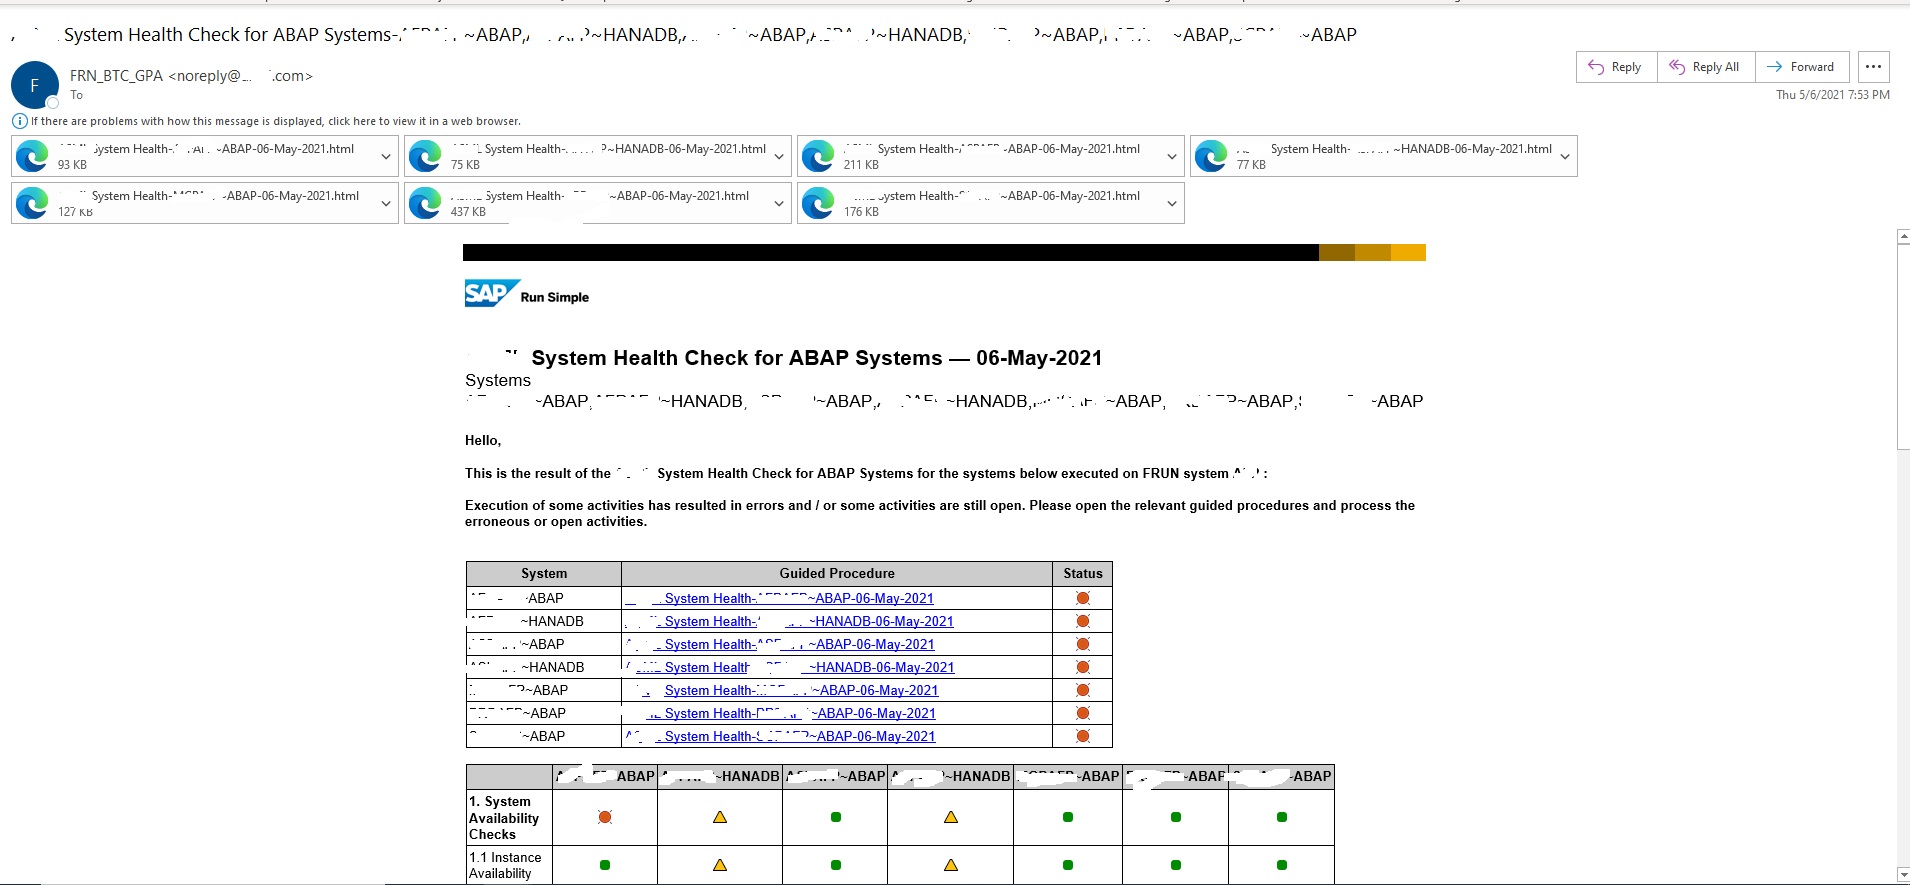
Automated scheduling of health checks including mail sending
SAP Focused Run provides a mechanism to periodically schedule automatic execution of guided procedures. With this you can optionally enable email notification. This way we can schedule periodic run of System Health Check guided procedure. From each automatic execution of the guided procedure, an email will be sent with the status of the system health check.
Scheduling Guided Procedures
In the Guided Procedures app navigation block click on Guided Procedure Planning.
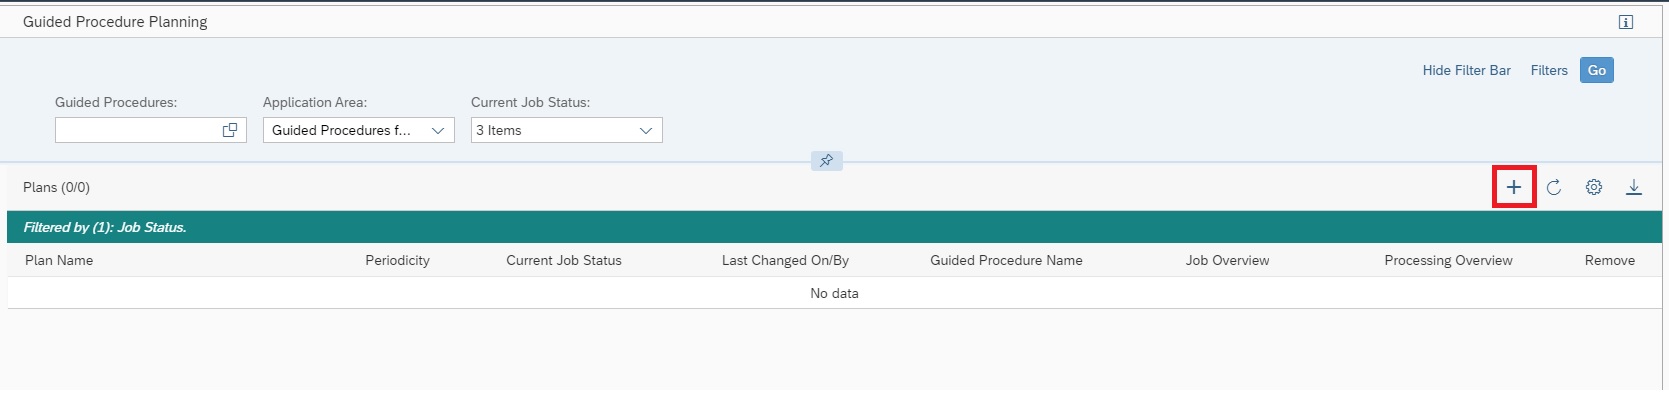
In the Guided Procedure Planning area, click on the “+” sign to create a new Plan and follow the steps to create a plan.
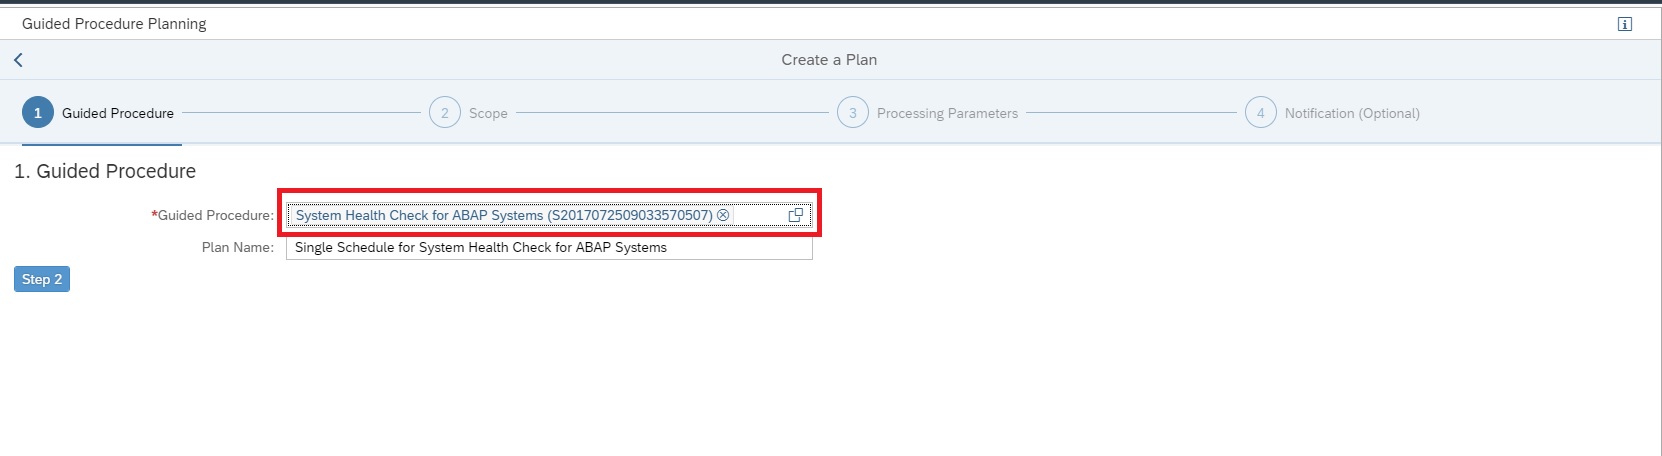
Step 1: Select guided procedure System Health Check for ABAP Systems.
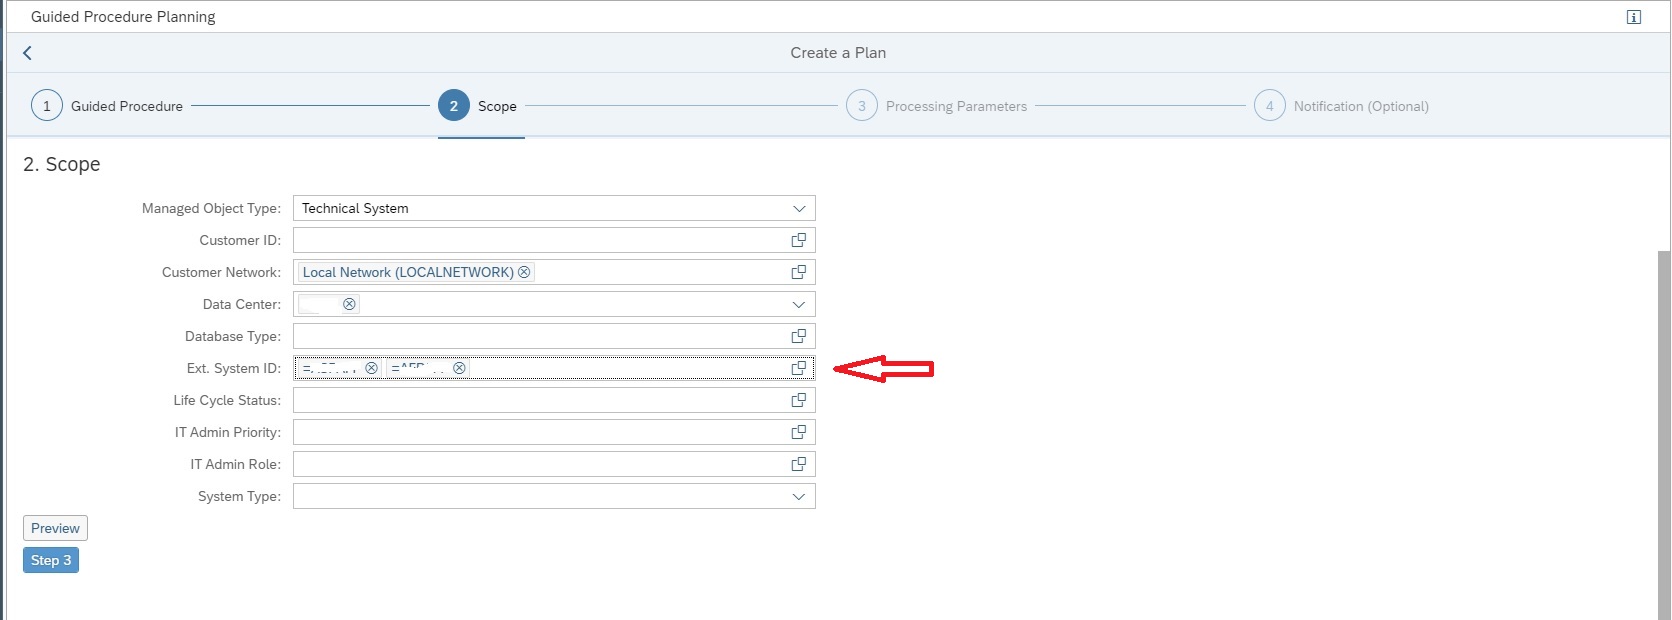
Step 2: Scope Selection: Select the systems (Ext. System ID) for which you want to run the system health check.
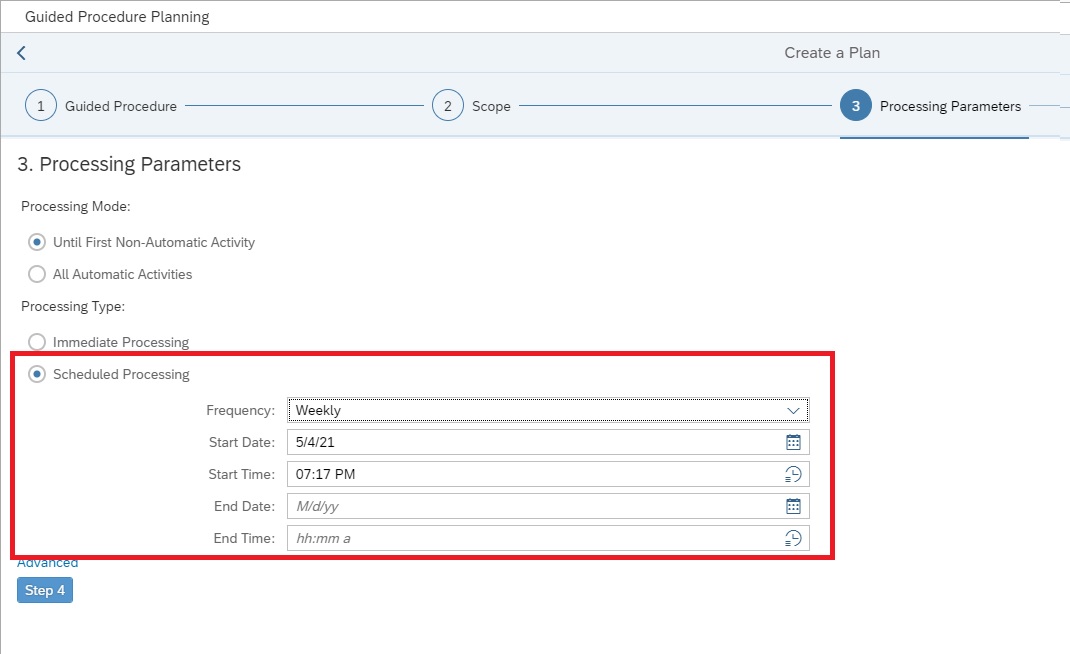
Step 3: Processing Parameters: Select for one time execution or periodic execution.
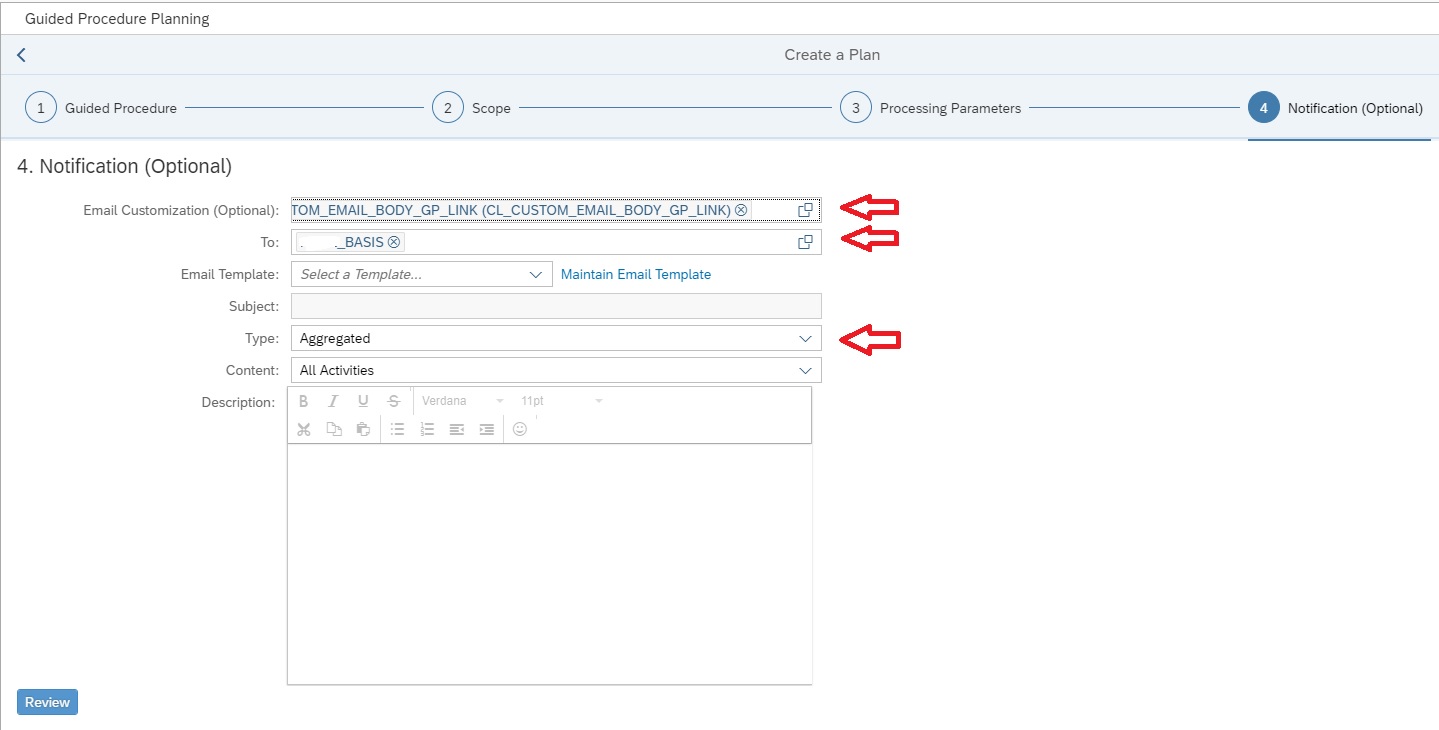
Step 4: Notification Settings: In this step provide the following details for setting up the email layout for sending the email notification for the guided procedure execution result.
Email Customization (Optional) : Select either of the two options available for this field. With this selection we use the pre-built/inbuilt SAP eMail template provided by SAP.
To: Provide the Recipient List to which you want to send the mail to (You can’t provide direct mail IDs here).
Type: Select Single or Aggregated. The single option sends individual mails for every single system selected in the scope whereas the Aggregated option send an aggregated mail including all systems selected in the scope.
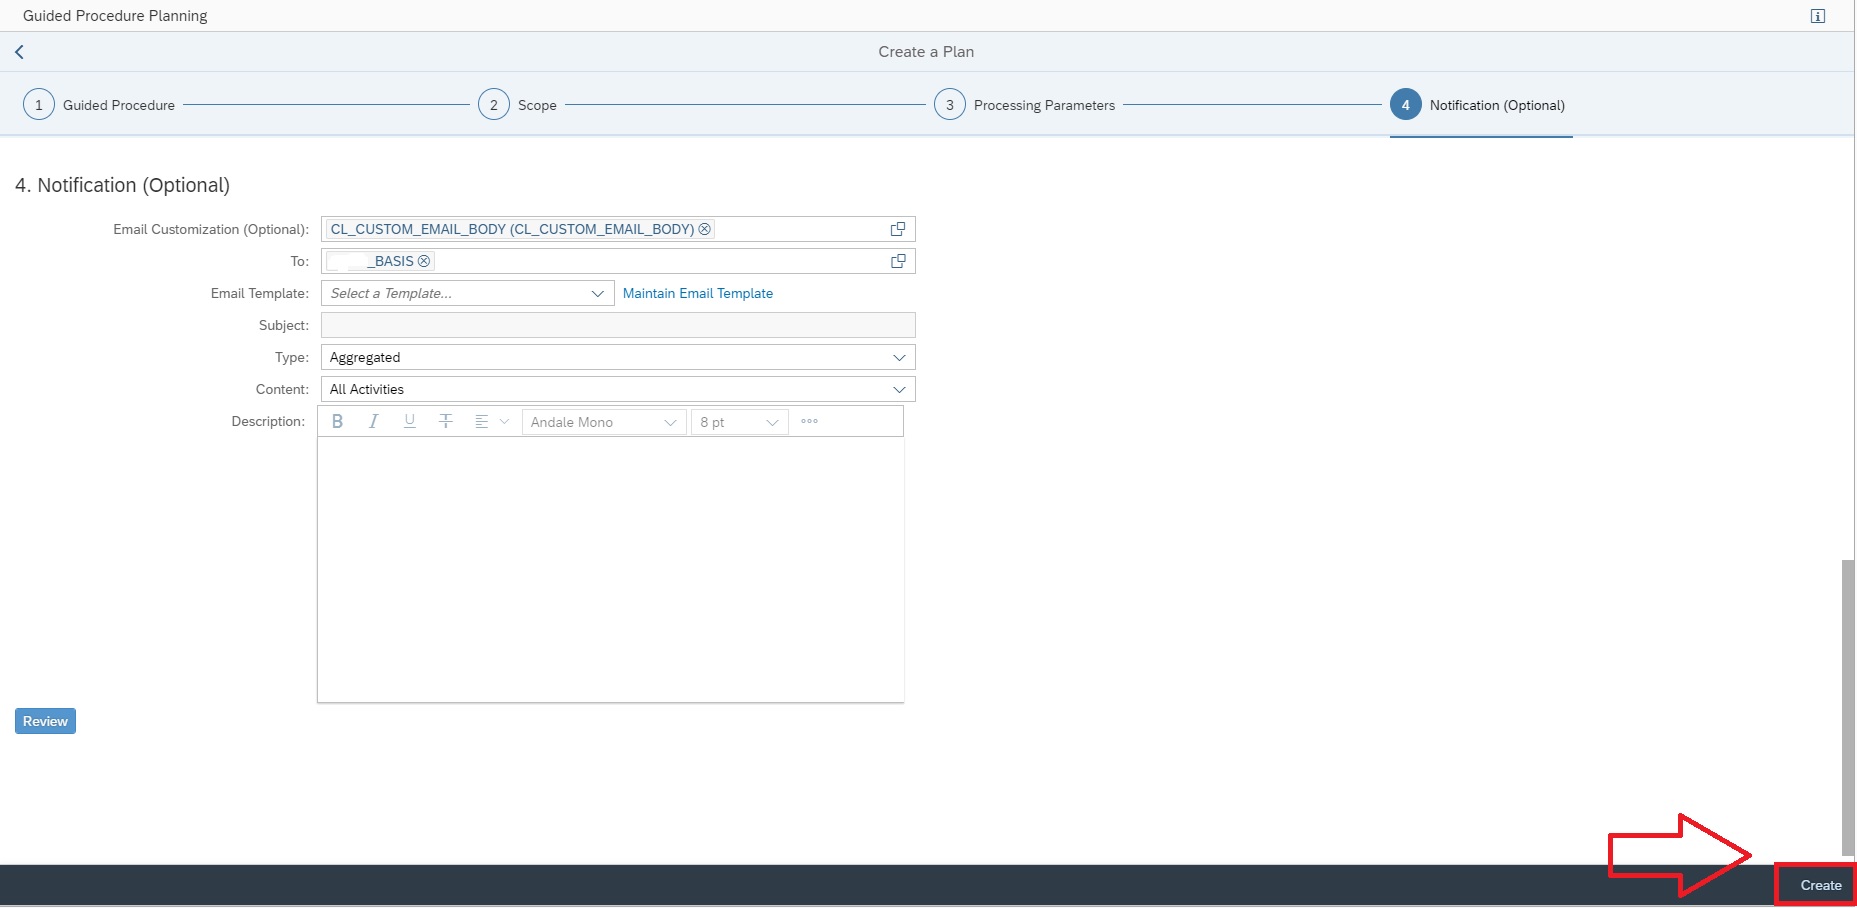
Finally you can click on the Create button as shown below to schedule your guided procedure.
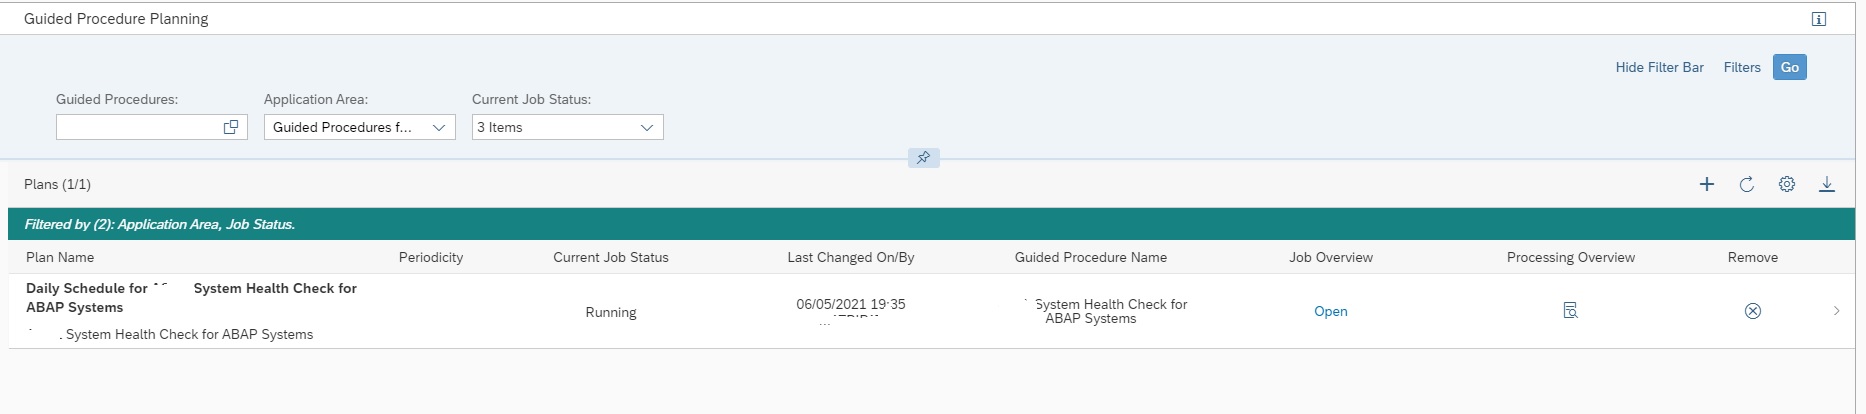
Once scheduled, you can navigate back to the Guided Procedure Planning home screen to see the list of scheduled guided procedures and their current execution status.
Below is sample email for your reference.
<< This blog was originally posted on SAP Focused Run Guru by Manas Tripathy (Simac) and Frank Umans. Repost done with permission. >>
With Focused Run a dashboarding framework is available called Operation Dashboard. This enhancement comes under the Advanced Analytics & Intelligence (AAI) functionality of Focused Run.
With Operation Dashboard you can configure a 3 level drilldown dashboard to track the current situation of monitoring and alerting in the areas of System Monitoring and Real User Monitoring.
Operation Dashboard provides 3 types of view to provide a consolidated view of the current status of monitoring and alerting.
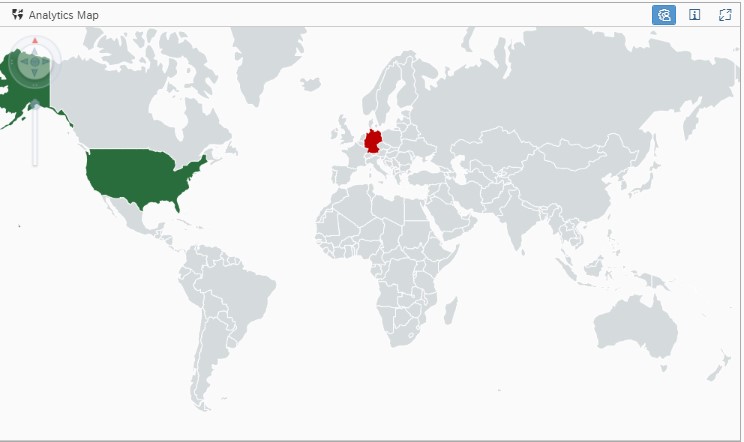
Analytics Map: Consolidate monitors to a specific region on the world map. The region is colour coded to the aggregated monitoring status of the monitors included. Aggregation uses worst case rule i.e The colour of the region is green only if all the involved monitors are in green.
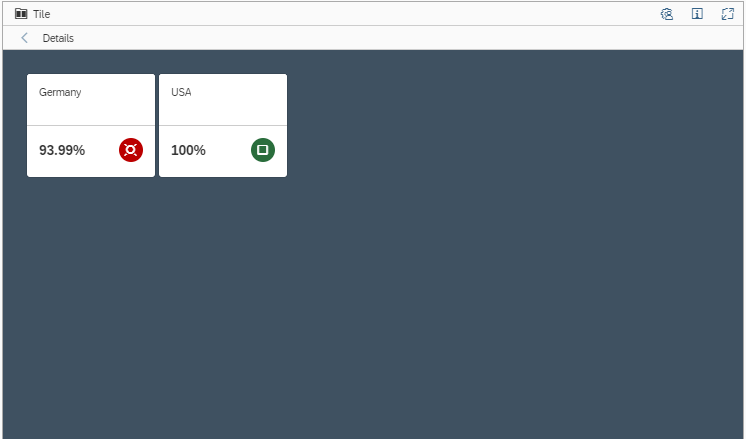
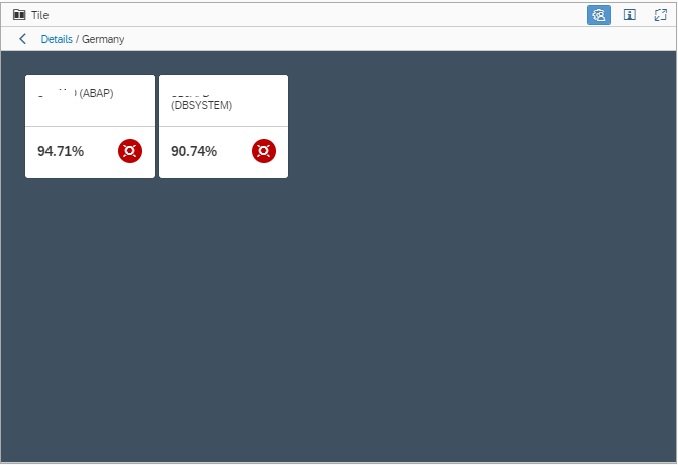
2. Tile View: Shows the consolidated monitoring status of a specific Scenario/System/Managed Object. Aggregation uses worst case rule.
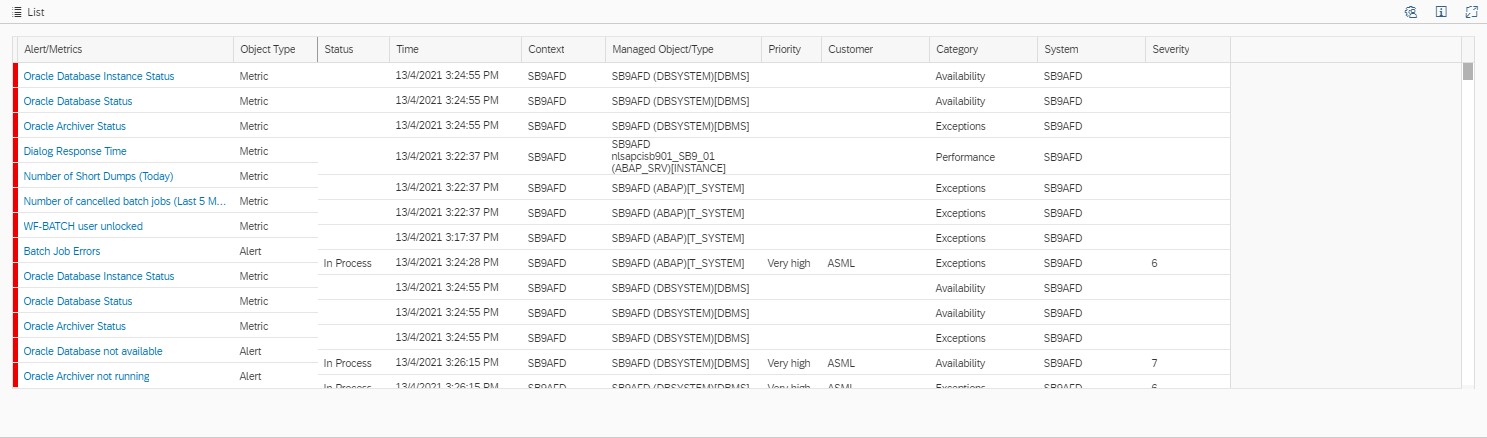
3. List Deatils View: Shows the list of involved monitors.
The above three views are linked automatically to eachother to enable the drill down functionality. That is, if you click on a perticular region which is rated in the world map view, you will get the correspoding systems/componenets for that region in the tiles view and the corresponding monitoring metrics in the list view.
Operation Dashboard Setup
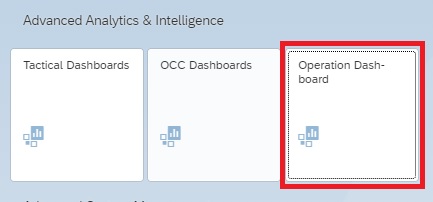
To access Operations Dashboards click on Operations Dasboard tile under Advanced Analytics & Intelligence section in the Focused Run Launchpad.
Step 1: Create a new Operation Dashboard
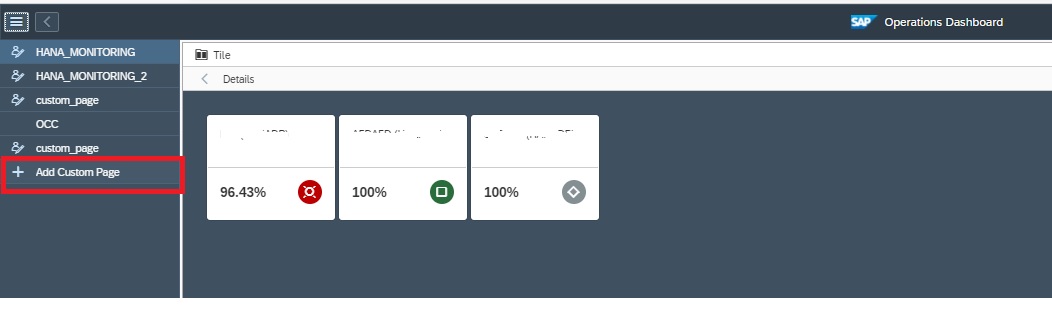
Create a new Operations Dashboard by clicking on Add Custom Page in the navigation pannel of Operations Dashboard app.
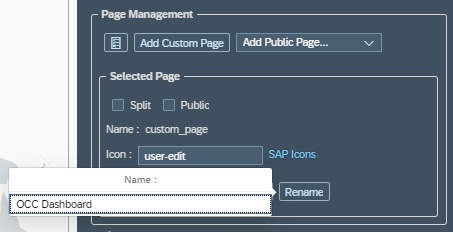
Step 2: Name your dashboard
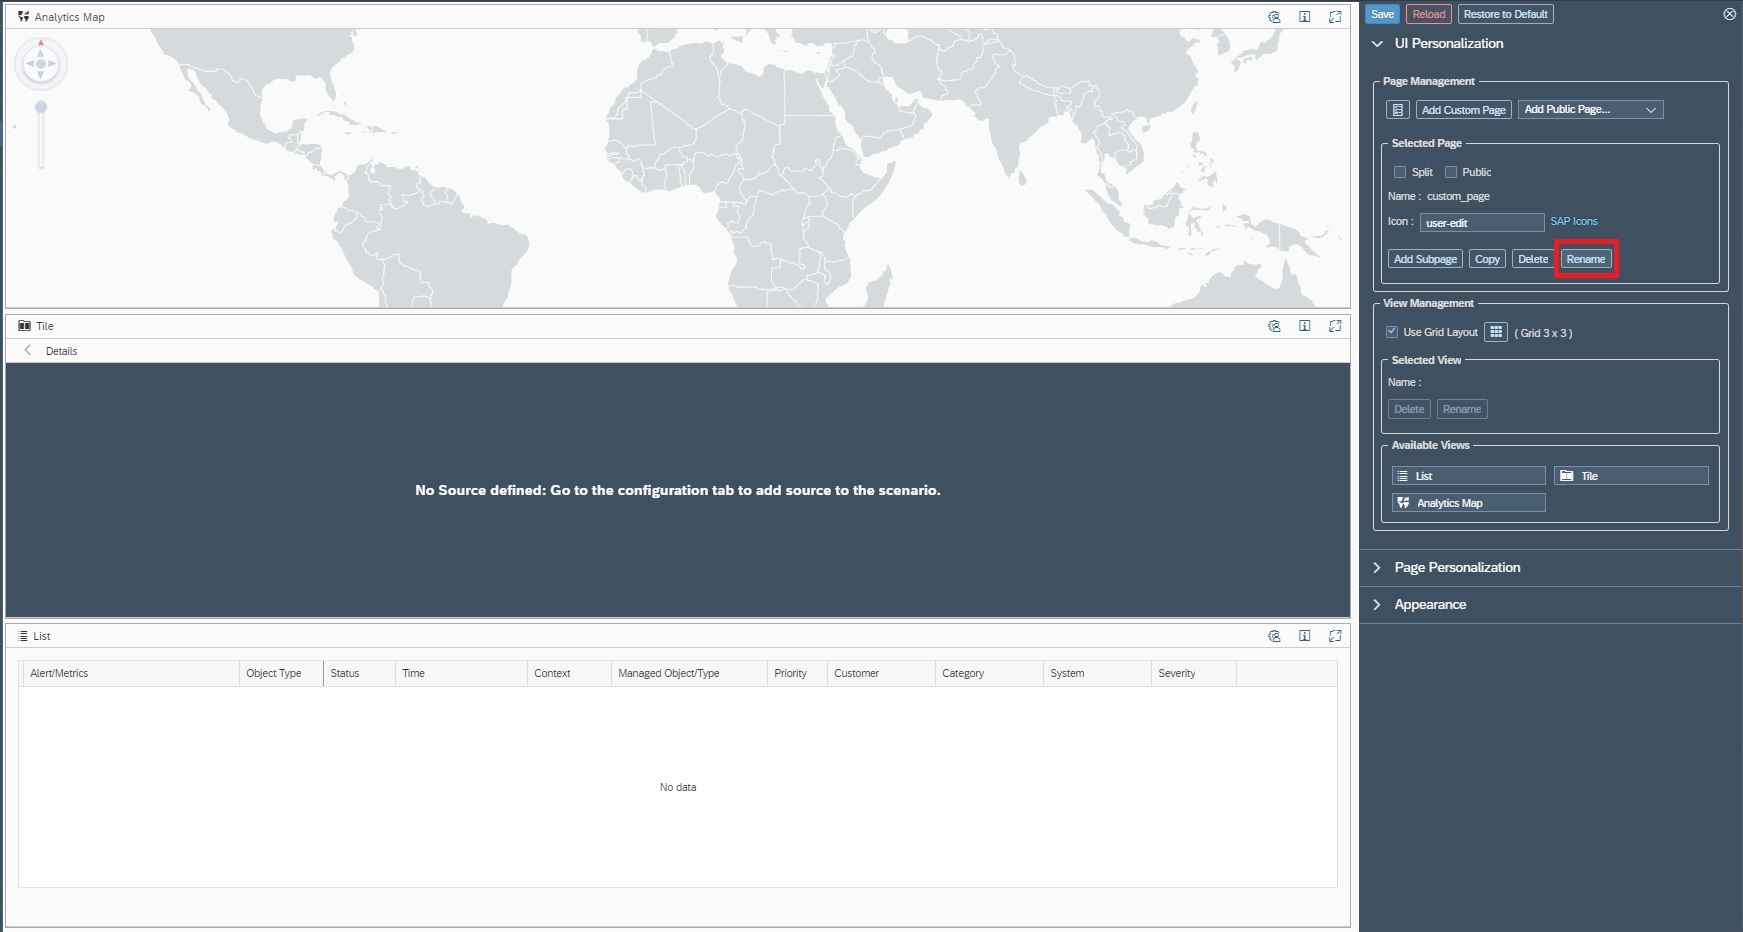
When you create a new dashboard, the dashboard setup are will appear on the right hand side of your screen. Click on the rename button as shown below.
Step3: Configure layout
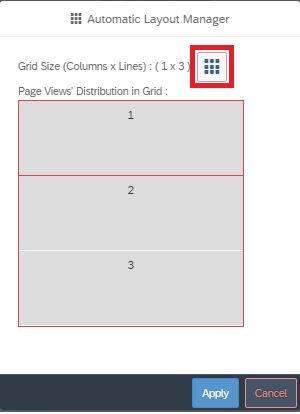
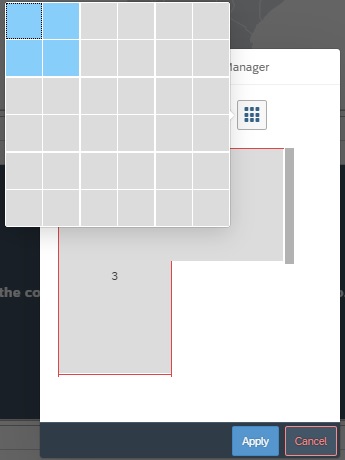
You can configure the layout of your dashboard in a Grid format. Each grid in the layout will hold a view of your dashboard. As we have 3 types of views you can form a layout of 3 grids. To configure the grid layout click on the Grid button in the setup area – View Management section:
In the pop-up you can drag and drop to form a Grid layout:
Step4: Select monitoring content
To customize your Operations Dashboard, you first need to select the monitoring content as the source of data from either of System Monitoring or Real User Monitoring or both. For this navigate to Page Personalization area.
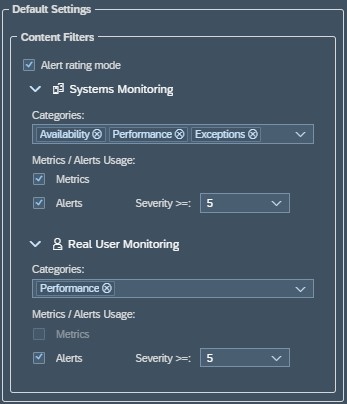
In the Default Settings area you can
Select or deselect monitoring area (System Monitoring/ Real User Monitoring)
Select or deselect metric or alerts
Select or deselect category (Availability/Exception/Performance)
Alert Severity ( Alerts of same or more severity are included in the scope of the dashboard)
Step 5: Create scenarios
In Order to link systems/ components to a particular region in the world map you need to create scenarios and link them to specific regions in the world map.
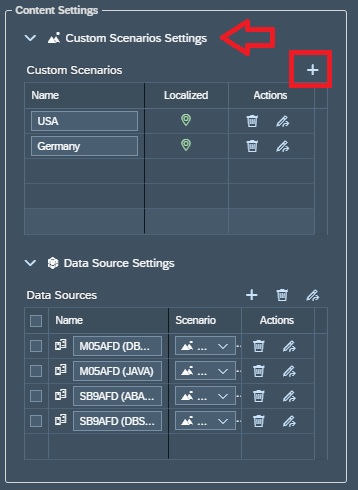
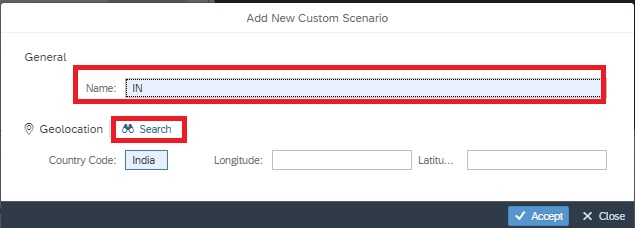
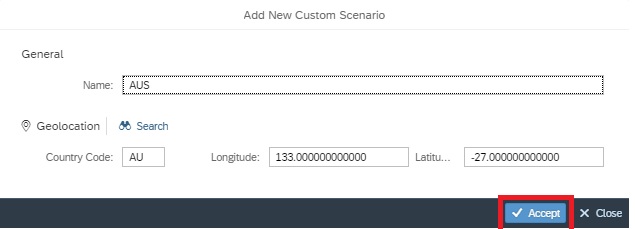
In this step you create named Scenarios or Regions to which you can later on tag your monitors. For this navigate to the Content Settings Area , Custom Scenarios Settings. To create a new scenario click on the + sign.
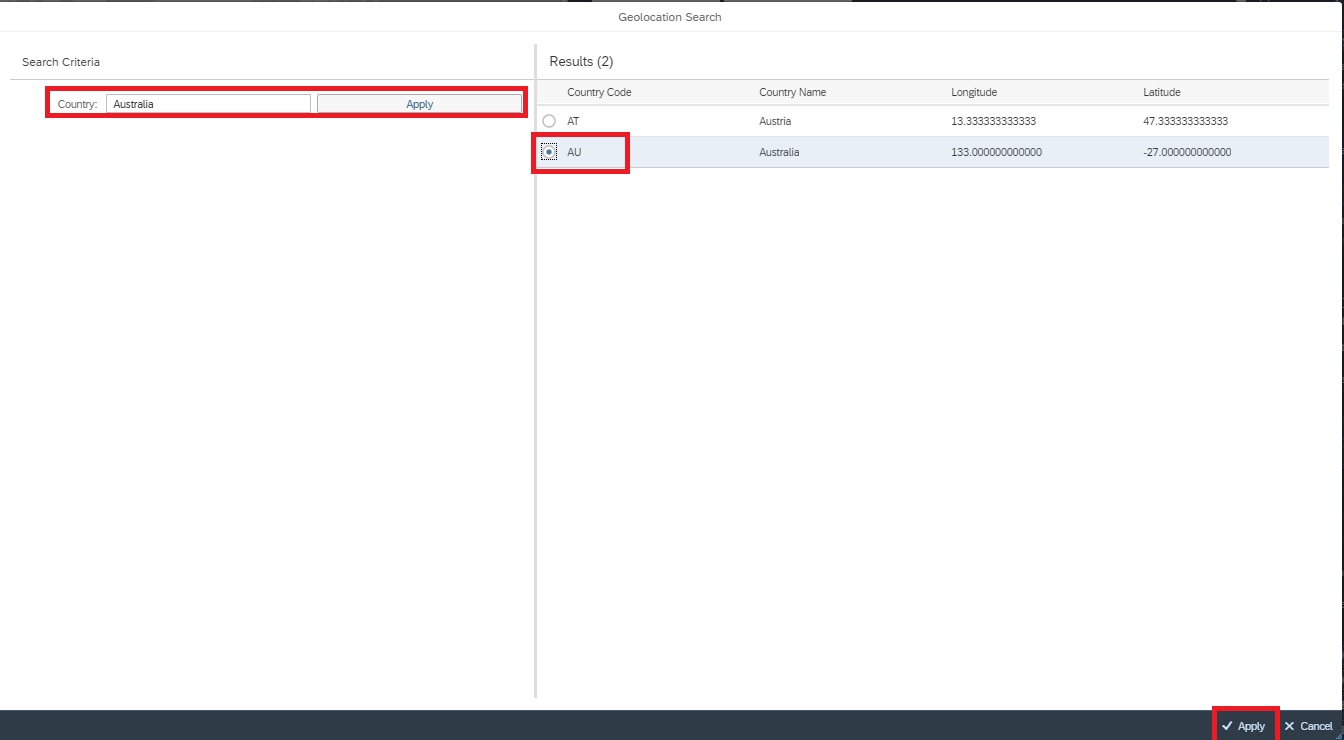
In the pop-up you can directly enter the country name or code or you can click on search to search for your respective country/region and it’s code.
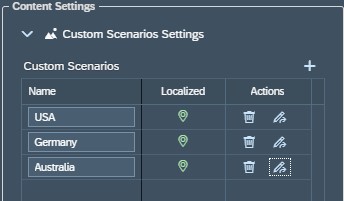
You can see the list of all scenarios you created in the Custom Scenarios section.
Step 6: Add monitors and tag monitors
In this step you add systems/components and tag them to specific scenarios you created in the previous step.
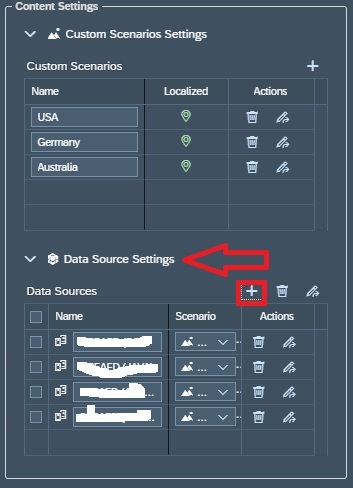
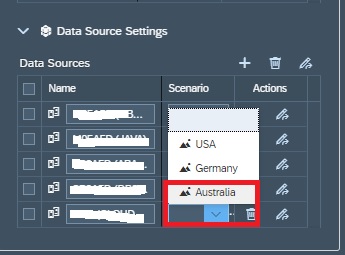
For this navigate to Content Settings area, Data Source Settings and click on the + sign.
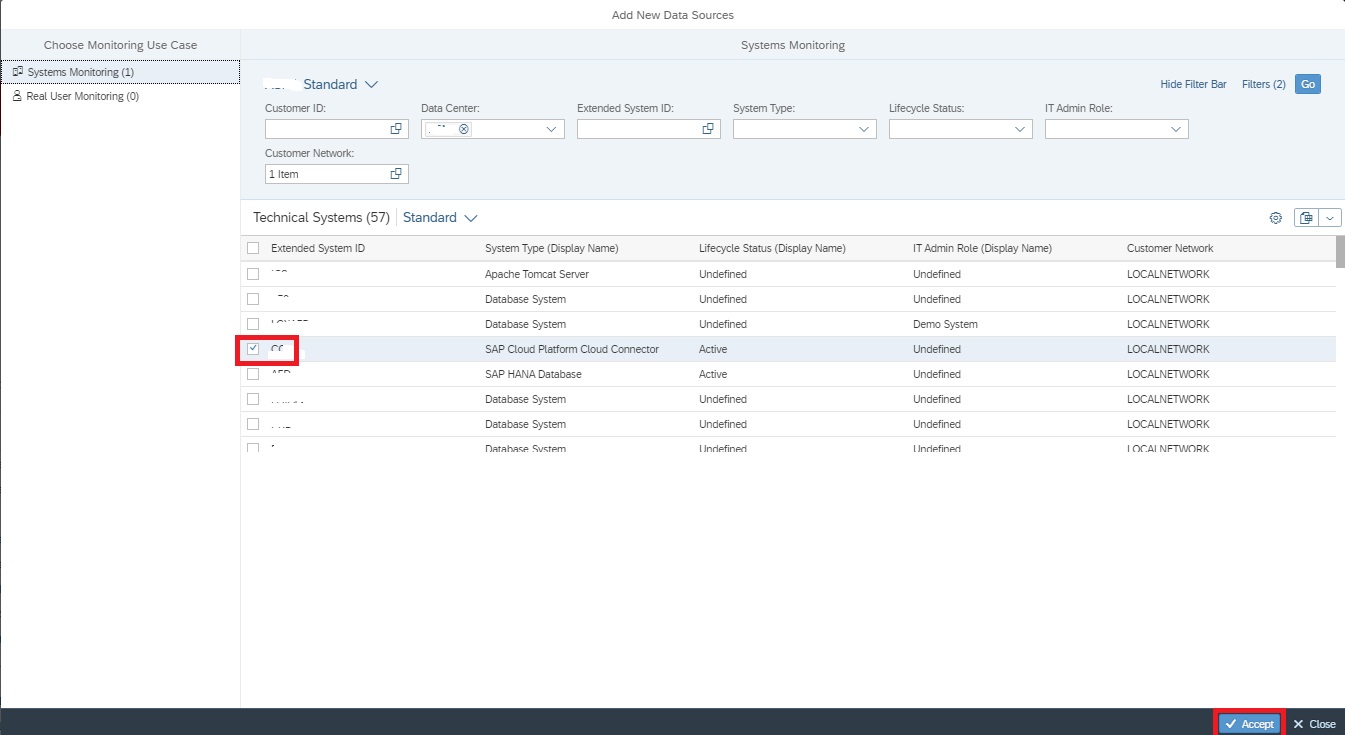
In the pop-up screen select the system/component you want to add and accept to continue.
Now back in the Data Sources list select the scenario for the system/component you just added.
Now your Operations Dashboard is ready.
In View 1: World Map, the regions are coded as per the aggregated rating of all systems/componenets tagged to a specific scenario in the Data Sources settings in Step 6.
In View 2: Tiles View, by default shows the Region/scenarios aggregated rating in tiles. In this view you can drill down to aggregated rating for each system/Compoenent/monitor by simply clicking on the tile. (For instance below shows the Tile view of the systems in Germany shown in the image 2 of this blog.
3. In View 3: the List View, shows the monitors for all the system/componenet shown in Tiles view, that is, if you drill down in Tiles View, accordingly filtered monitors are shown in Tiles view.
<< This blog was originally posted on SAP Focused Run Guru by Manas Tripathy. Repost done with permission. >>
This blog will explain specific items to keep in mind when monitoring certain applications.
Applications discussed and explained:
Adobe document servers (ADS)
BW systems
Cloud connectors
Content servers
ECC and S4HANA servers
EWM (enterprise warehouse management) servers
GTS (global trade system) servers
Netweaver gateway FIORI hub systems
SCM (supply chain management) servers
SLT servers
Web dispatchers
For each system we explain the monitoring of productive and non-productive system.
Adobe document server (ADS) application monitoring
Adobe Document Server (ADS) is used to generate PDF’s for output and/or interactive PDF forms.
Monitoring productive ADS systems
When monitoring a productive system, you will need to finetune the monitoring templates for:
SAP J2EE 7.20 – 7.50 Application template, for the JAVA application
SAP J2EE 7.20 – 7.50 Technical instance template, for the JAVA application servers
System host template
Database template
JAVA APPLICATION TEMPLATE for adobe document server monitoring
Make sure you cover in the JAVA application template the following items:
Availability:
JAVA HTTP availability
Expiring certificates
JAVA license expiry
From the JAVA instance template make sure to cover the following items:
J2EE application status
Instance HTTP availability and logon
JAVA server node status
GC (Garbage collection)
Fine tune the metrics so you are alerted on situation where the system is having issues.
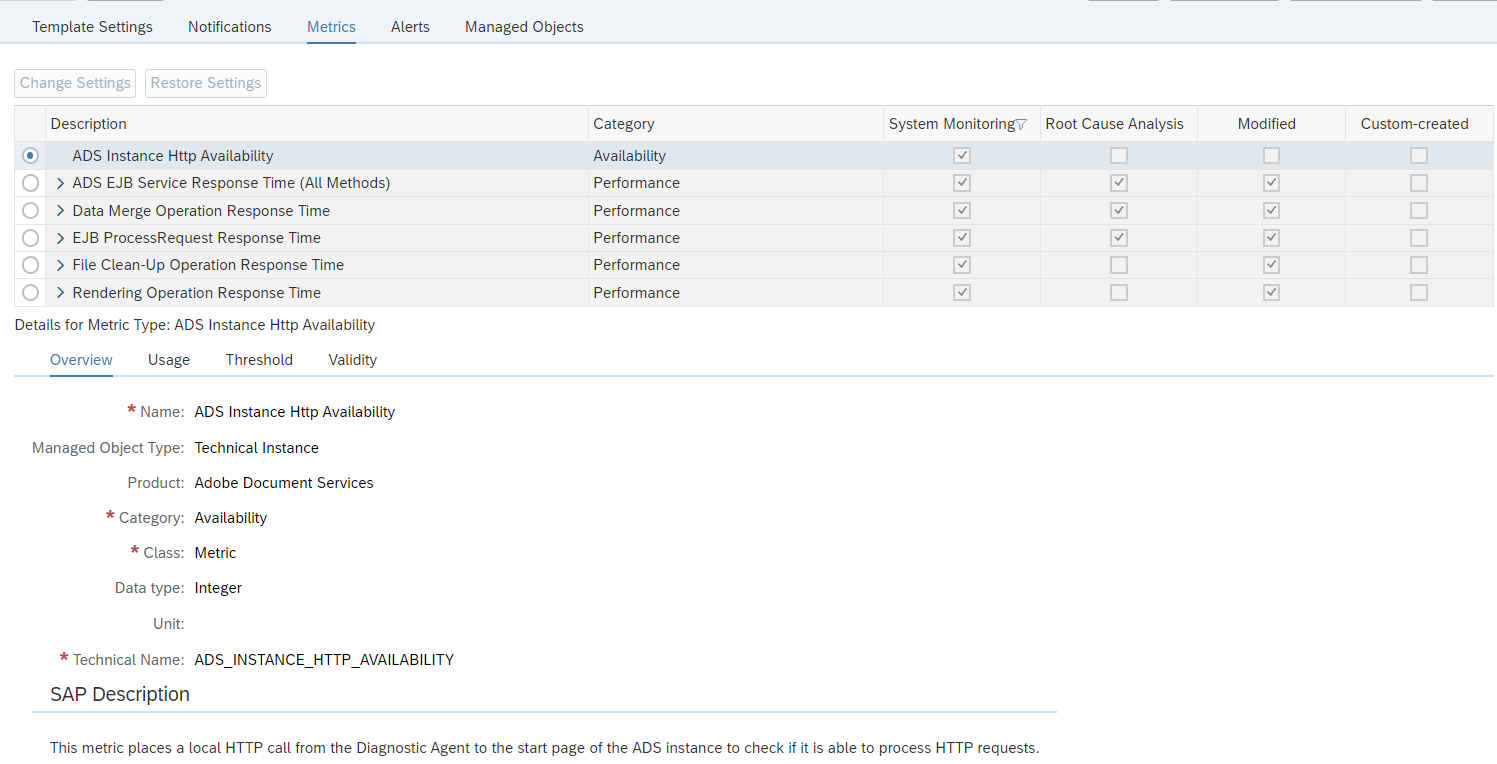
ADobe document server template for monitoring
ADS has a specific Technical instance template.
Make sure you activate it:
Most important here is the first one: ADS availability. Please make sure you are alerted when this one is not available.
BW application monitoring
BW systems are at the often used as reporting systems within an SAP landscape.
The basic monitoring of a BW system is the same as for any ABAP based system.
For a BW system some numbers are typically higher than on an ECC or S4HANA system. Response times of 1.5 seconds would indicate horrible performance on ECC, but are normal on a BW system.
Process chain monitoring
BW uses process chains. To monitor process chains, read this dedicated blog.
Cloud connector application monitoring
The Cloud connector is used between on premise systems and Cloud solutions provided by SAP.
Monitoring of cloud connector focuses on availability and connectivity.
Monitoring productive cloud connector systems
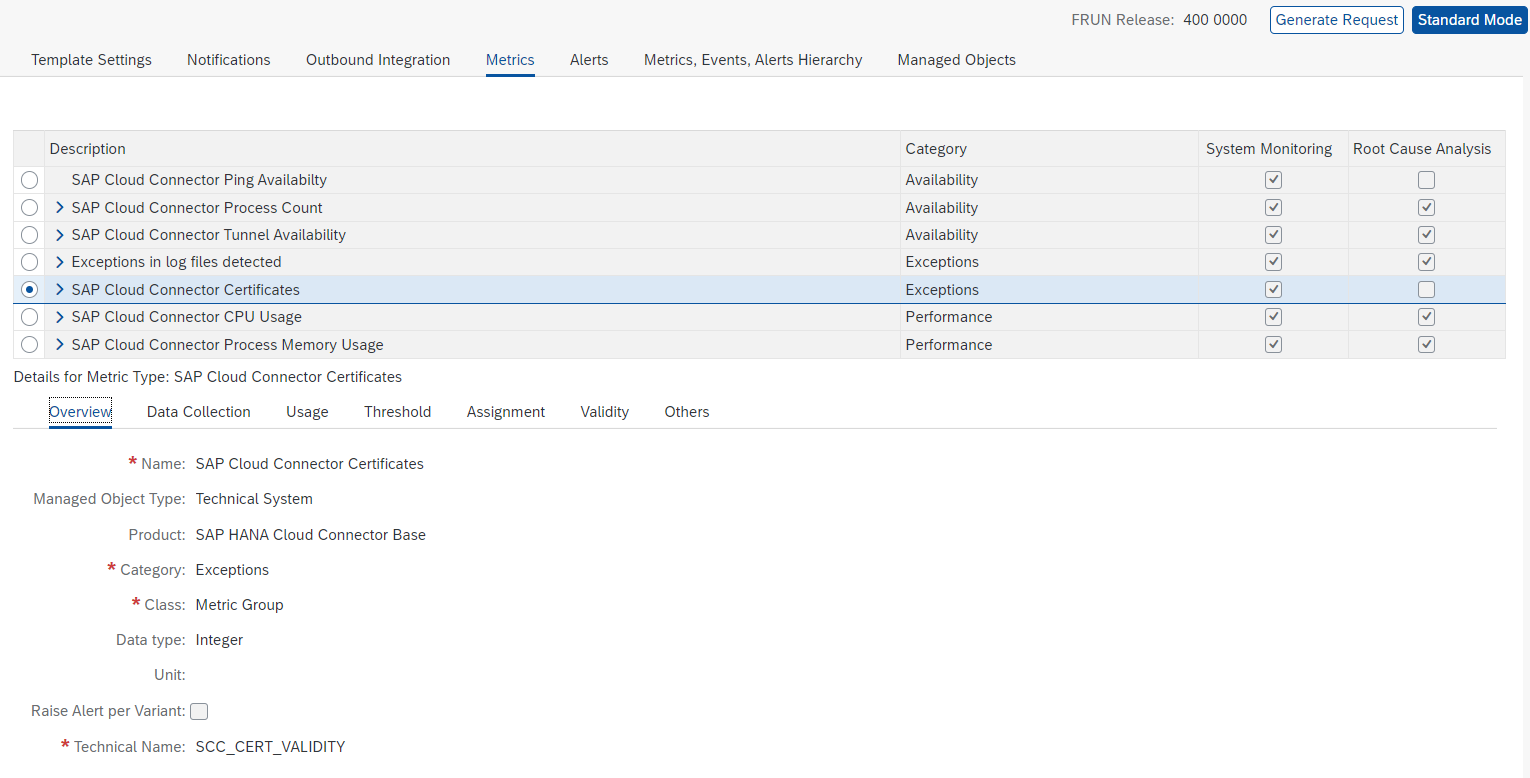
The cloud connector template contains all the needed elements out of the box:
If your landscape has only one cloud connector that is also used for non-productive systems, you might find a lot of issues in the non-productive system. Like expired certificates, channels not working, many logfile entries. If the cloud connector is very important for your business, it is best to split off the productive cloud connector from the non-productive usage. This way you can apply sharp rule settings for production: even single issue will lead to alert. While on non-production the developers will be making a lot of issues as part of their developer process.
Monitoring non-productive cloud connector systems
In your landscape you might have a non-productive cloud connector that is used for testing purposes. In the non-productive cloud connectors you might apply a different template with less sensitive settings on certificates, logfiles and amount of tunnels that are failing.
Content servers are often used to store attachment and data archiving files. They are technical systems with usually no direct access for end user. End users normally fetch and store data form content server via an ABAP or JAVA application.
The main part of content server monitoring is availability.
ABAP connection to content server monitoring
In some cases both your ABAP stack and content server are up and running, but communication between them is failing on application level. This leads to not working system for end users. Root causes can be firewall issues, certificate issues, or somebody altered settings.
To test the ABAP system connection to content server a custom ABAP program is needed. See this blog. You can schedule the program in batch and set up a new custom metric to capture the system log entry written by the program.
System host template for content server monitoring
For system host the regular CPU, memory, disc template is sufficient. Finetune the thresholds to your comfort level.
Database template for content server monitoring
Important items of the database template:
Database availability
Database health checks
Backup
In most installations it is chosen to install Content Server with the SAP MaxDB database (similar to LiveCache).
EWM systems are at the often used as stand alone systems that make sure logistics and warehousing can keep running at high availability. If the connected ECC or S4HANA system is down, EWM can continue to support logistics operations.
EWM can be older version based on SCM/BI system core. Newer EWM systems are using S4HANA with EWM activated as standalone.
Extra in an EWM system are the use of qRFC and the CIF (Core interface). And many EWM systems have users that interact with the system via ITS GUI based handheld scanners.
CIF monitoring
The CIF is the core interface between SCM and ECC system. The interface typically uses RFC and qRFC. And it is working both ways.
Setup for the CIF specific RFC’s and qRFC’s the monitoring:
Many EWM systems are having interaction with scanners via the ITS server. Basically this is a small web page on a scanning device.
Make sure you monitor the availability of the URL’s that the scanners are using. More on URL monitoring can be found in this blog.
GTS (global trade system) application monitoring
GTS systems are at the not frequent in use. When in use they do play a vital role in import and export business scenario’s when good are crossing borders.
Since a GTS system is normally installed, and often no to little maintenance and software changes are performed on the system. Also basis teams tend not to look at it too often, since it normally runs stable.
In case of non-availability of GTS, ECC scenario’s linked to GTS might fail and can causes severe business disruptions.
For this reason it is important to set up monitoring in FRUN for your GTS system and also configure mail alerts in case of issues. They will not happen too often, but when they happen you can act fast. This will also save the basis team spending a lot of time on checking GTS system for log (most cases, the checks are good).
When monitoring a productive system, you will need to finetune the monitoring templates for:
ABAP 7.10 and higher Application template, for the ABAP application
ABAP 7.10 and higher Technical instance template, for the ABAP application servers
SCM systems are at the often used logistics optimization systems. They are mainly used in combination with traditional ECC systems. They are less needed in combination with S4HANA systems (or you can use the embedded SCM of HANA).
The core of an SCM system is a BI system. Many data is using similar extractors and process chains as a BI system. Hence follow the tuning needed for a BI system.
Extra in an SCM system are the LiveCache and the CIF (Core interface).
The basic monitoring of an SCM system is the same as for any ABAP based system.
For an SCM system some numbers are typically higher than on an ECC or S4HANA system. Response times of 1.5 seconds would indicate horrible performance on ECC, but are normal on an SCM system.
LiveCache monitoring
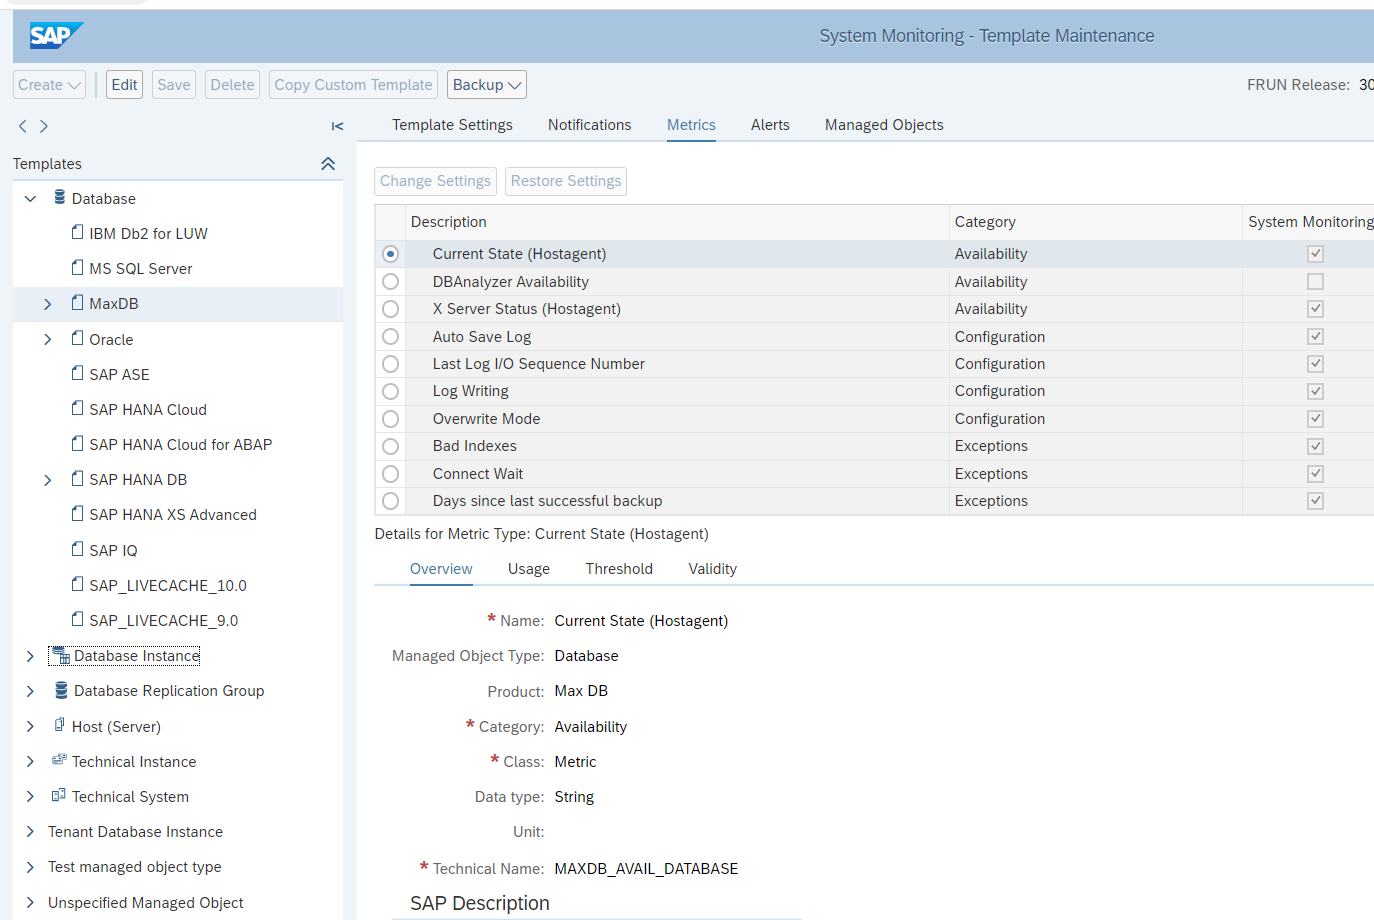
LiveCache is normally running on a MaxDB database.
So it is important to activate, assign and finetune the metrics for the MaxDB database:
Focus on:
Availability
Backup
Performance
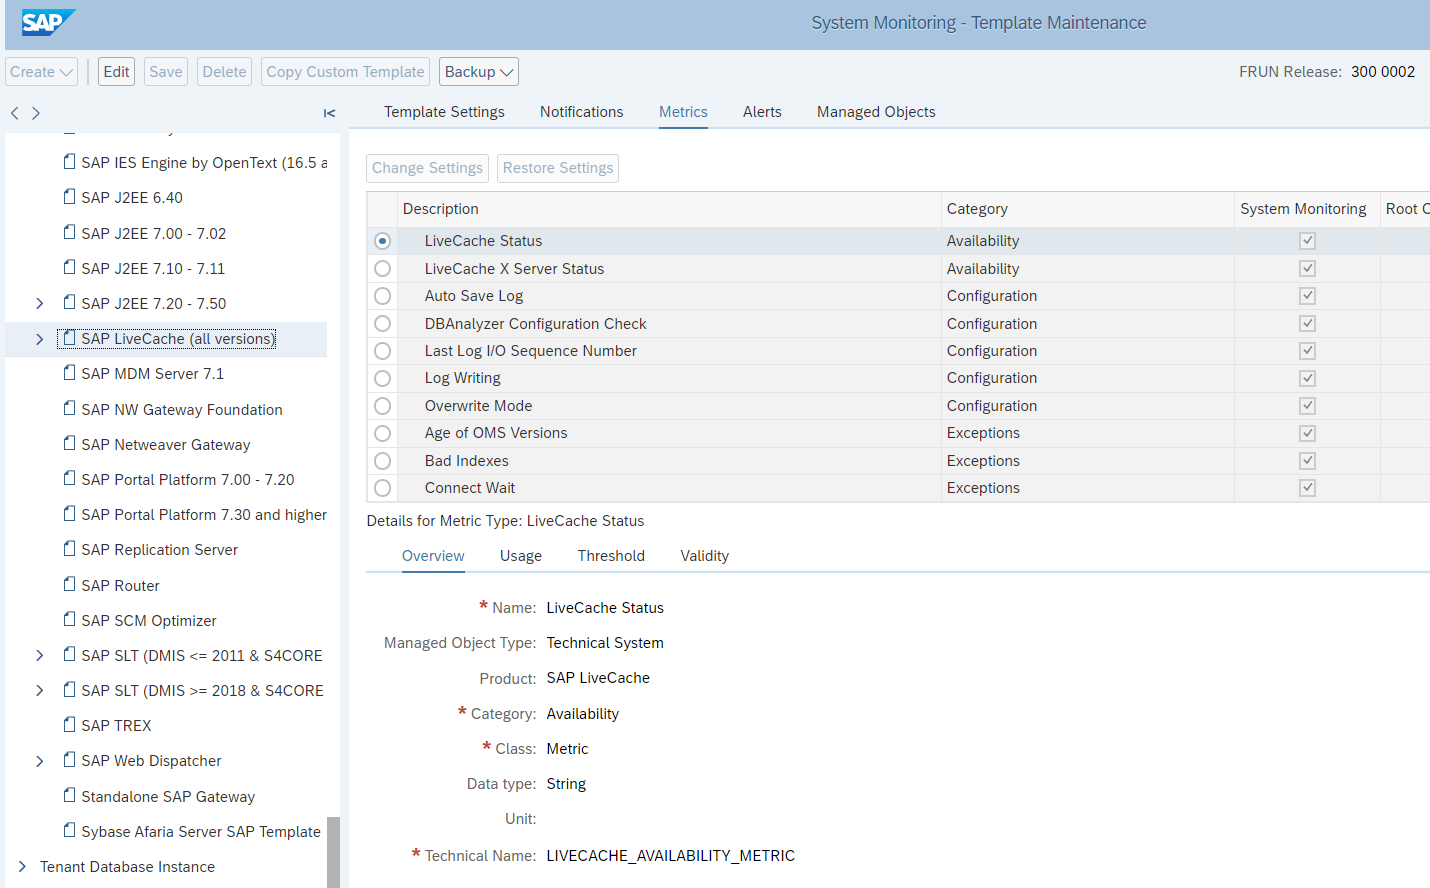
Next to the database, you also need to activate, assign and finetune the LiveCache specific application template:
This template contains the primary elements to monitor for the LiveCache functions like:
Availability of LiveCache as a function
Structure check for LiveCache
Memory issues for LiveCache specifically
Fine tune the metrics so you are alerted on situation where the system is having issues.
CIF monitoring
The CIF is the core interface between SCM and ECC system. The interface typically uses RFC and qRFC. And it is working both ways.
Setup for the CIF specific RFC’s and qRFC’s the monitoring:
SCM uses process chains. To monitor process chains, read this dedicated blog.
SLT system application monitoring
SLT systems are mainly used to replicate data from source systems like ECC and S4HANA towards target systems like Enterprise HANA, HANA cloud and other data pool systems.
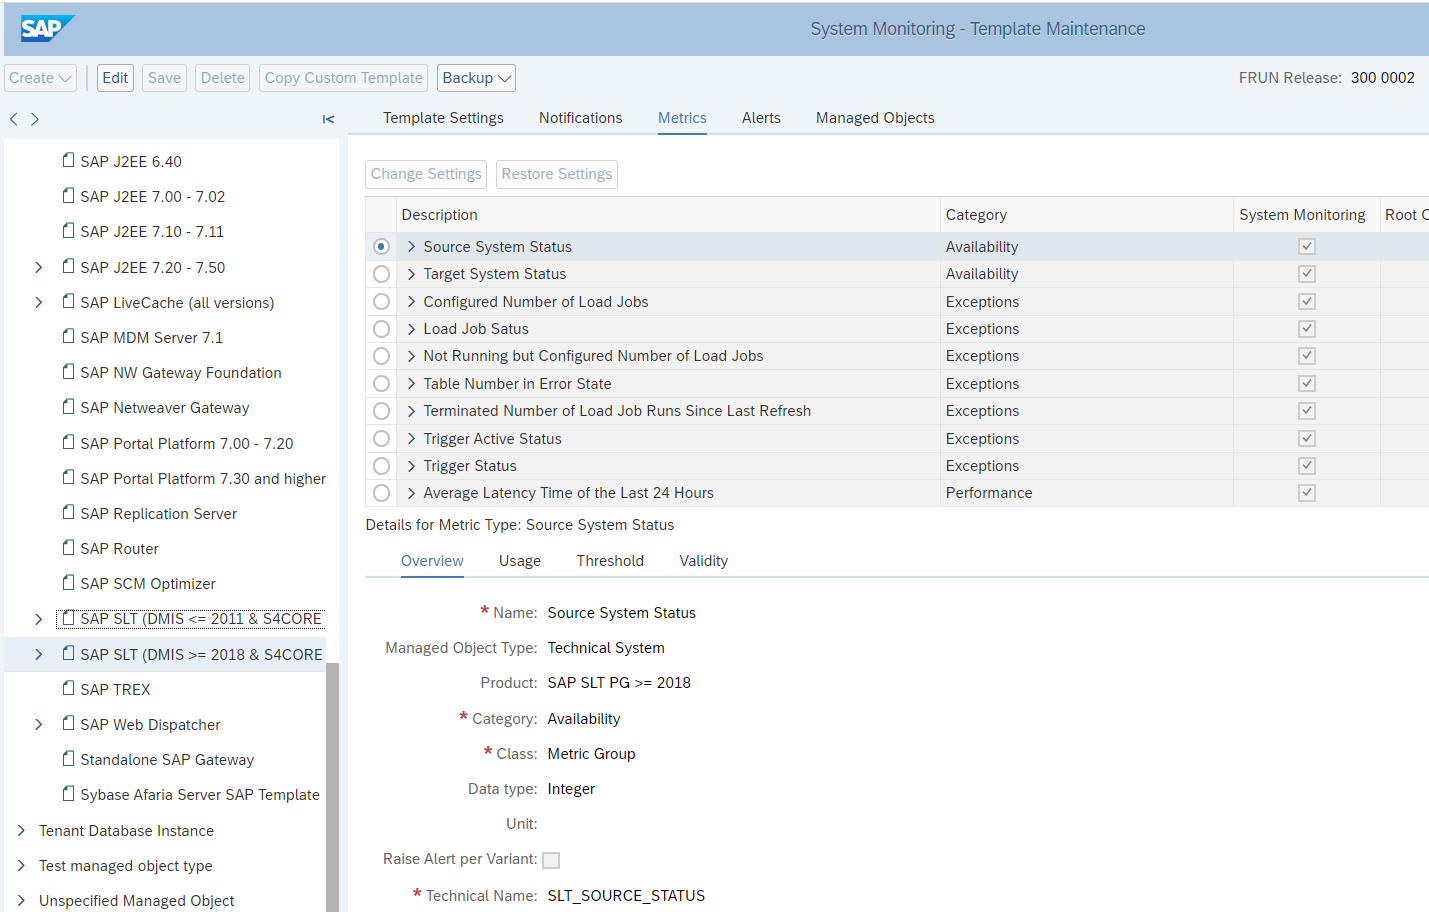
SLT DMIS template for SLT system
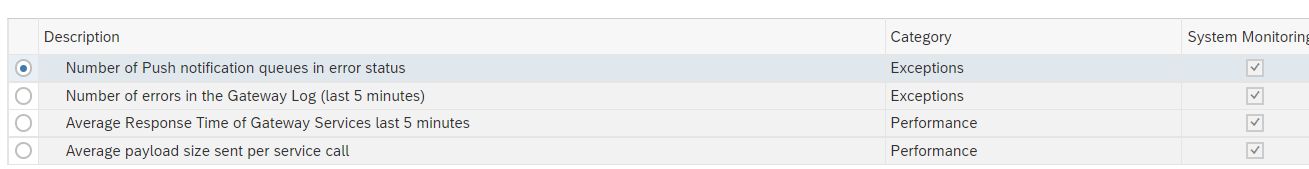
For SLT systems, apply the SLT DMIS template:
In the SLT system itself, make sure job /1LT/IUC_HEALTH_C with program R_DMC_HC_RUN_CHECKS runs. This will collect data that is needed for SLT itself, but which is also re-used by SAP Focused Run.
Anyhow you should make sure to regularly apply the notes for the DMIS component. See this blog.
SLT DMIS dummy template backend system
For SLT to work, the DMIS component is installed in both the SLT system and the backend system. For the backend system SLT component, Focused Run will pick up the template as well. But this will not make any sense in monitoring, since it is the source system and not the SLT system.
For this reason, set up a dummy empty template with every monitoring item disabled:
Assign this dummy template to your backend system.
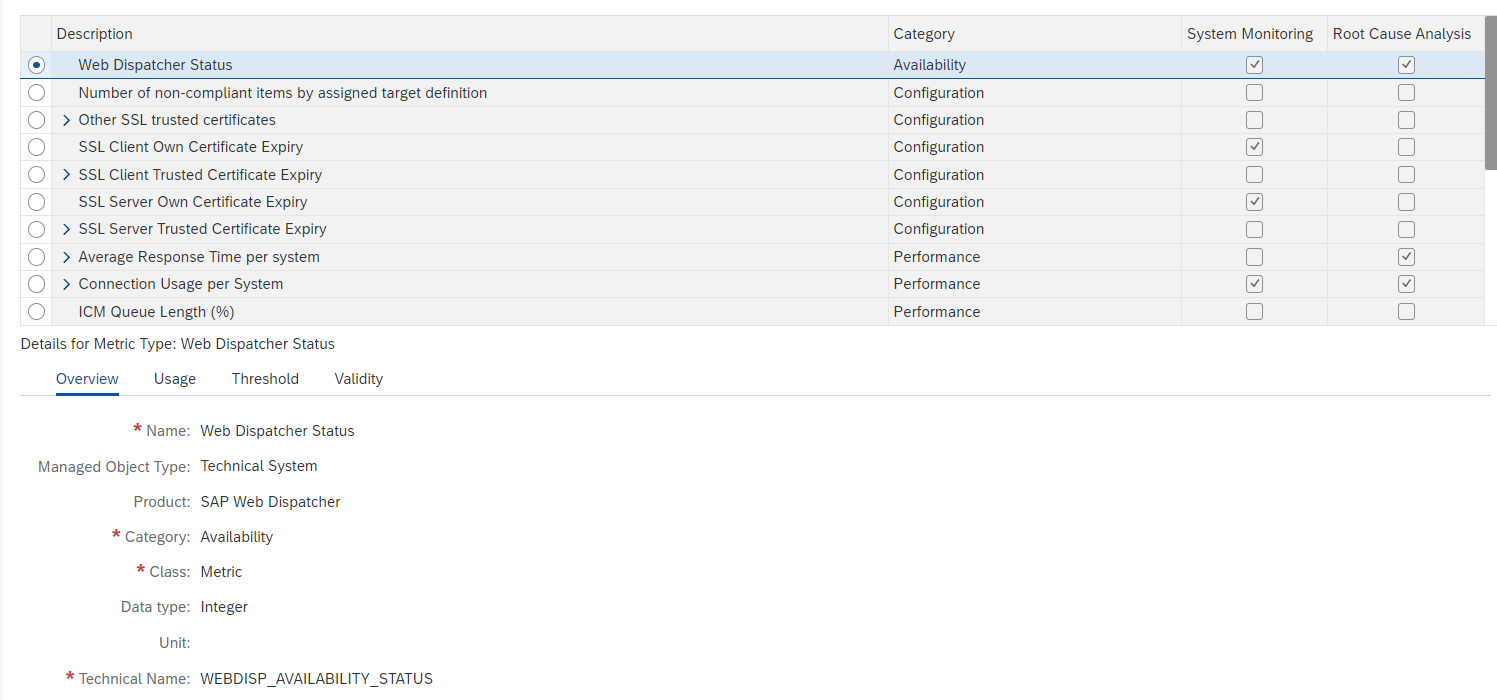
Standalone web dispatchers are used to load balance web traffic towards ABAP and/or JAVA systems. Common use case is to have web dispatcher for a large Netweaver Gateway FIORI installation.
Monitoring productive cloud web dispatchers
Monitoring of web dispatchers focuses on availability, connectivity and performance.
The web dispatcher template contains most needed elements out of the box:
Issues with performance are often caused by limitations set in the web dispatcher configuration. Keep these settings active.
You might want to add specific custom metric to monitor the most important URL for your web dispatcher. Read more in this specific blog.
Next to this setup the normal host monitoring to make sure the file system and CPU of the web dispatcher are not filling up and causing availability issues for the web dispatcher function.
Monitoring non-productive web dispatcher systems
For monitoring non-productive web dispatcher systems, it is normally sufficient to restrict to host and availability monitoring.