SAP Focused Run can be used to monitor expiry of a lot of different type of certificates:
- ABAP PSE certificates (read below)
- Host agent PSE certificates (read below)
- SSL certificates (see this blog)
- Cloud Connector BTP certificate expiry (read below)
- SNC certificate expiry (read below)
- SNC expiry in SAP router
ABAP PSE certificate monitoring
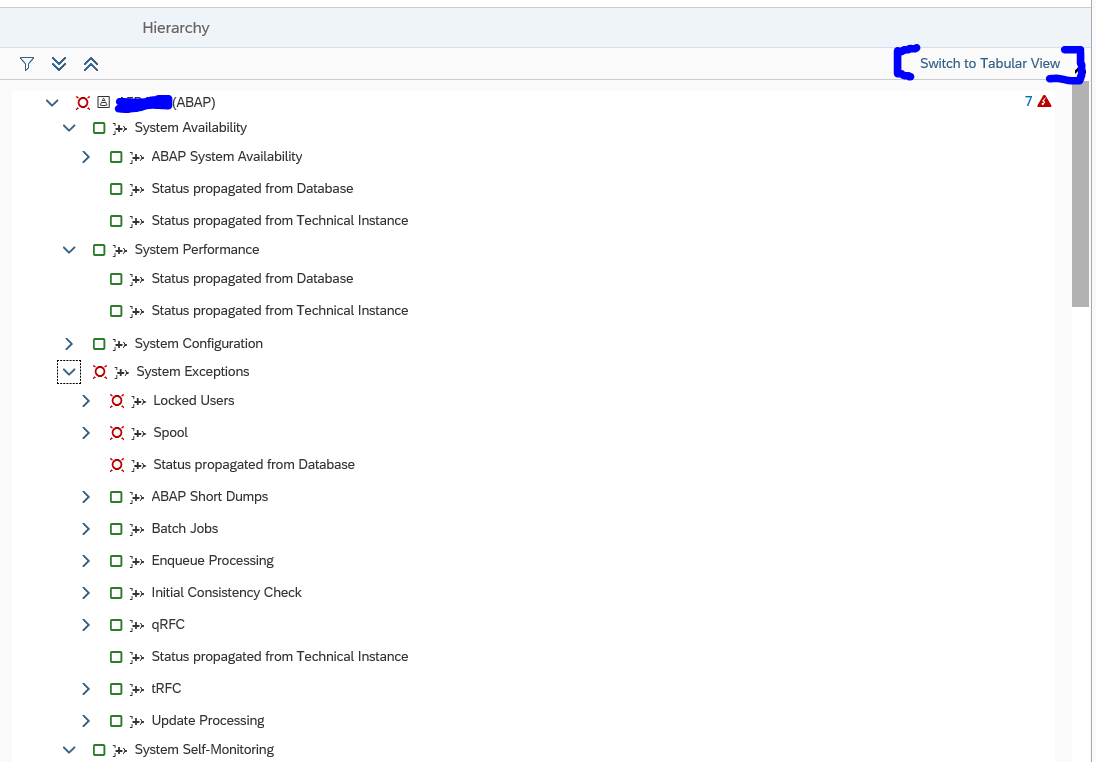
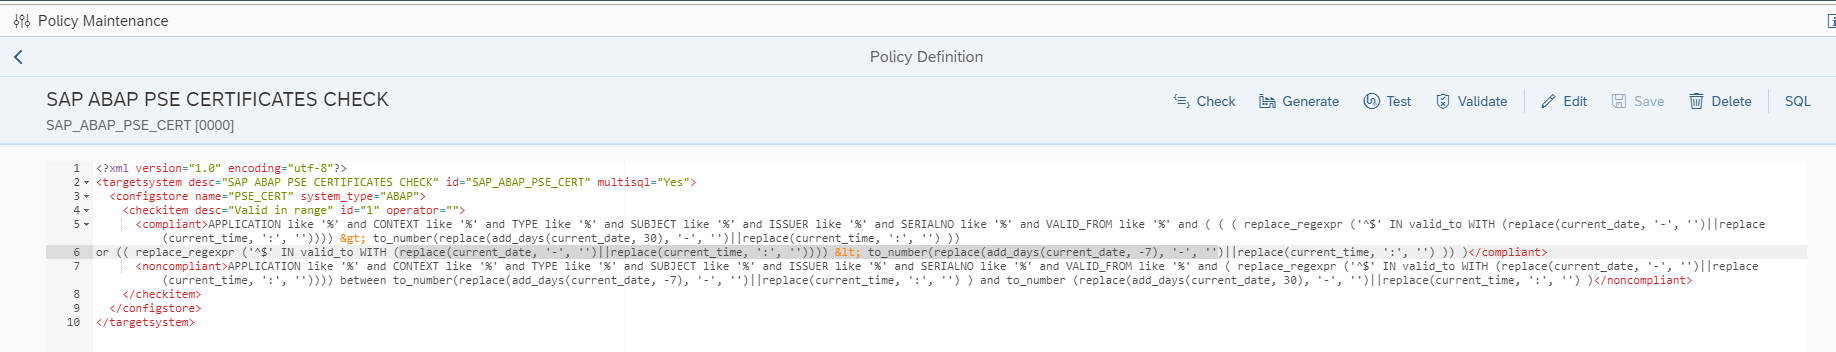
In system monitoring you can monitor if ABAP system certificates are expiring or are already expired. SAP provides a standard metric for this based on configuration validation rule SAP ABAP PSE CERTIFICATES CHECK. This rule is taking all certificates that are to be expired in the next 7 days and all expired certificates.
This rule has two setbacks:
- 7 days upfront warning might be too short
- It reports all expired certificates that are already years expired and don’t harm the system
New rule for ABAP PSE certificate monitoring
For the improved setup we will defined 2 new rules:
- To be expired certificates, with date selection -30 till tomorrow
- Expired certificates, with date selection today till next 30 days.
Start with creating the policy in configuration validation (more on configuration validation in this blog):
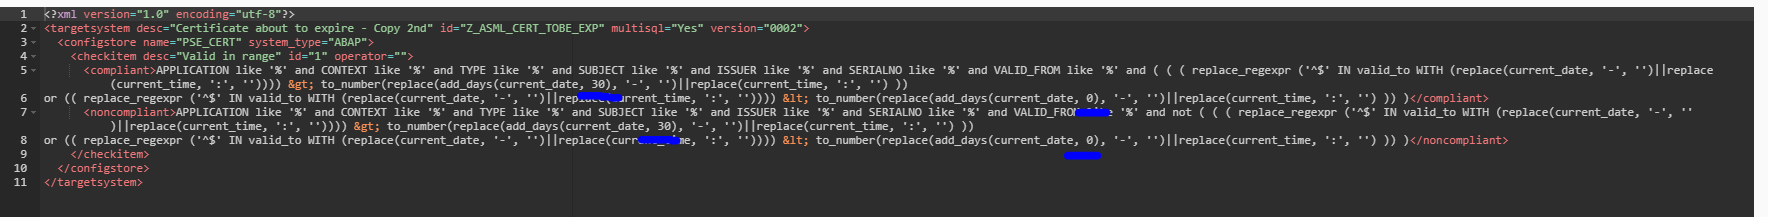
Add a new policy Z_ABAP_PSE_TO_BE_EXP for the to be expired, and give it this syntax:
Add a new policy Z_ABAP_PSE_EXP for the expired ones:
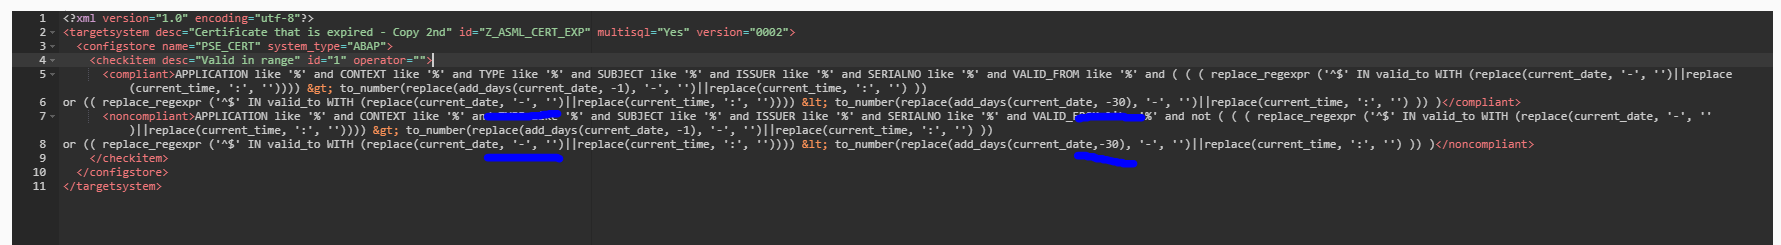
Both are basically a copy of the standard SAP one with the changed dates.
Please note you need to change both the dates in the Compliant and Non-Compliant section.
Create custom metric
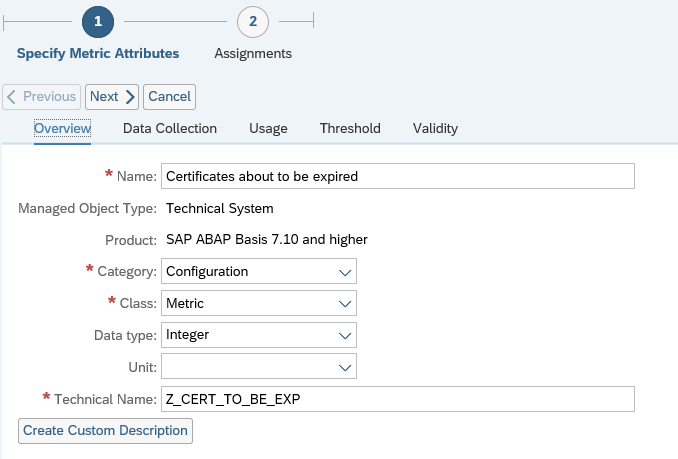
Now you can create a custom metric using the newly created rule. For full description on how to create custom metrics, read this blog. Create the custom metric in the ABAP system template:
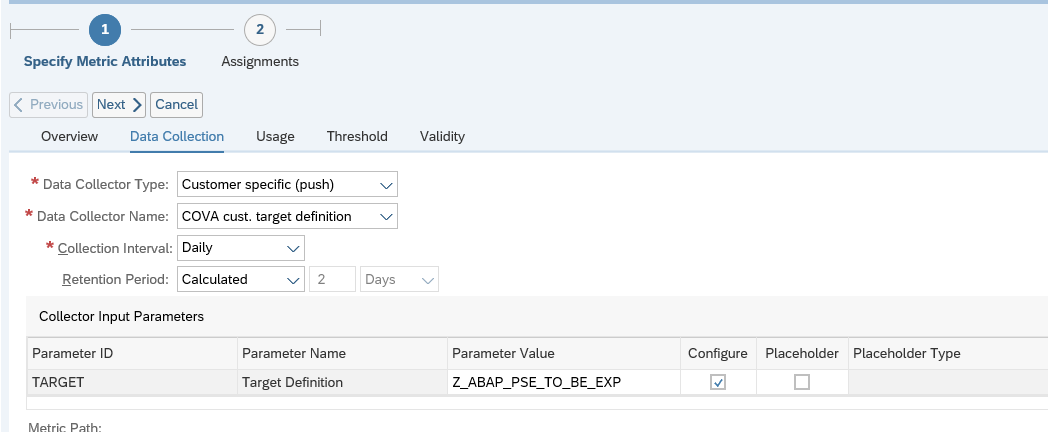
Refer to the newly create custom CoVa (configuration validation) rule:
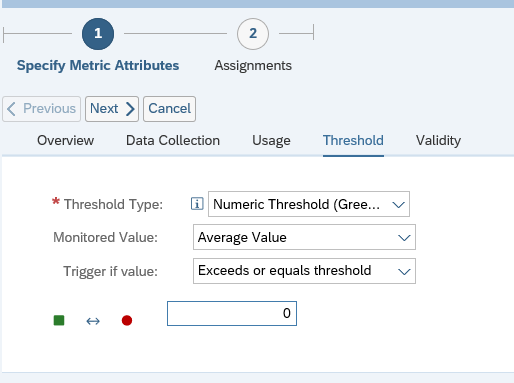
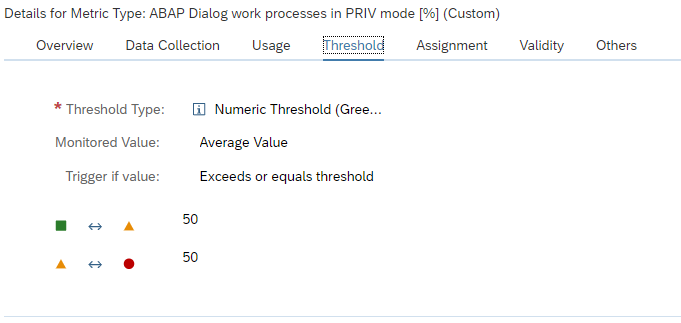
And set the threshold:
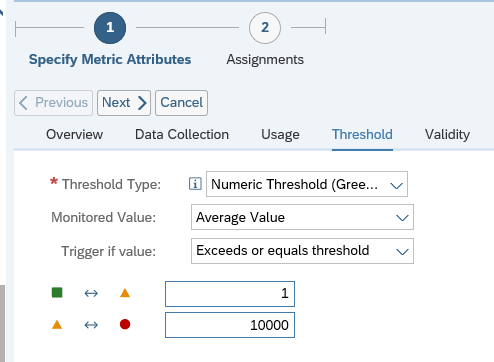
For the to be expired certificates, we only want warning.
We repeat the same for the expired certificates, but now we make it a red alert by setting the thresholds differently.
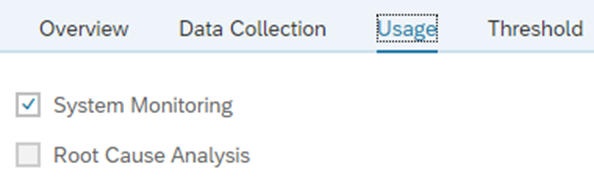
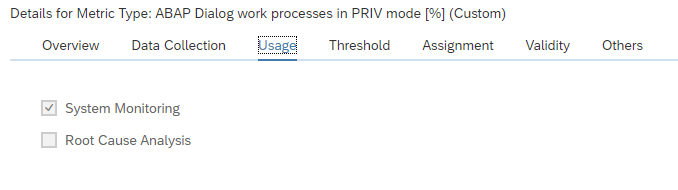
Make sure both are now activated for monitoring:

Trouble shooting
There might be false alerts raised for this metric. This is for both the custom and standard SAP metric. The source is usually the data collection.
SAP note 3138046 – False Alert ABAP PSE certificates expiring in Focused Run describes the checks to perform.
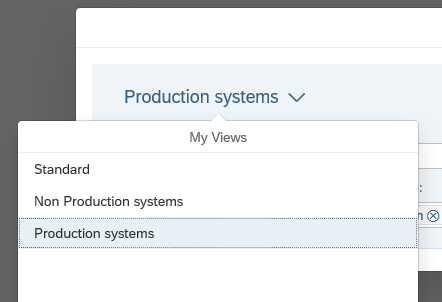
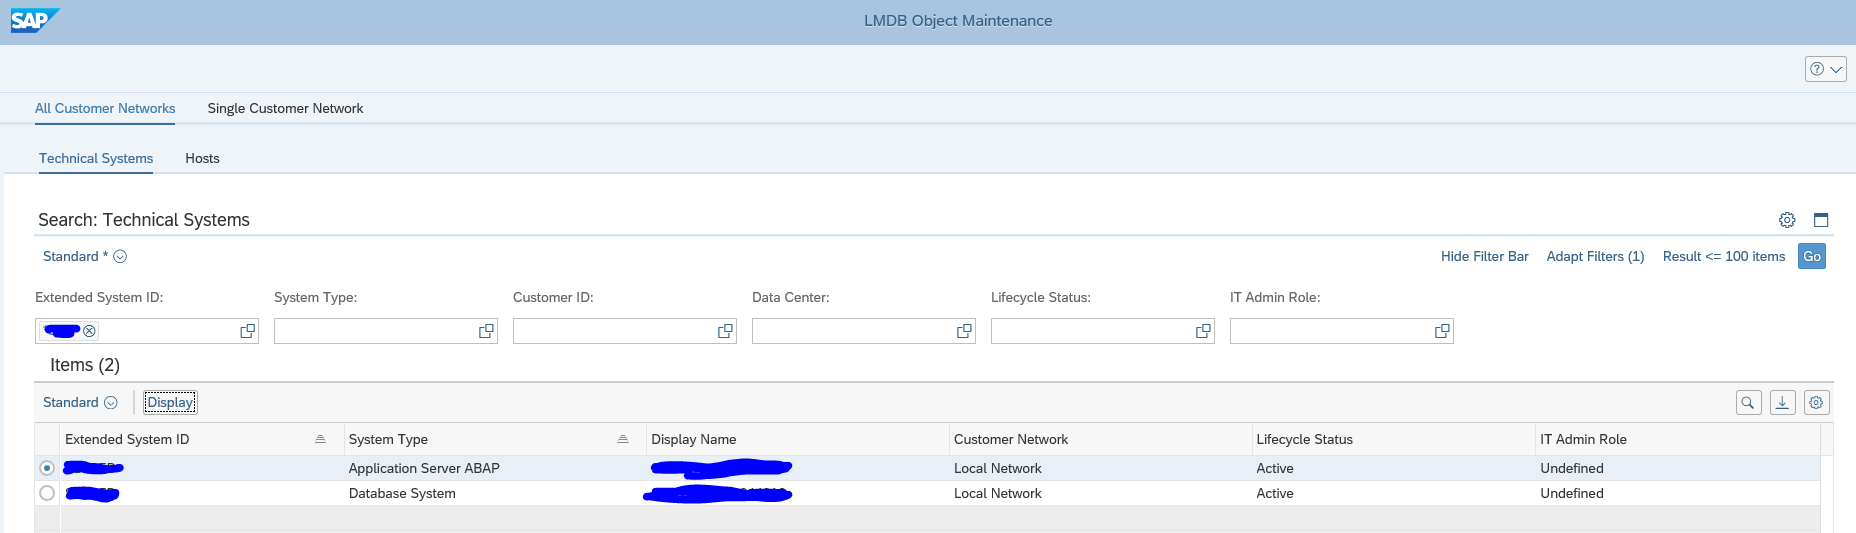
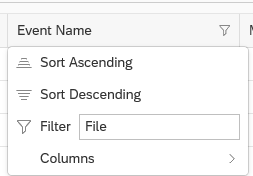
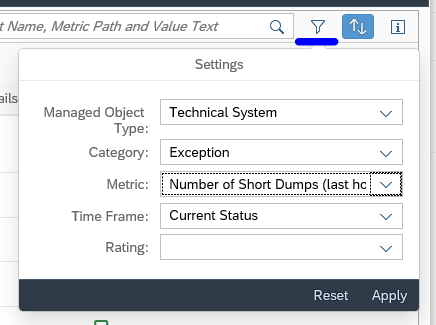
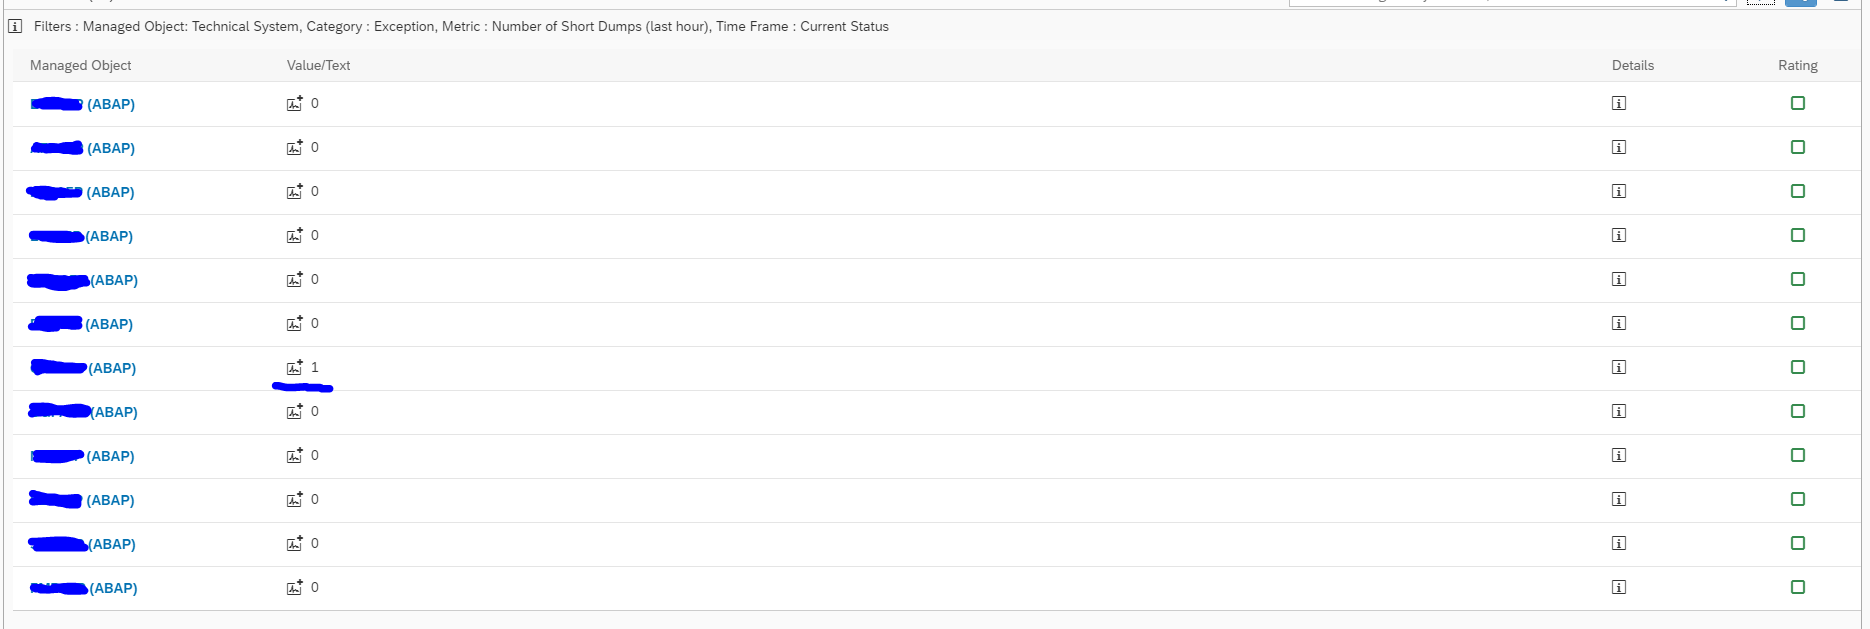
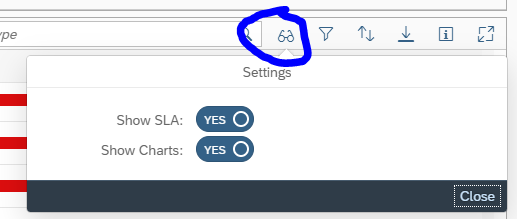
Go to the configuration and configuration validation FIORI tile and select the system and search for the PSE certificates data collection details:
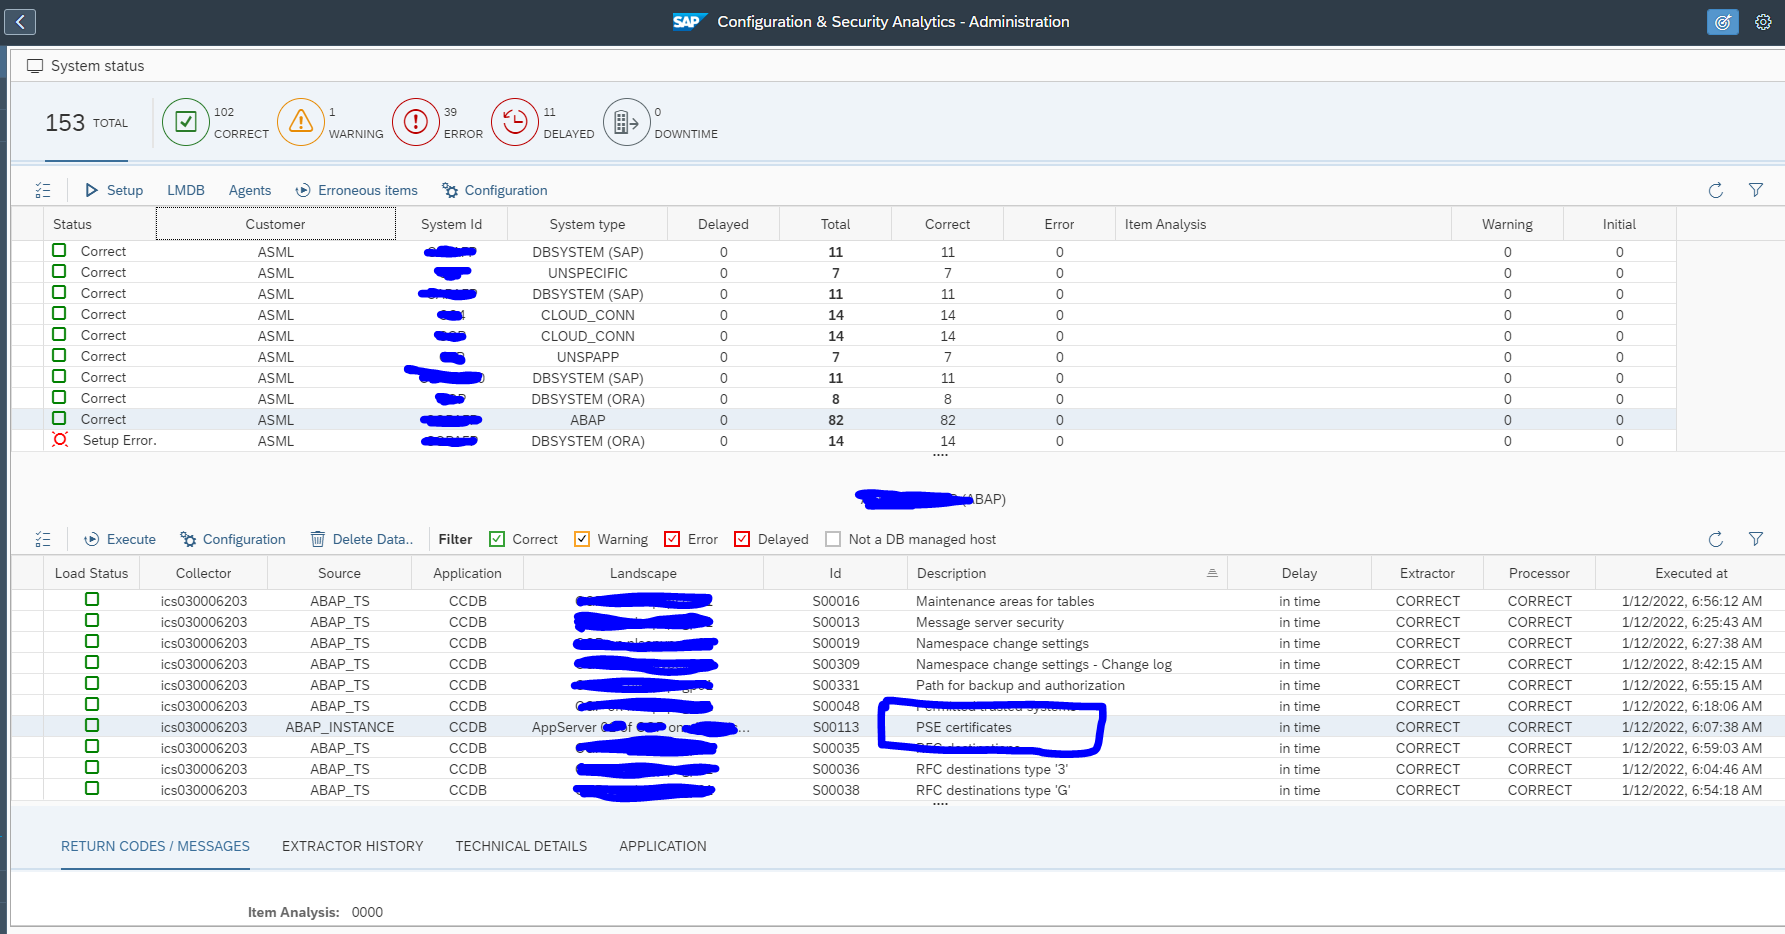
Monitoring Host Agent PSE Certificate Expiry
You have configured SSL for enabling secure connections to SAP Host Agent. In such a case you need to regularly update or extend the validity of the SAP Host Agent PSE certificate. With Focused run System Monitoring you can create custom metric for monitoring SAP Host Agent PSE certificate expiry.
Setup Monitoring Host Agent PSE Certificate Expiry
Step1: Navigate to Host Template maintenance
SAP Host Agent resides at OS level of each host of systems that you are monitoring using Focused Run. Hence you need to monitor the PSE certificate for SAP Host Agents of each host in your customer network.
In our recent blog we have explained how you can configure URL Certificate monitoring in Health Monitoring in SAP Focused Run. However configuring certificate monitoring for each SAP Host Agent in your customer network using Health Monitoring will be very cumbersome.
An easier way will be to setup a custom metric in the host level system monitoring template which when activated will be automatically applied to all hosts for which the monitoring template is used.
For template maintenance you can navigate to System Monitoring Template Maintenance app on the Focused Run launch pad.
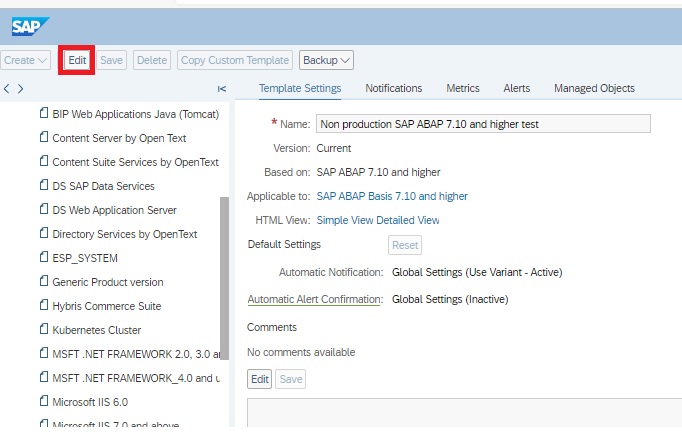
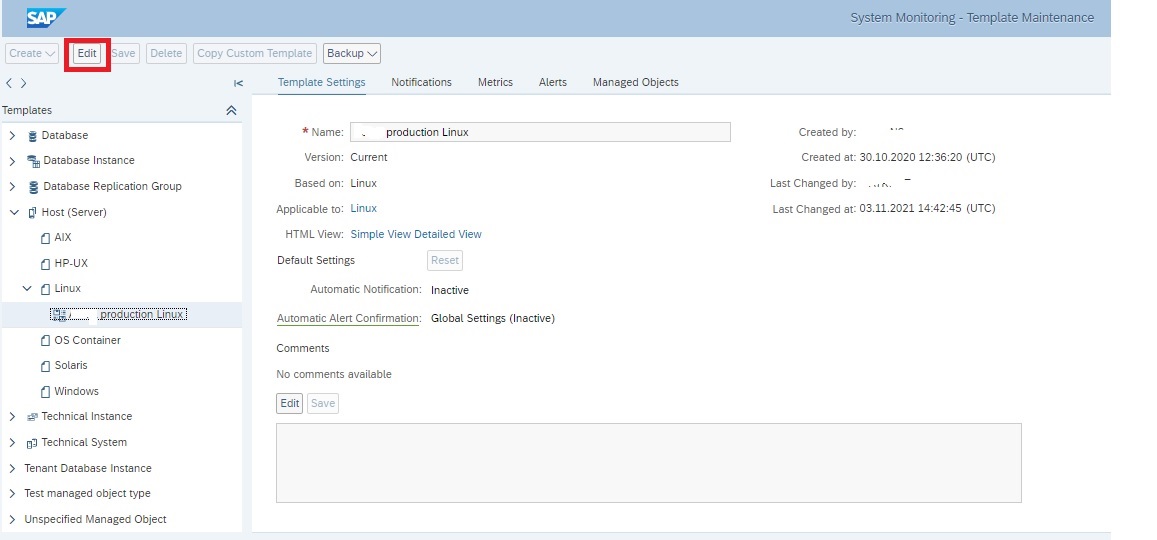
In the template maintenance app navigate down to the Host (Server) node and then to the respective template which you want to edit and click on Edit button.
Step2: Create Custom Metric
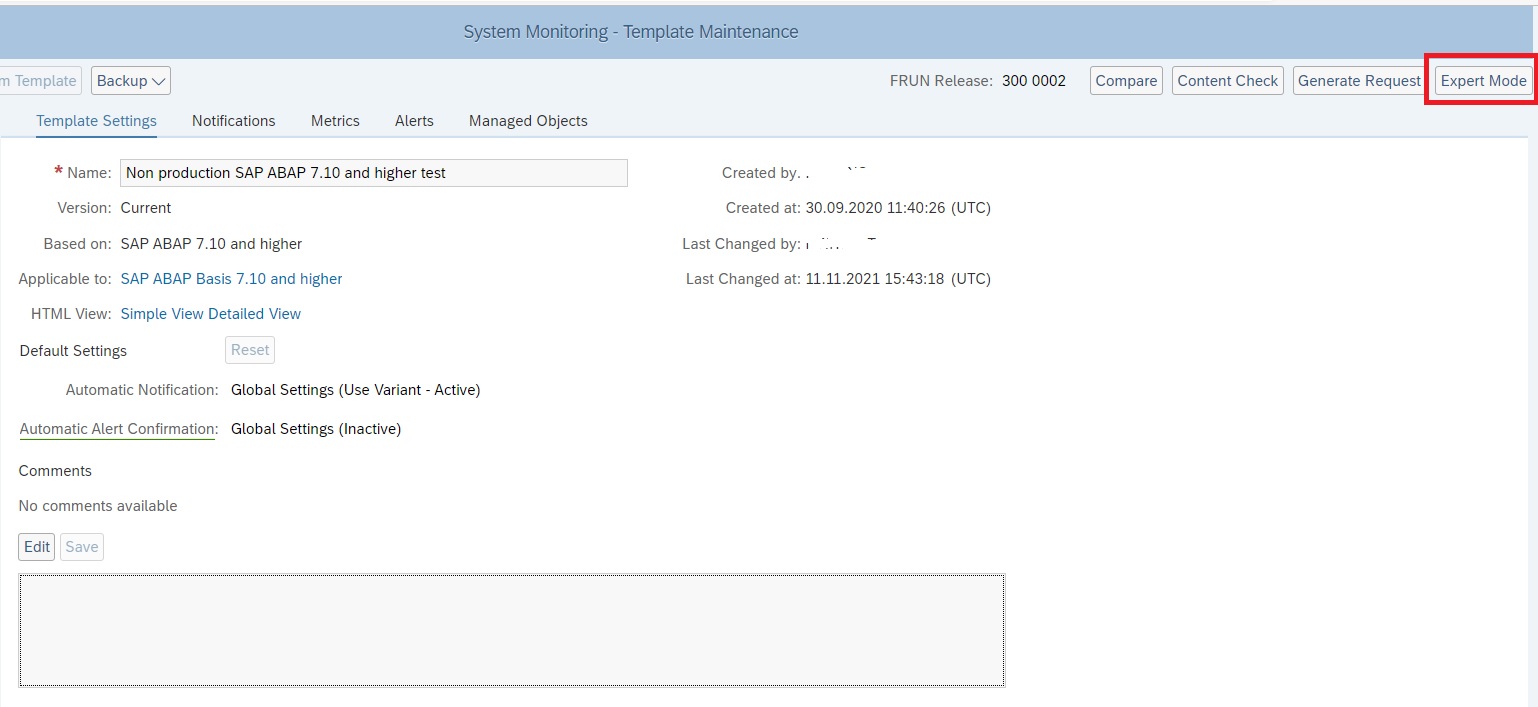
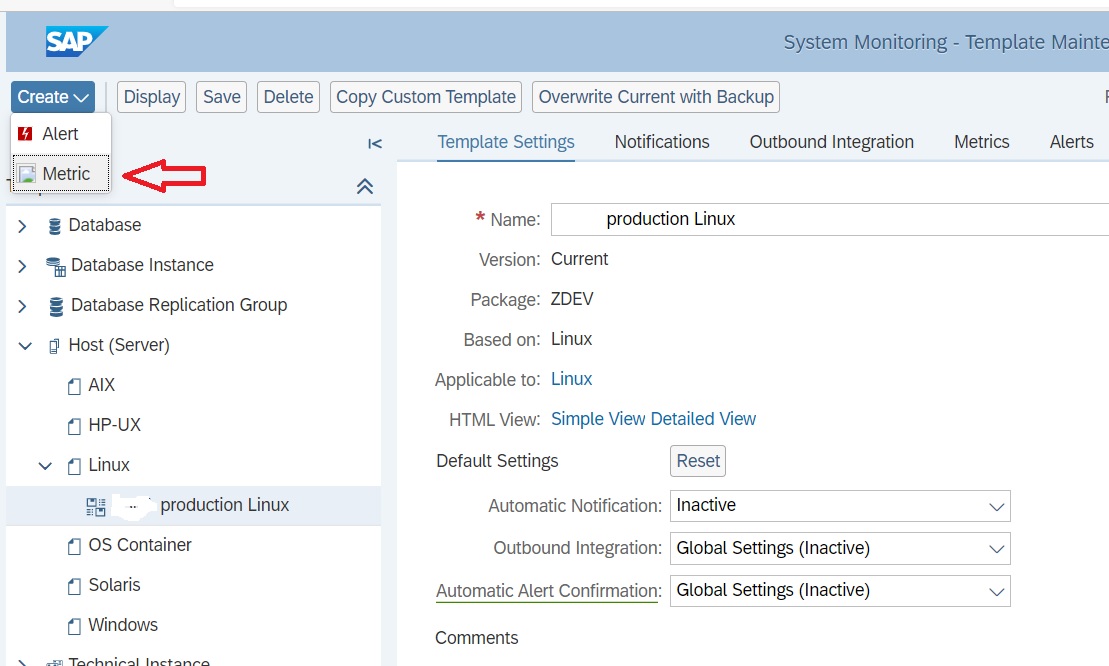
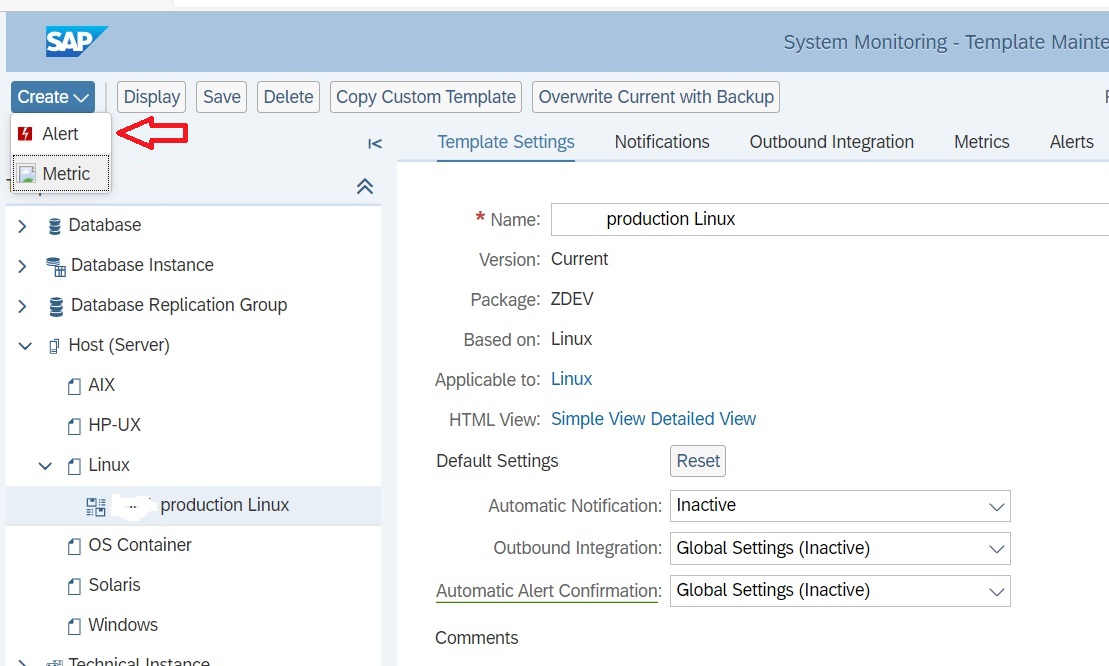
In order to create a custom metric you need to activate expert mode. For this click on the Expert Mode button as shown below.
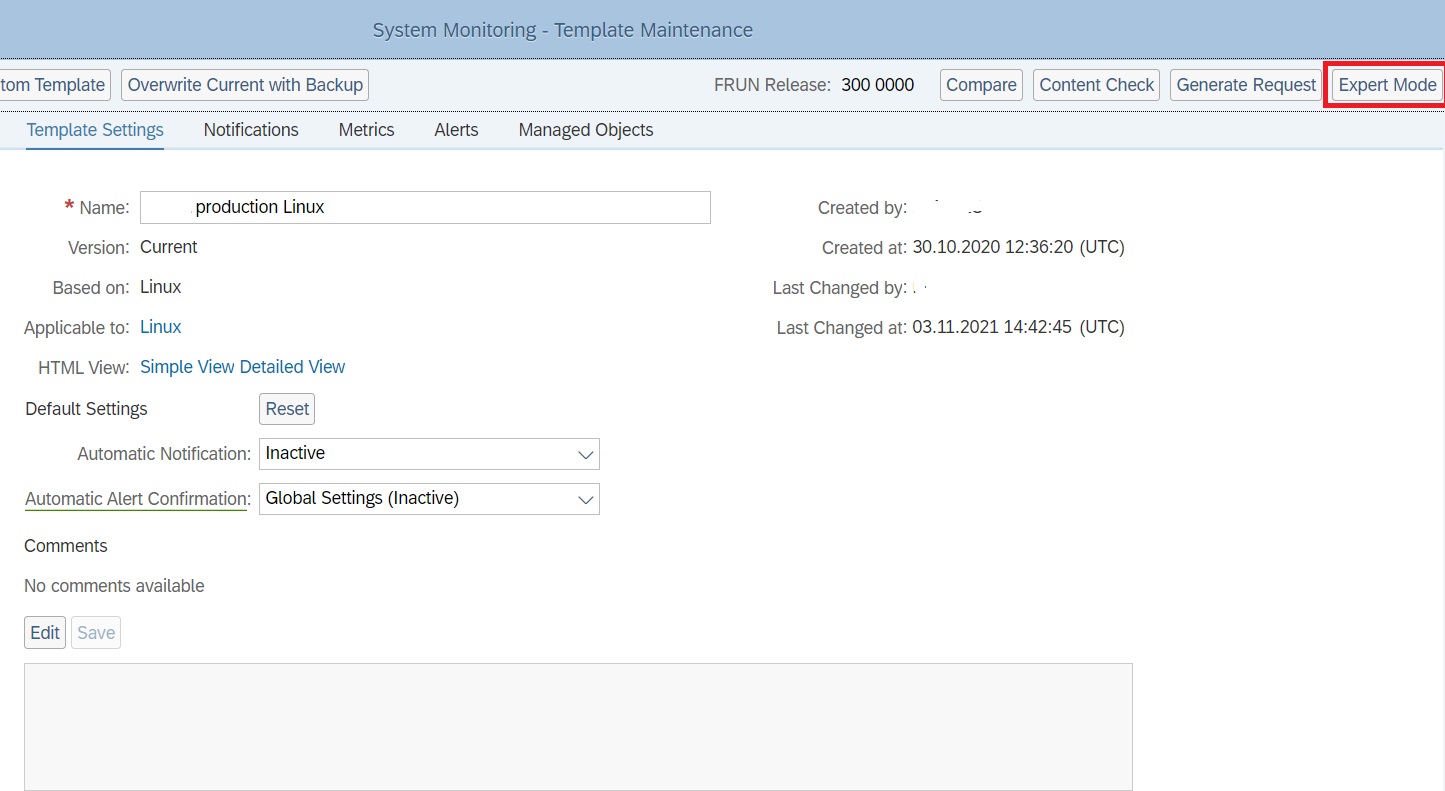
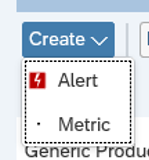
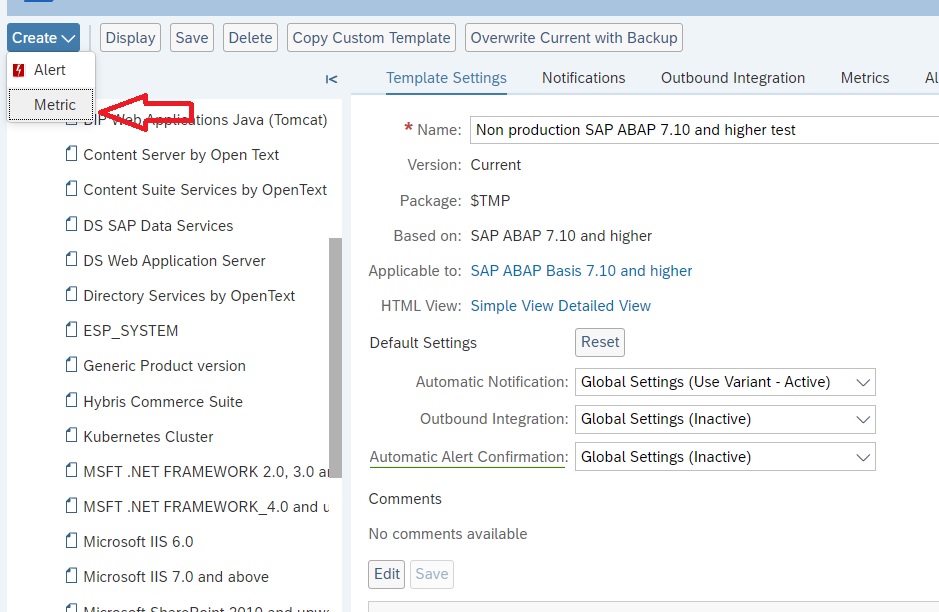
After enabling expert mode you can click on Create button. Select Metric in the drop down from Create button.
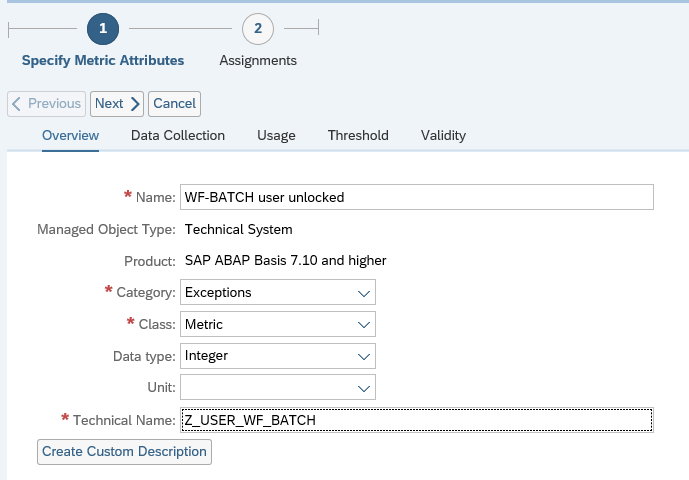
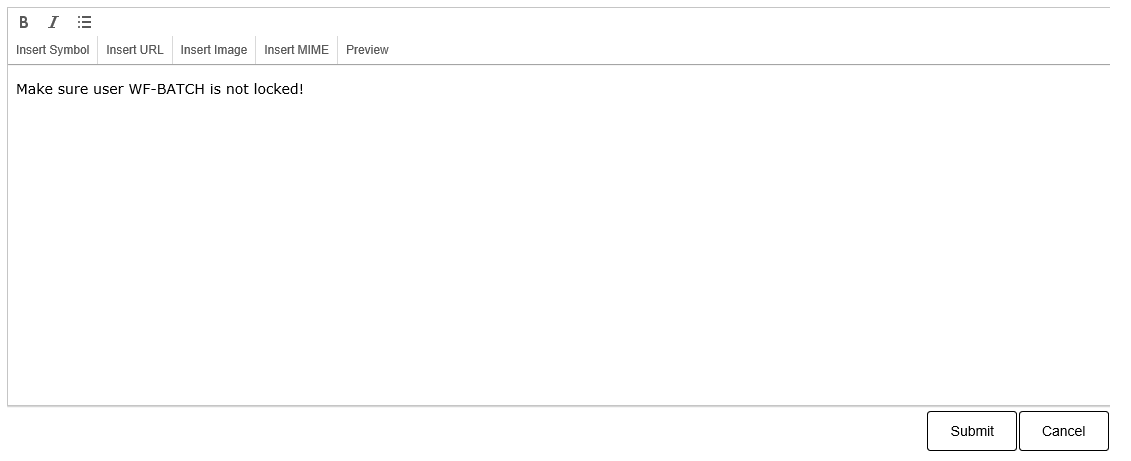
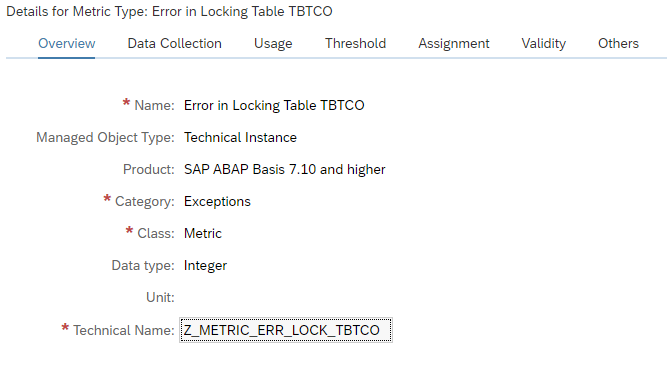
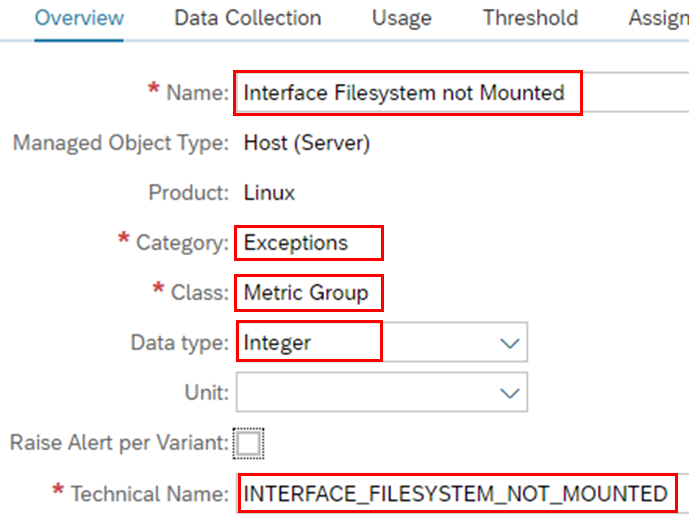
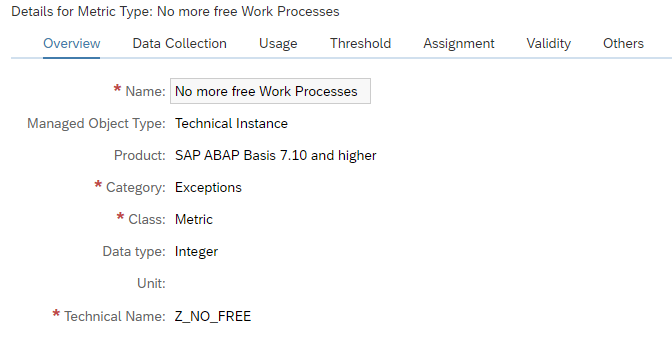
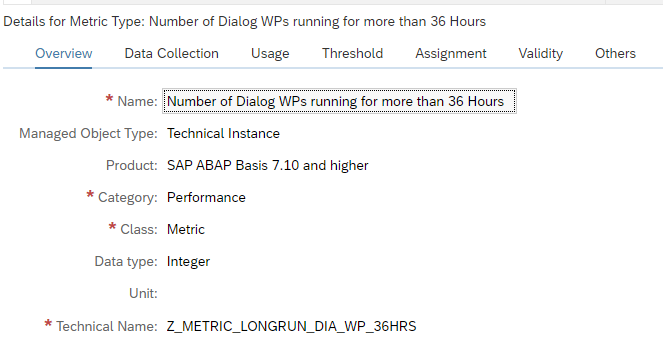
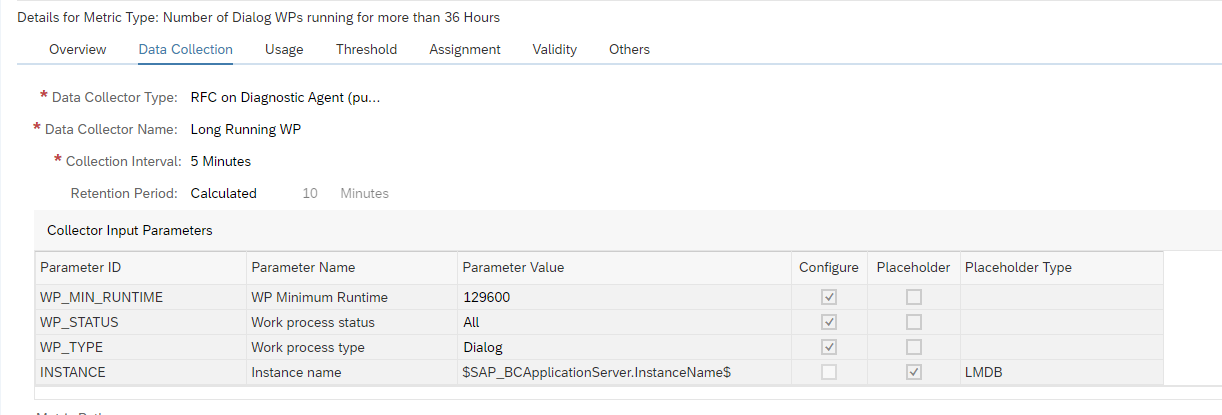
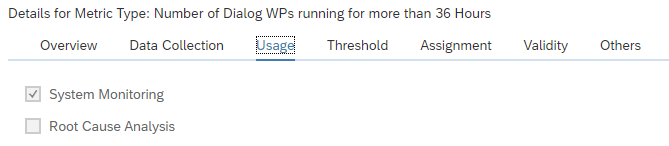
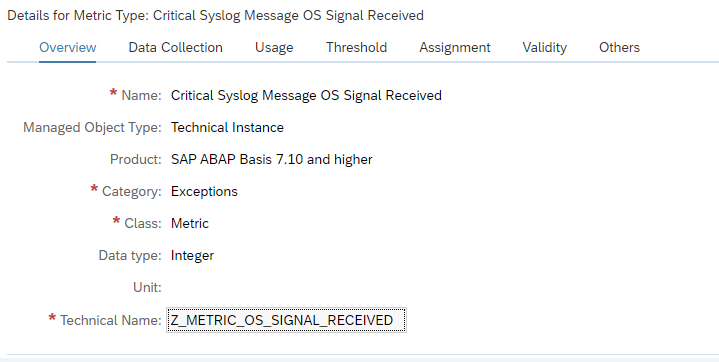
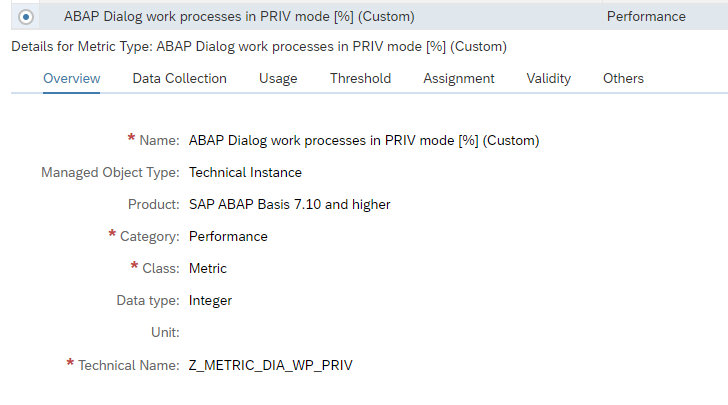
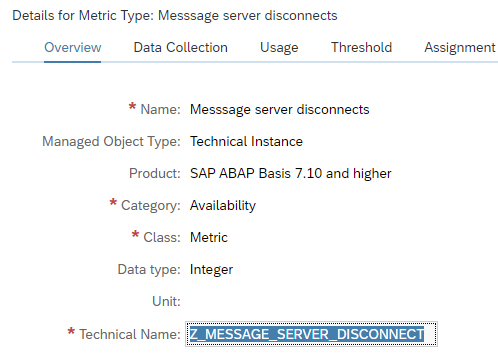
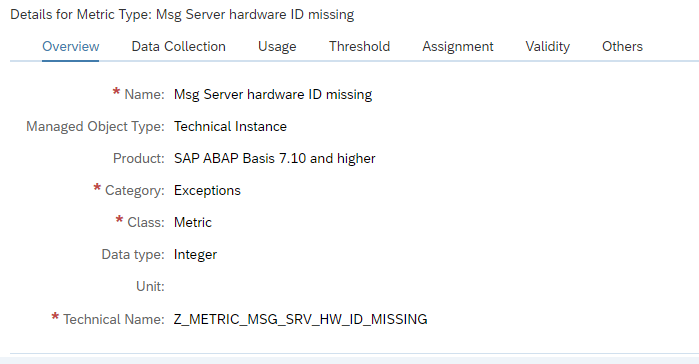
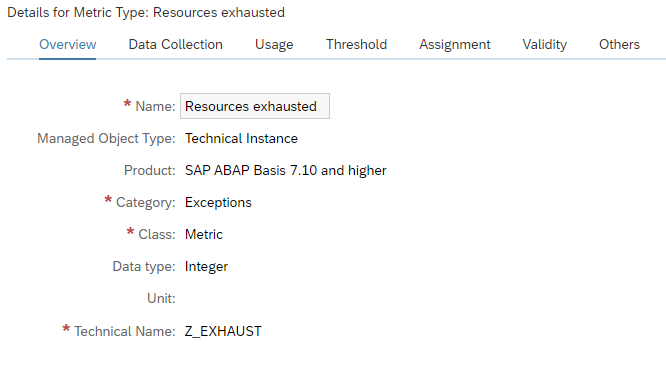
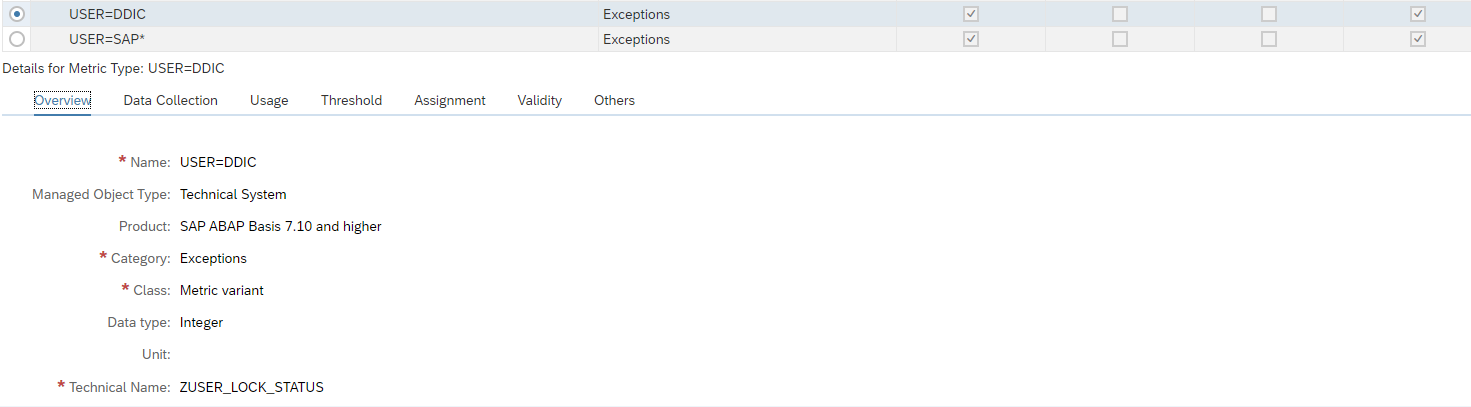
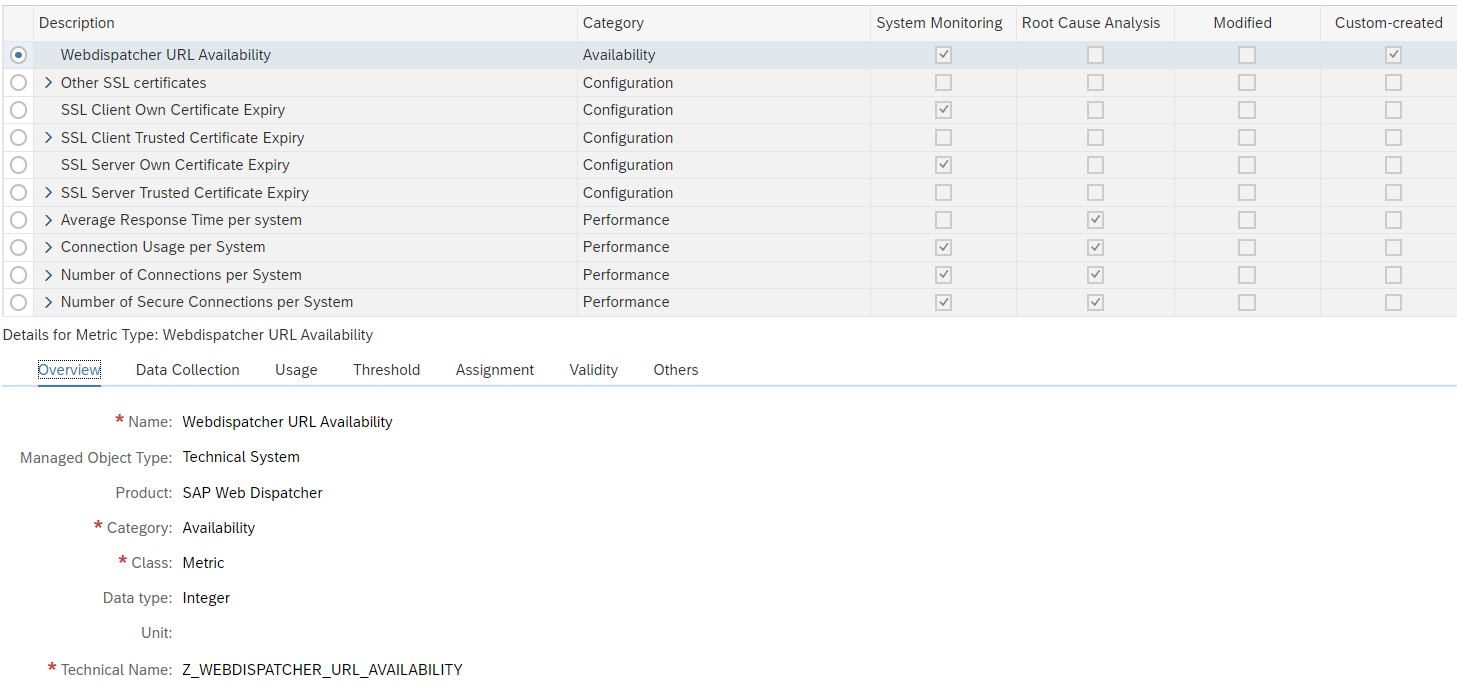
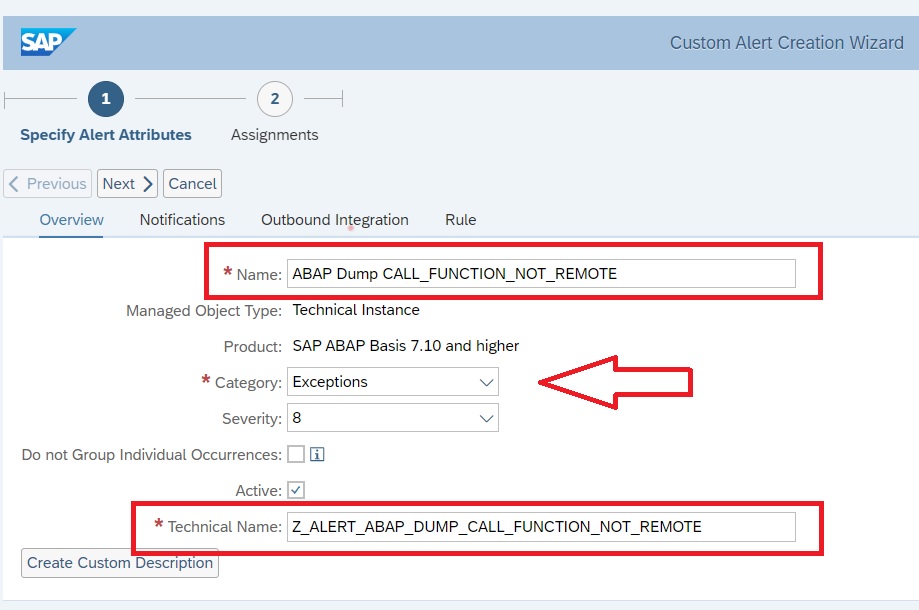
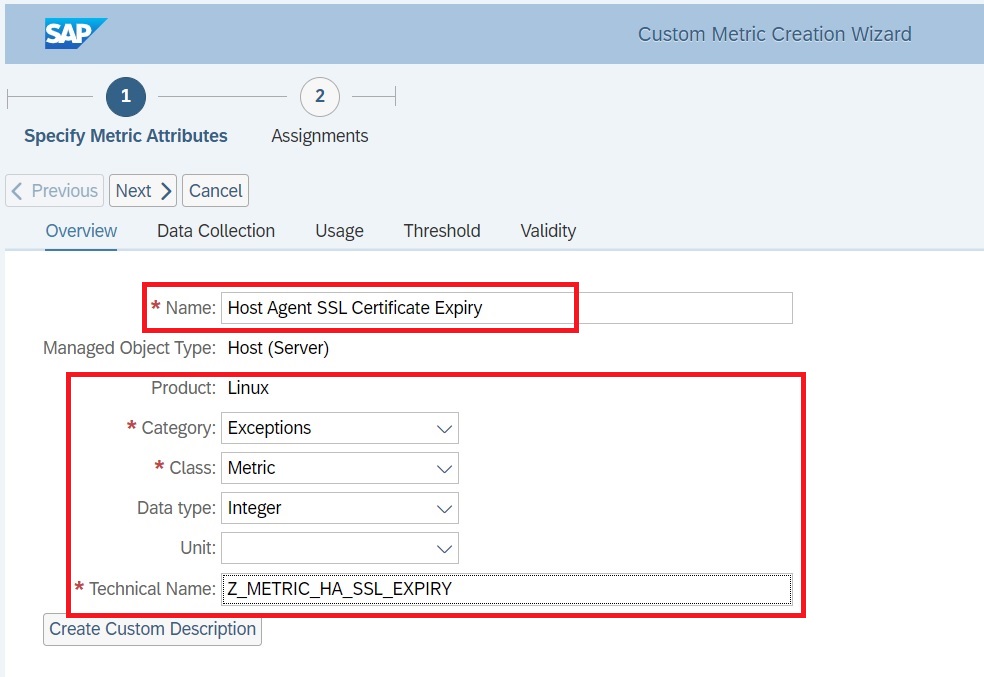
In the Metric creation pane, under Overview tab enter the details as shown below.
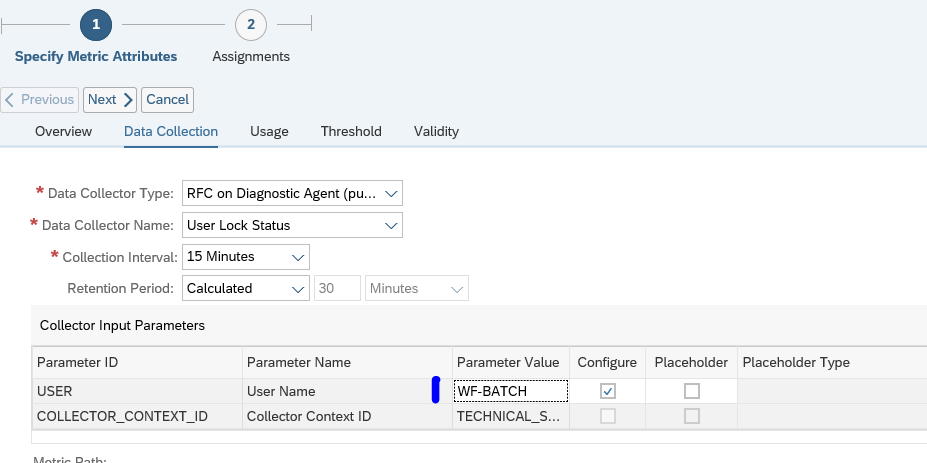
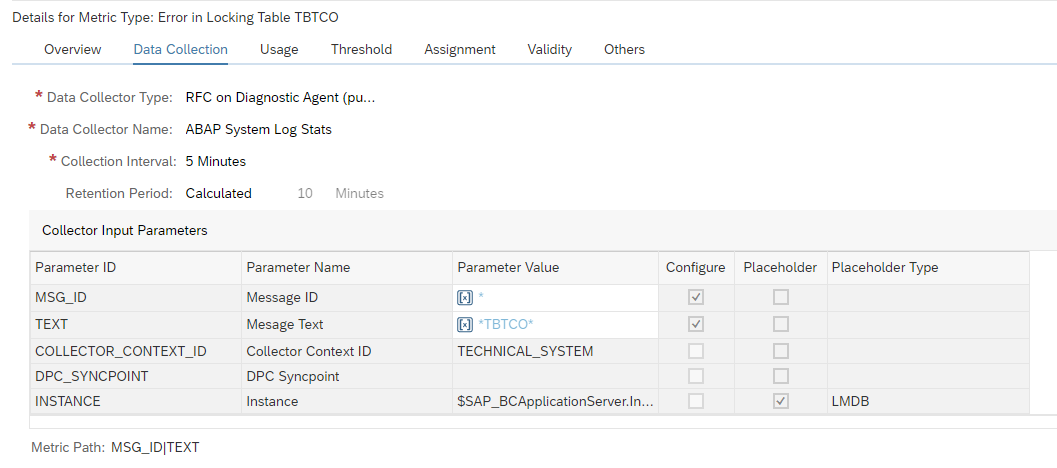
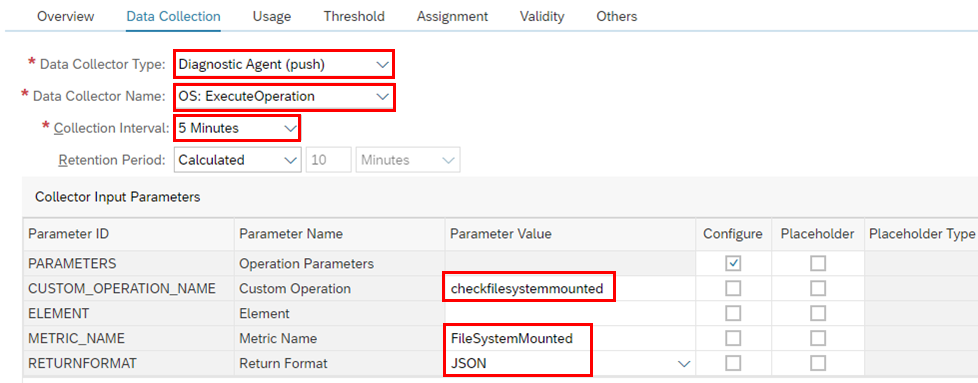
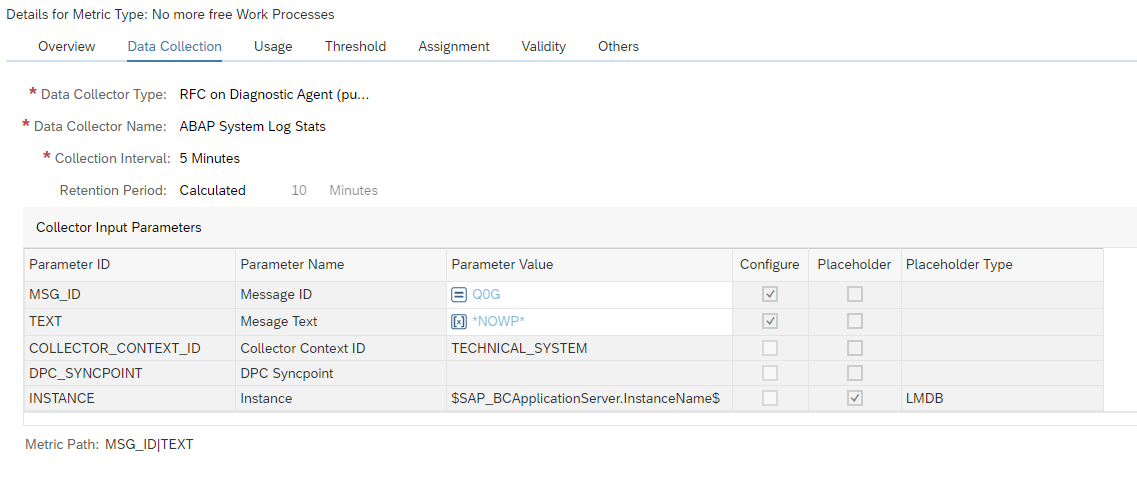
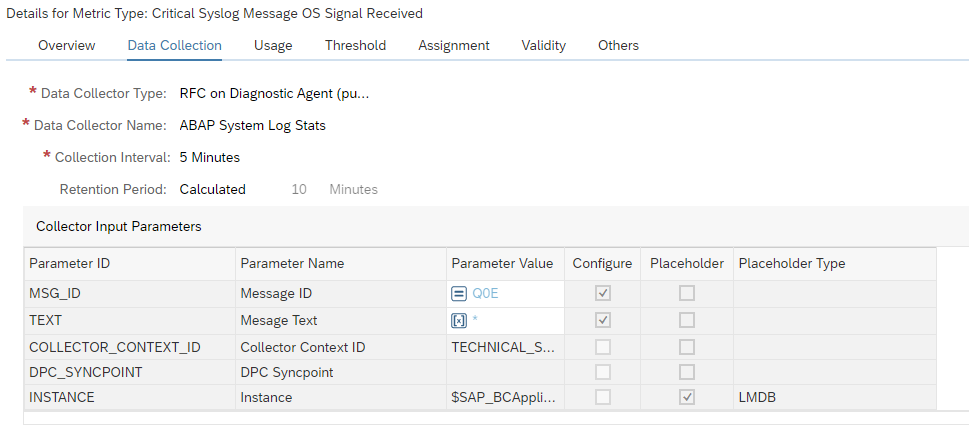
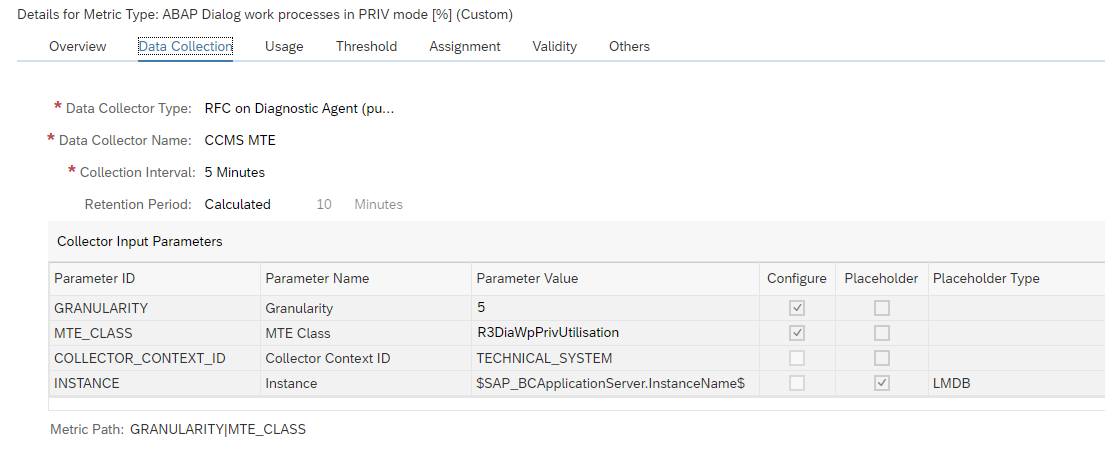
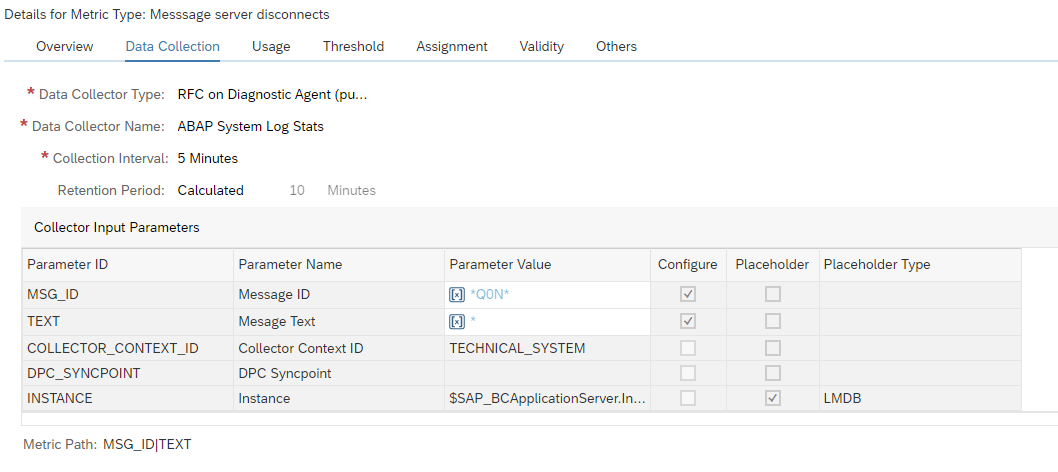
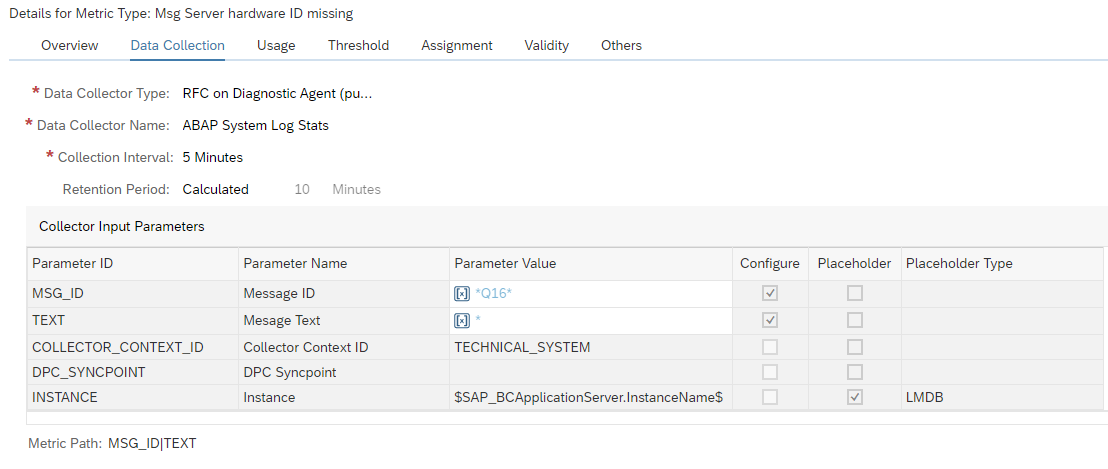
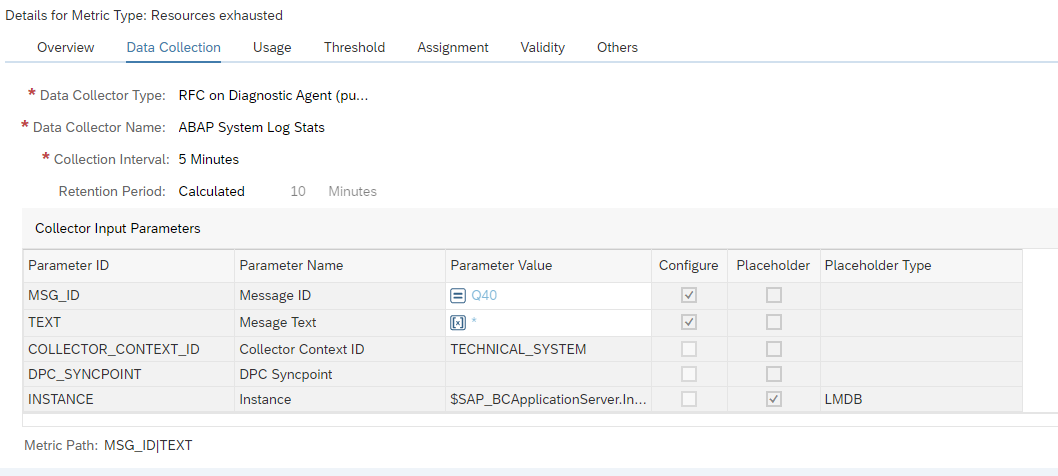
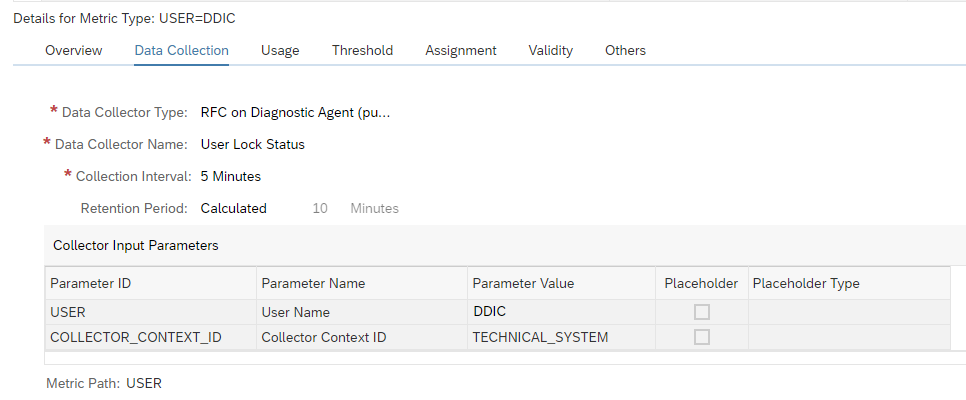
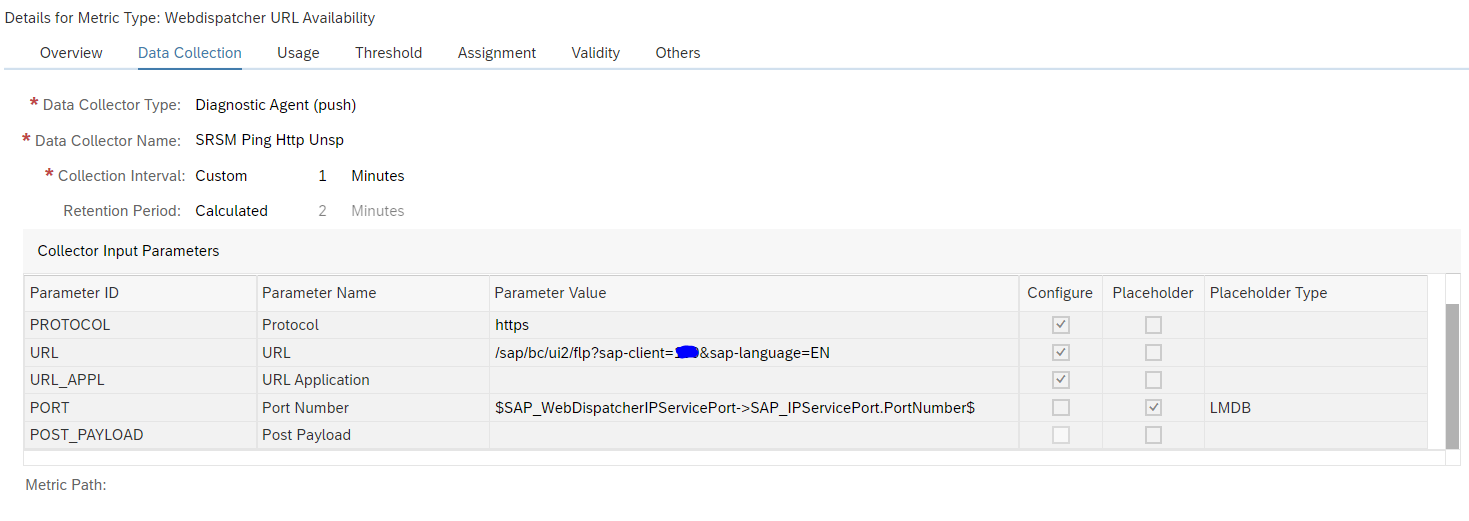
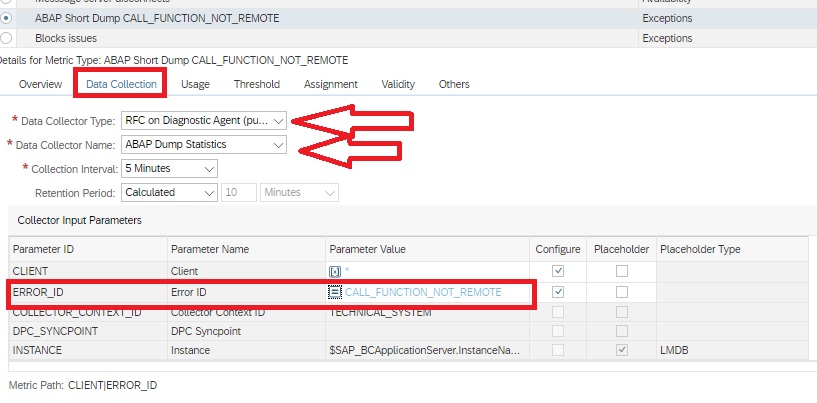
Then in the Data Collection tab, provide the details as shown below.
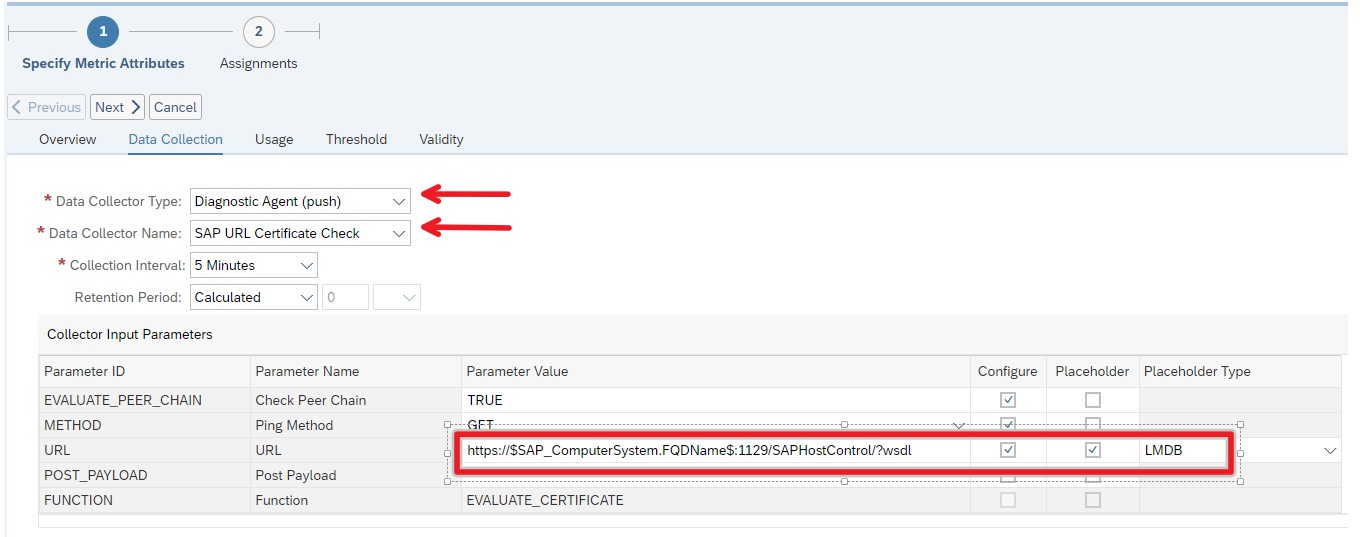
For the URL field you need to mention the URL https://$SAP_ComputerSystem.FQDName$:1129/SAPHostControl/?wsdl in which the expression $SAP_ComputerSystem.FQDName$ will dynamically resolve the respective FQDN of the host picked up from LMDB. Hence it is important to select the check box under Placeholder and select LMDB under Placeholder type.
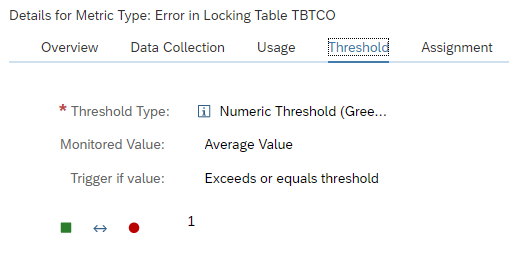
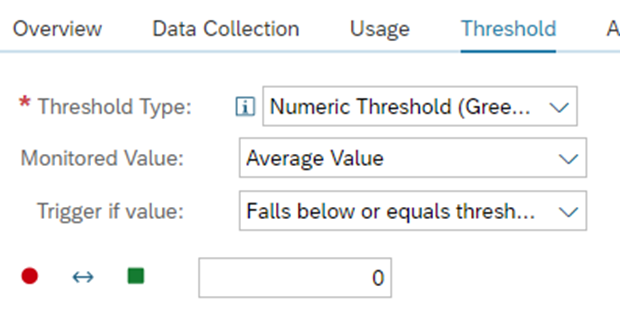
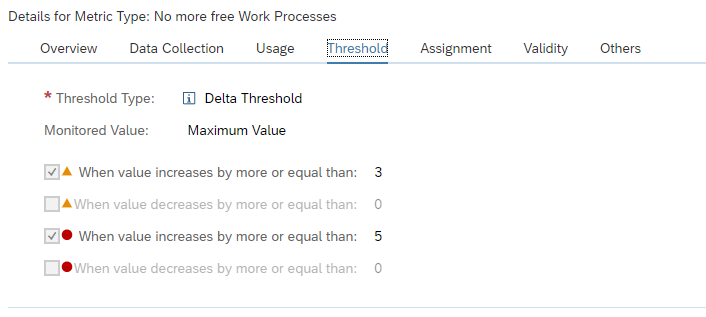
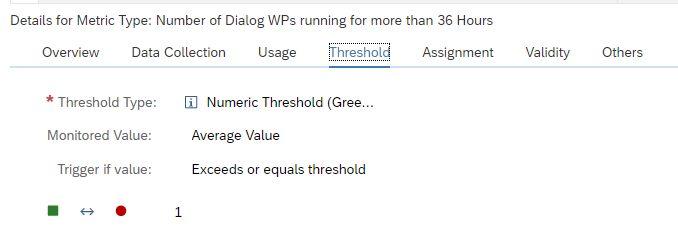
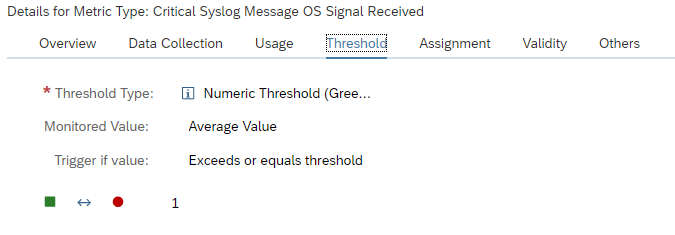
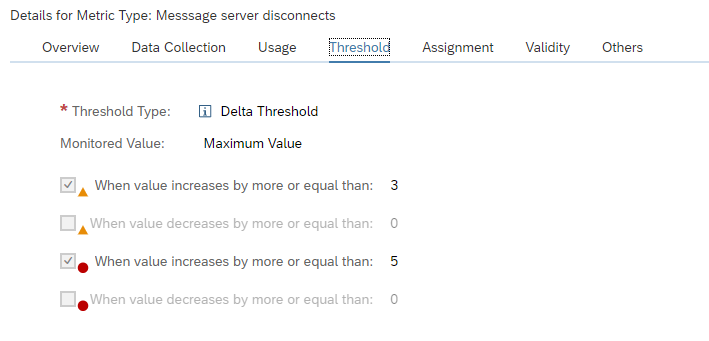
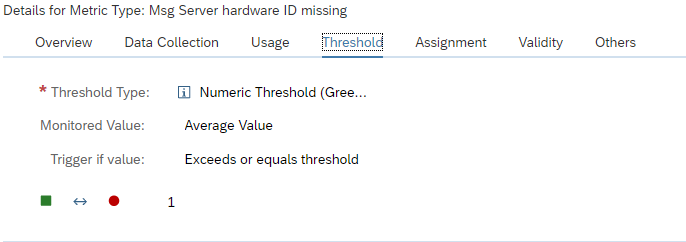
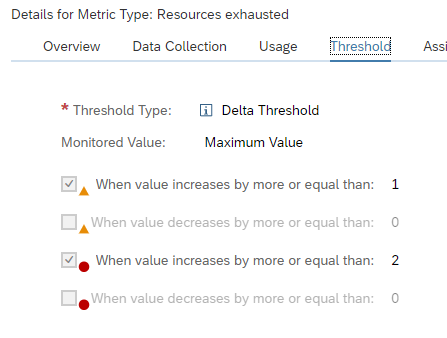
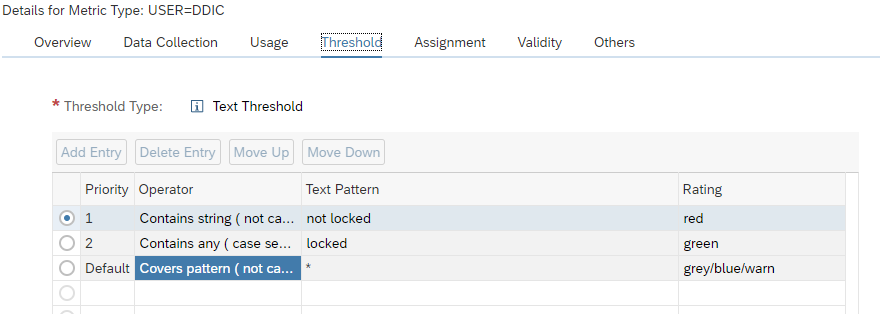
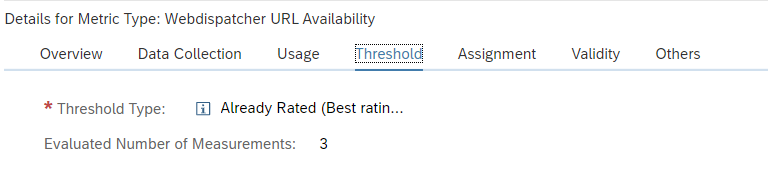
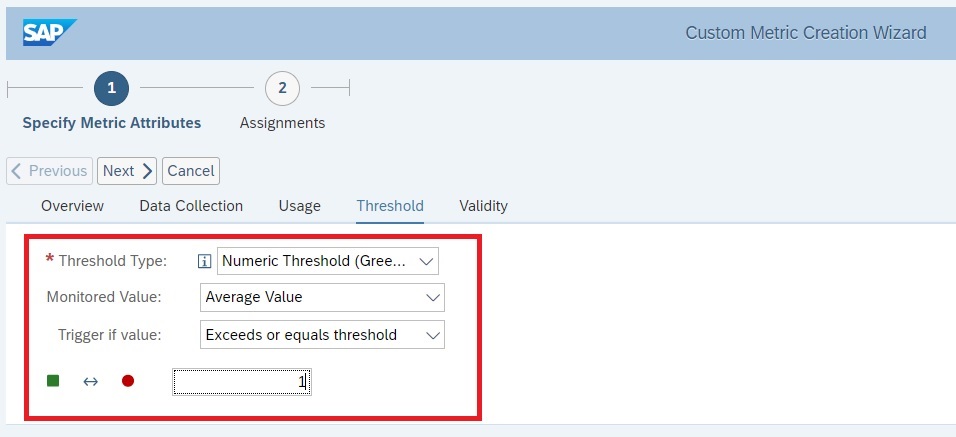
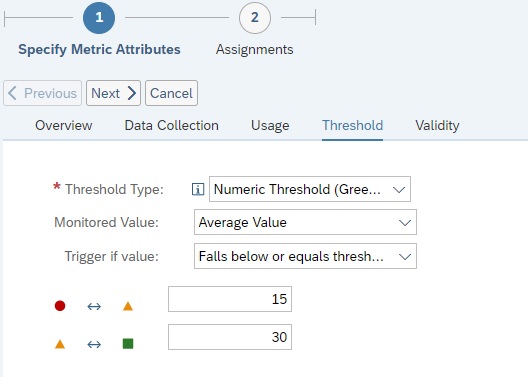
Then navigate to the Threshold tab and provide the threshold as shown below. In this example the threshold is Yellow if certificate is expiring in 30 days and Red if its expiring in 15 days.
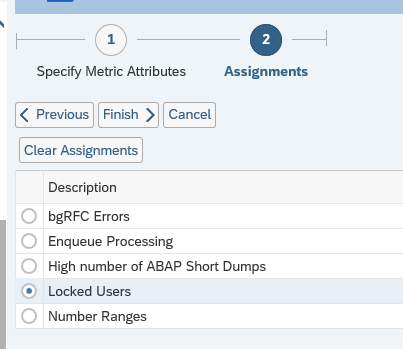
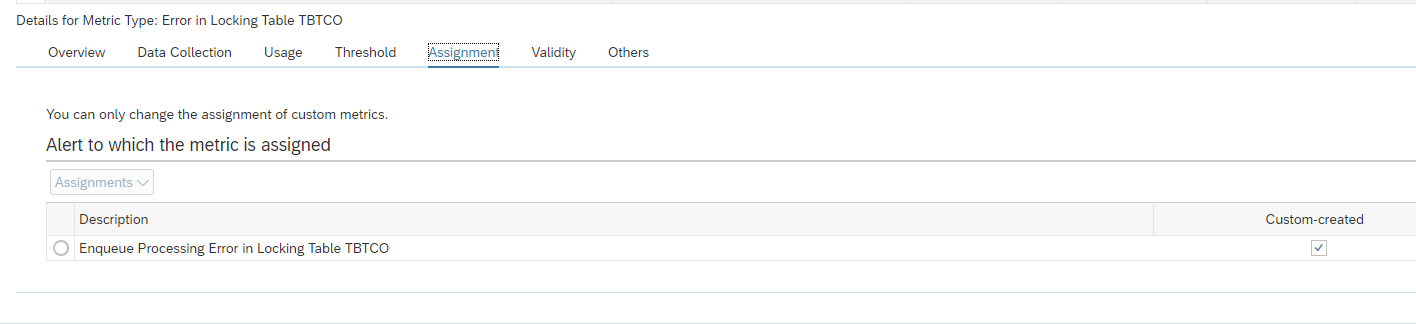
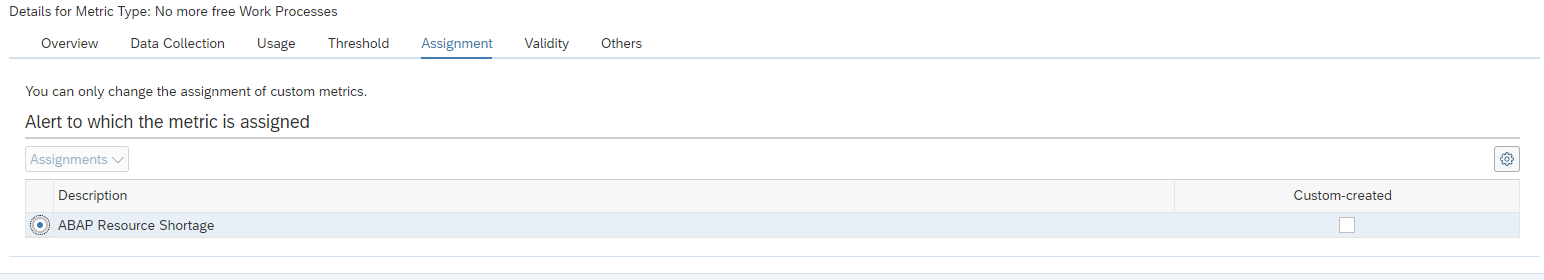
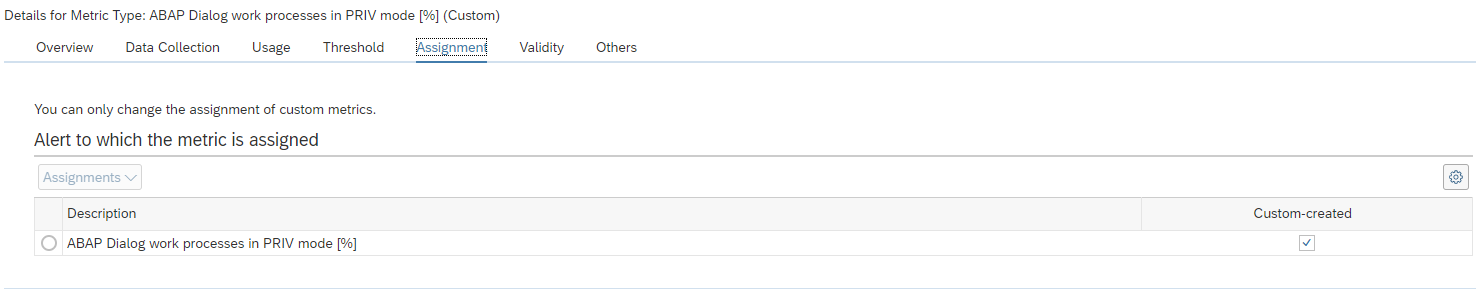
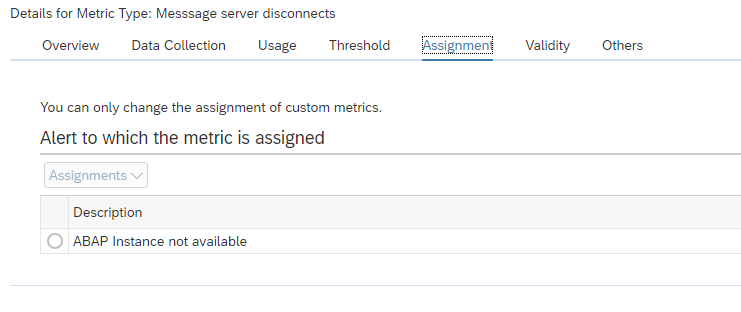
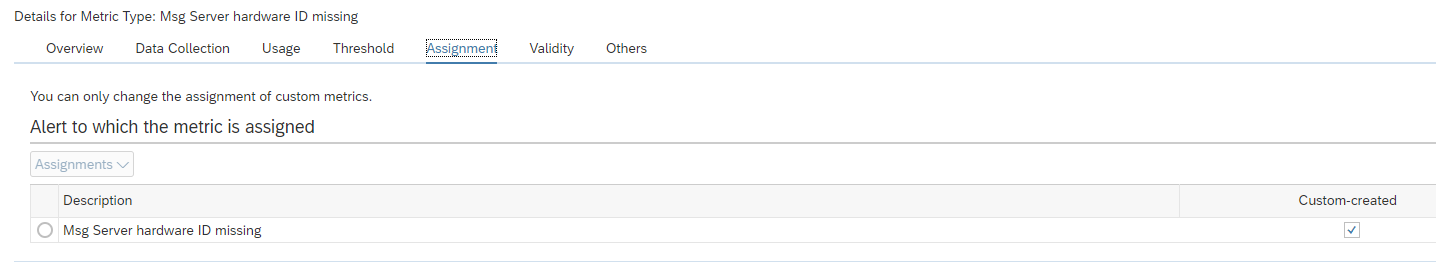
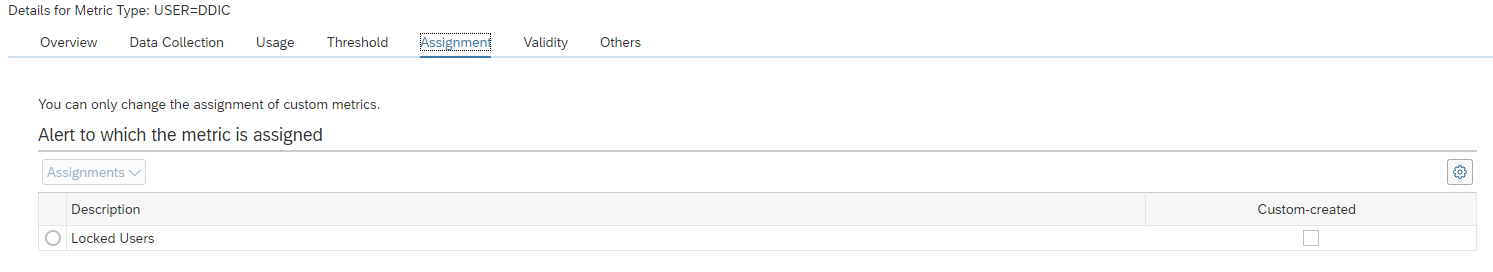
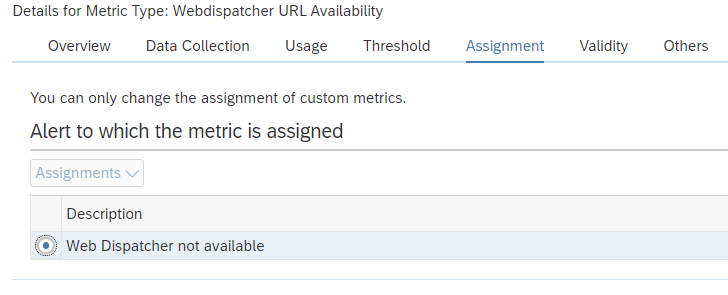
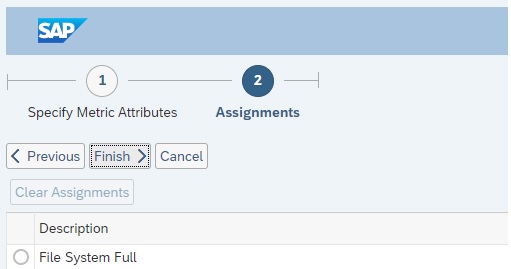
Then click on Next button to navigate to the Assignment tab where we assign this metric to an existing alert. In this step just click on the Finish button to save the metric. In this step we don’t assign to any alerts yet as we are yet to create a custom alert for this custom metric.
Step3: Create custom Alert and assign to custom Metric
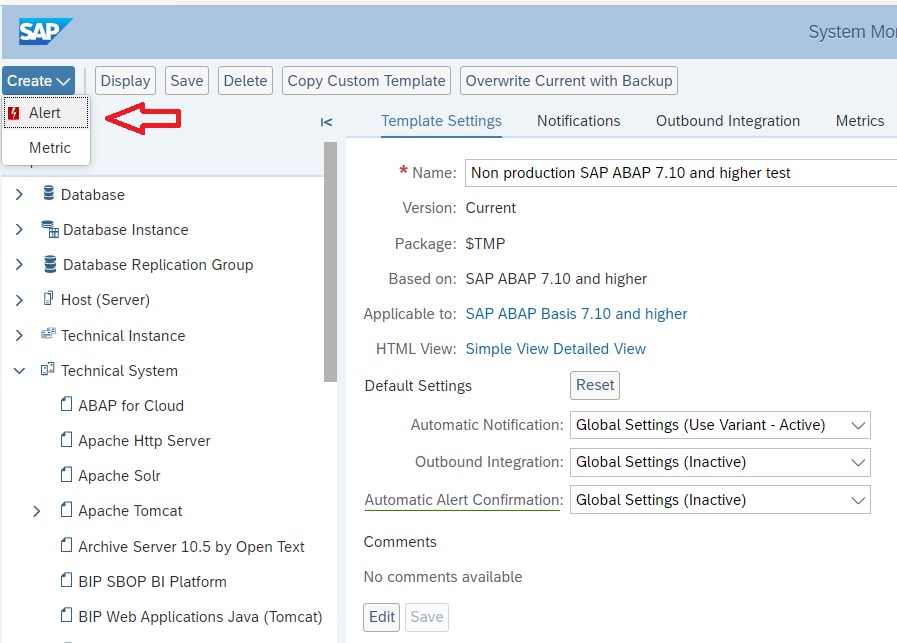
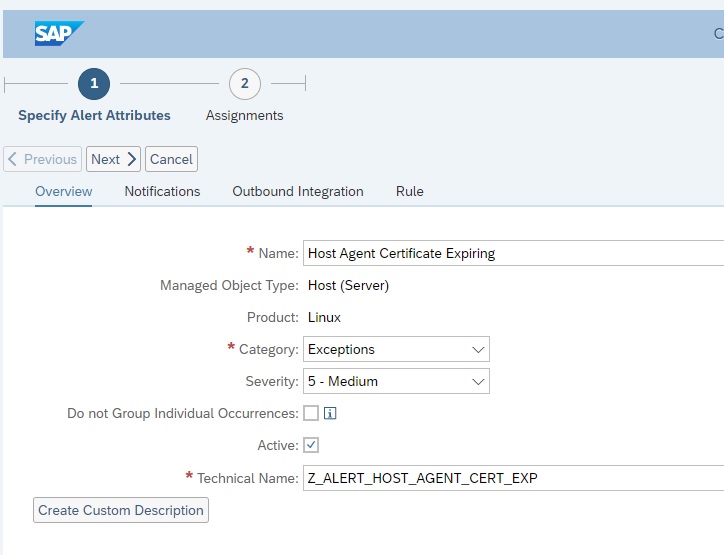
In the expert mode maintenance go to the Create button and then from the drop down select Alert.
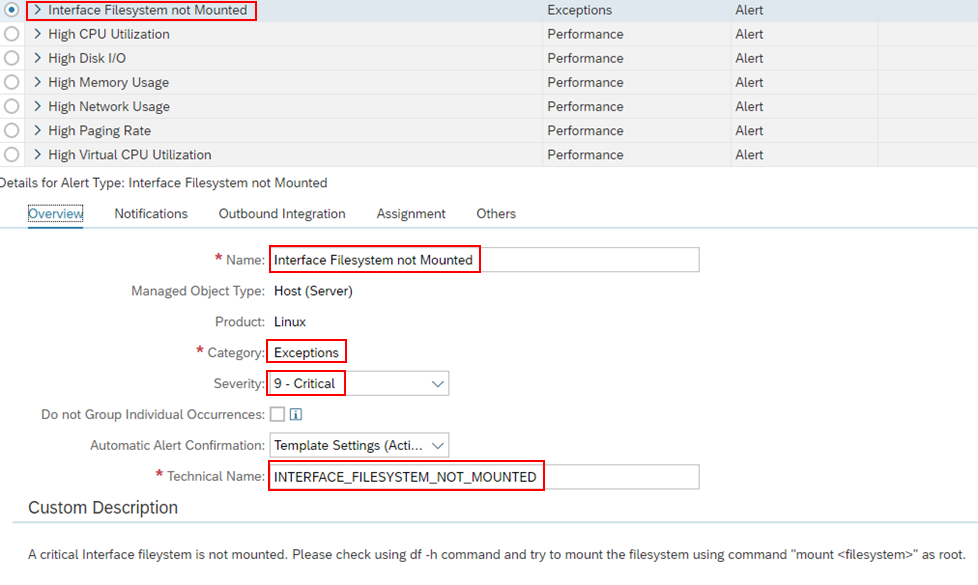
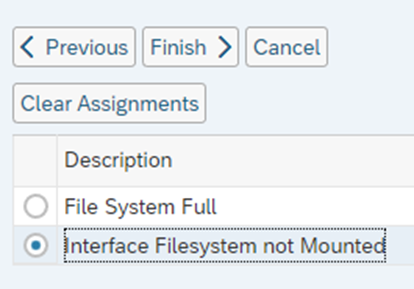
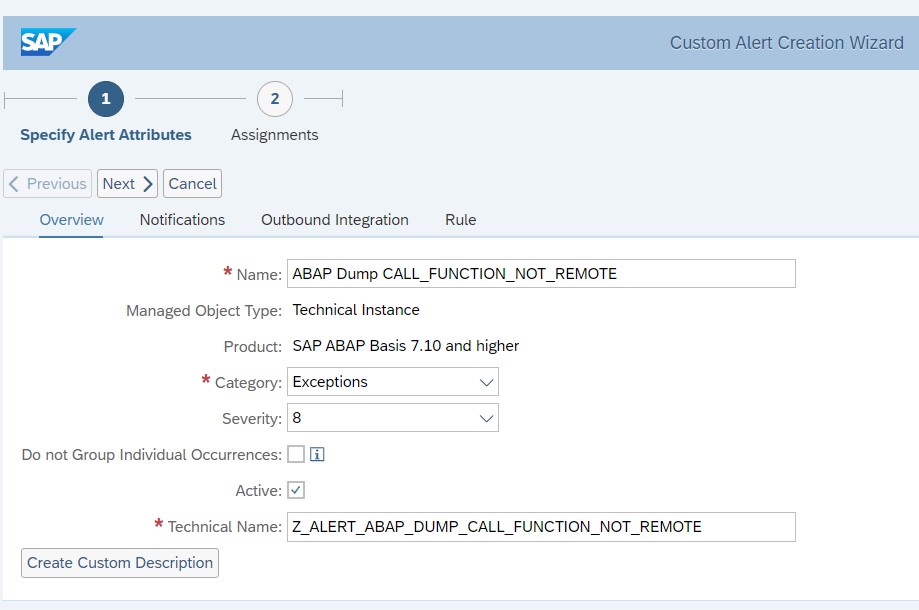
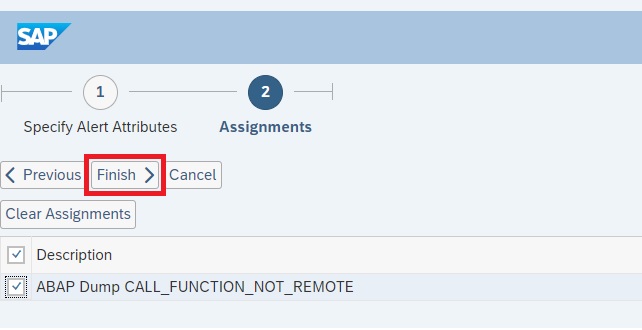
Enter the details as shown below and click on Next button.
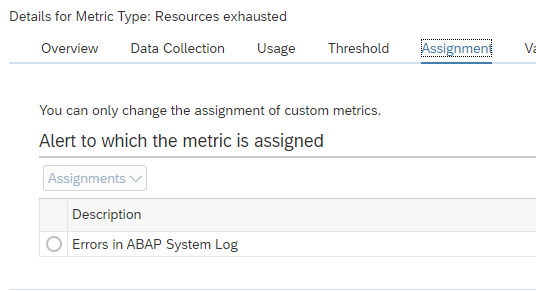
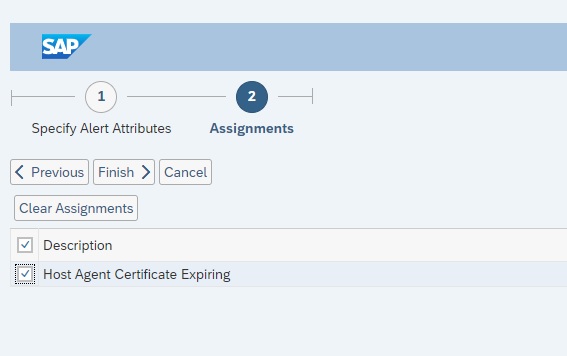
Then in the Assignments tab you will see the custom metric you just created. Select the check box for this metric and click on Finish to save the alert.
Now your custom metric is ready together with alerting active.
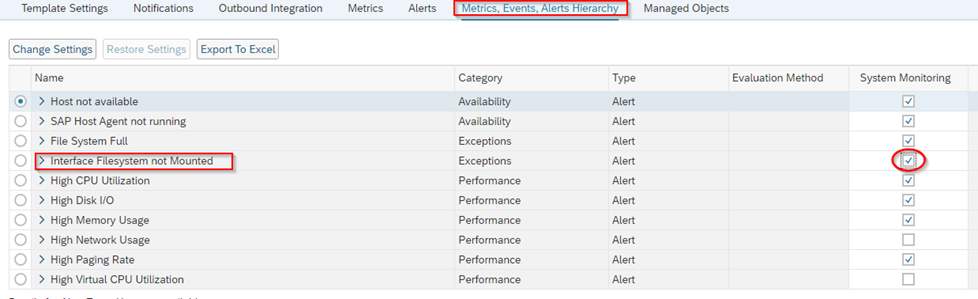
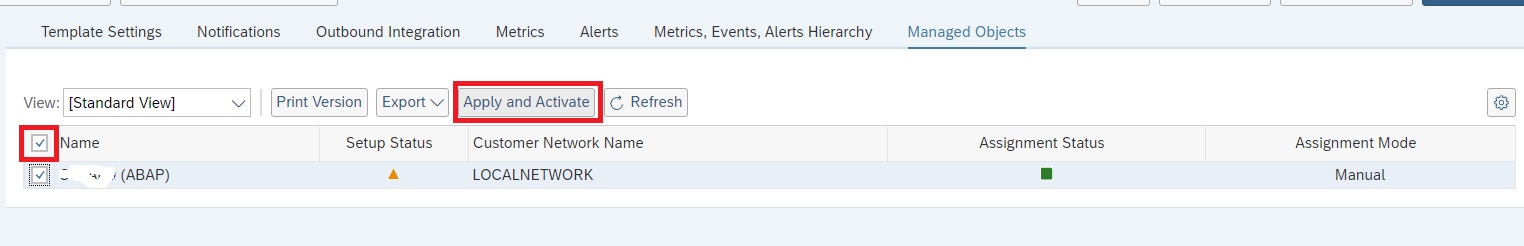
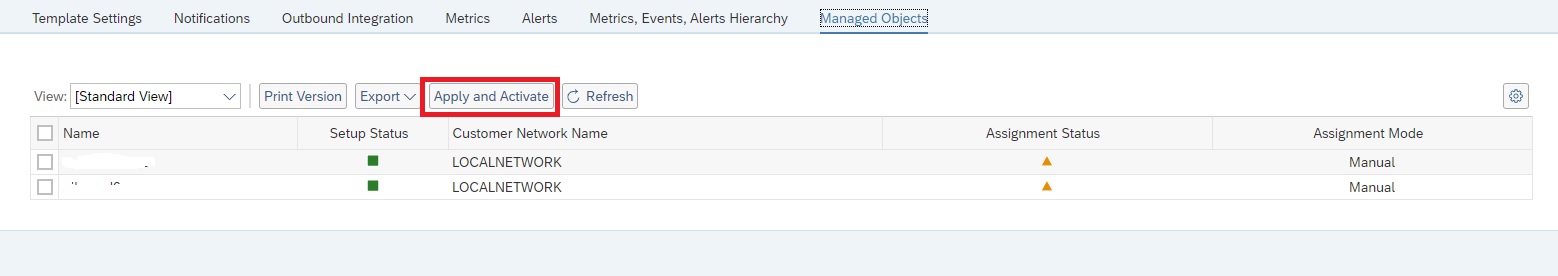
To activate this template update on all hosts navigate to Managed Objects tab for the template and click on Apply and Activate button.
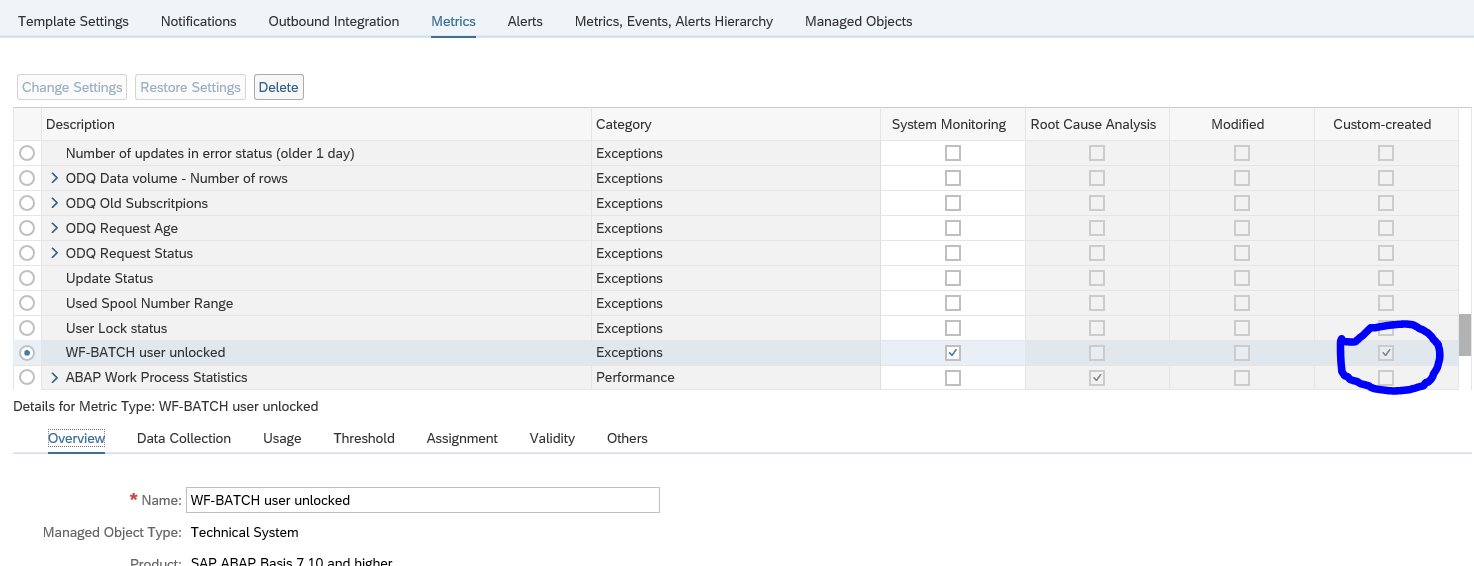
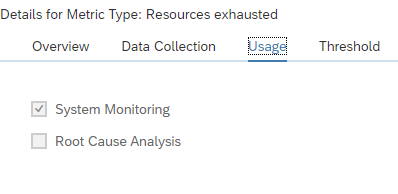
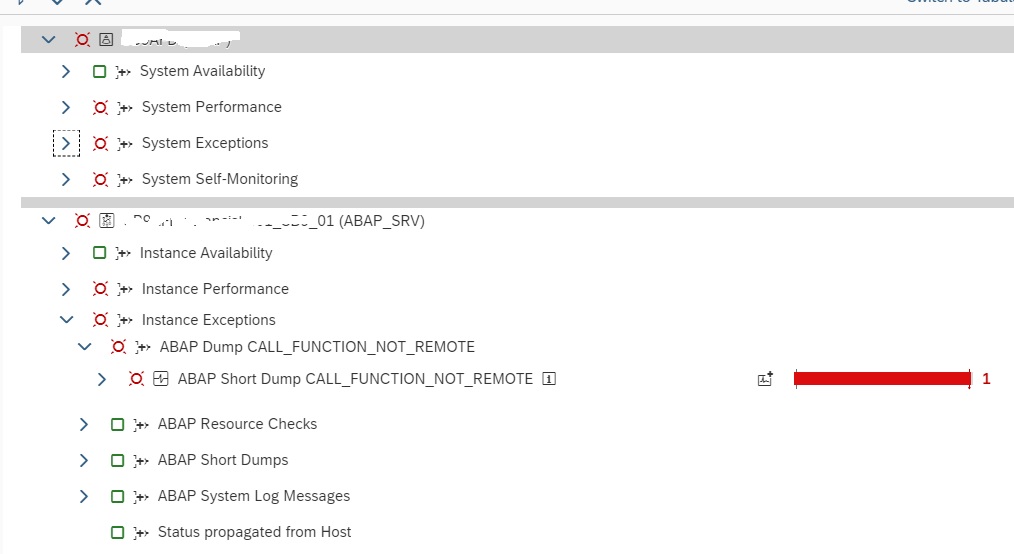
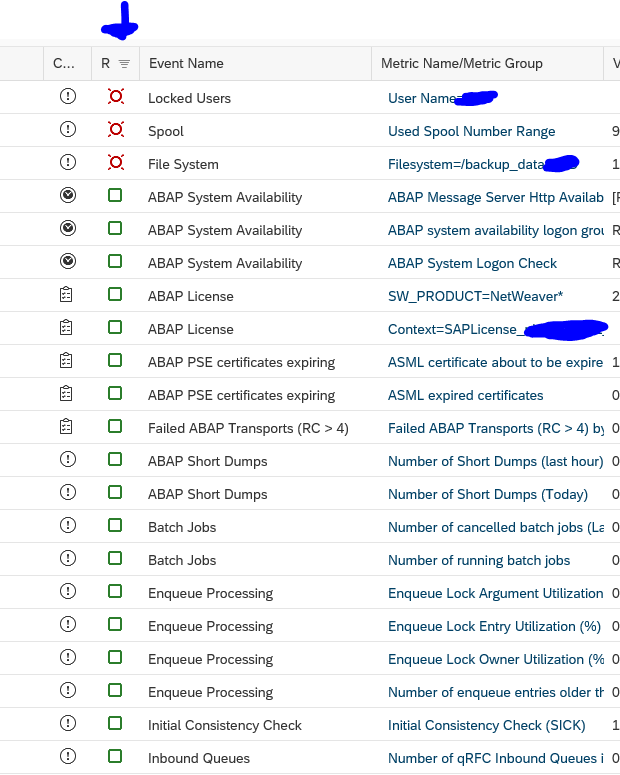
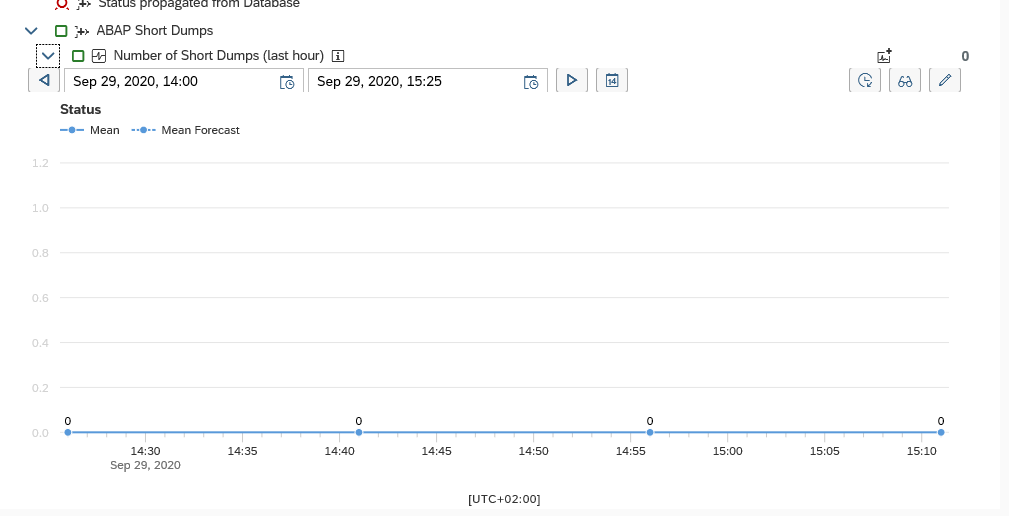
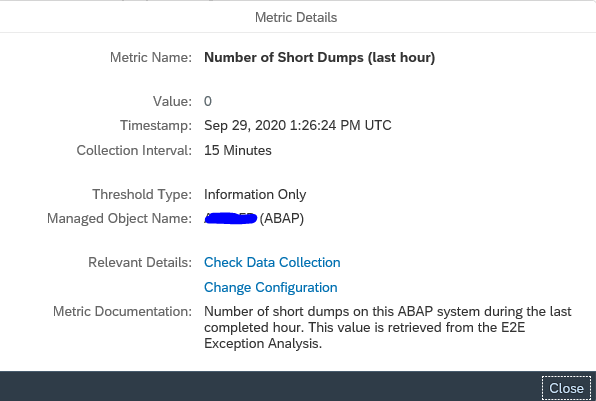
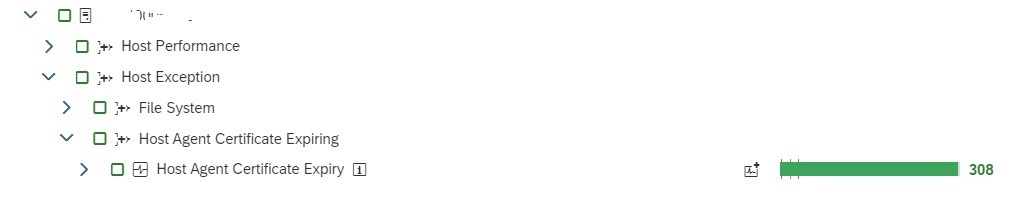
Upon activation the new metric will be available in system monitoring as shown below.
For more details on how to setup SSL for SAP Host Agent you can refer to the SAP documentation here.
SNC certificate expiry monitoring
SNC Certificate expiry is very critical for ABAP systems where SNC logon is used. As soon as the certificate expires users will no more be able to login to system.
In System Monitoring for ABAP systems SAP provides a standard metric called Expiring PSE Certificates which monitors all PSE certificates that includes SNC certificates. When this metric turns red it will tell how many certificates are expiring/expired but not which one. Hence its beneficial to monitor separately the status of SNC Certificates.
This monitoring can be achieved by using Configuration Validation.
You can create a custom policy with the below XML code that checks the PSE_CERT store to check on status of SNC Certificate.
<?xml version="1.0" encoding="utf-8"?>
<targetsystem desc="SNC Certificate about to expire" id="SNCERT_TOBE_EXP" multisql="Yes" version="0000">
<configstore name="PSE_CERT" system_type="ABAP">
<checkitem desc="Valid in range" id="1" operator="">
<compliant>APPLICATION like '%SNCS%' and CONTEXT like '%' and TYPE like '%' and SUBJECT like '%sapci%' and ISSUER like '%' and SERIALNO like '%' and VALID_FROM like '%' and ( ( ( replace_regexpr ('^$' IN valid_to WITH (replace(current_date, '-', '')||replace(current_time, ':', '')))) > to_number(replace(add_days(current_date, 30), '-', '')||replace(current_time, ':', '') ))
or (( replace_regexpr ('^$' IN valid_to WITH (replace(current_date, '-', '')||replace(current_time, ':', '')))) < to_number(replace(add_days(current_date, 0), '-', '')||replace(current_time, ':', '') )) )</compliant>
<noncompliant>APPLICATION like '%SNCS%' and CONTEXT like '%' and TYPE like '%' and SUBJECT like '%sapci%' and ISSUER like '%' and SERIALNO like '%' and VALID_FROM like '%' and not ( ( ( replace_regexpr ('^$' IN valid_to WITH (replace(current_date, '-', '')||replace(current_time, ':', '')))) > to_number(replace(add_days(current_date, 30), '-', '')||replace(current_time, ':', '') ))
or (( replace_regexpr ('^$' IN valid_to WITH (replace(current_date, '-', '')||replace(current_time, ':', '')))) < to_number(replace(add_days(current_date, 0), '-', '')||replace(current_time, ':', '') )) )</noncompliant>
</checkitem>
</configstore>
</targetsystem>
Note: In the above XML code, SUBJECT like ‘%sapci%’, you have to replace sapci with a hostname pattern that you use for all your SAP ABAP system hostnames.
Once you have created the policy, you can directly activate alerting on the policy.
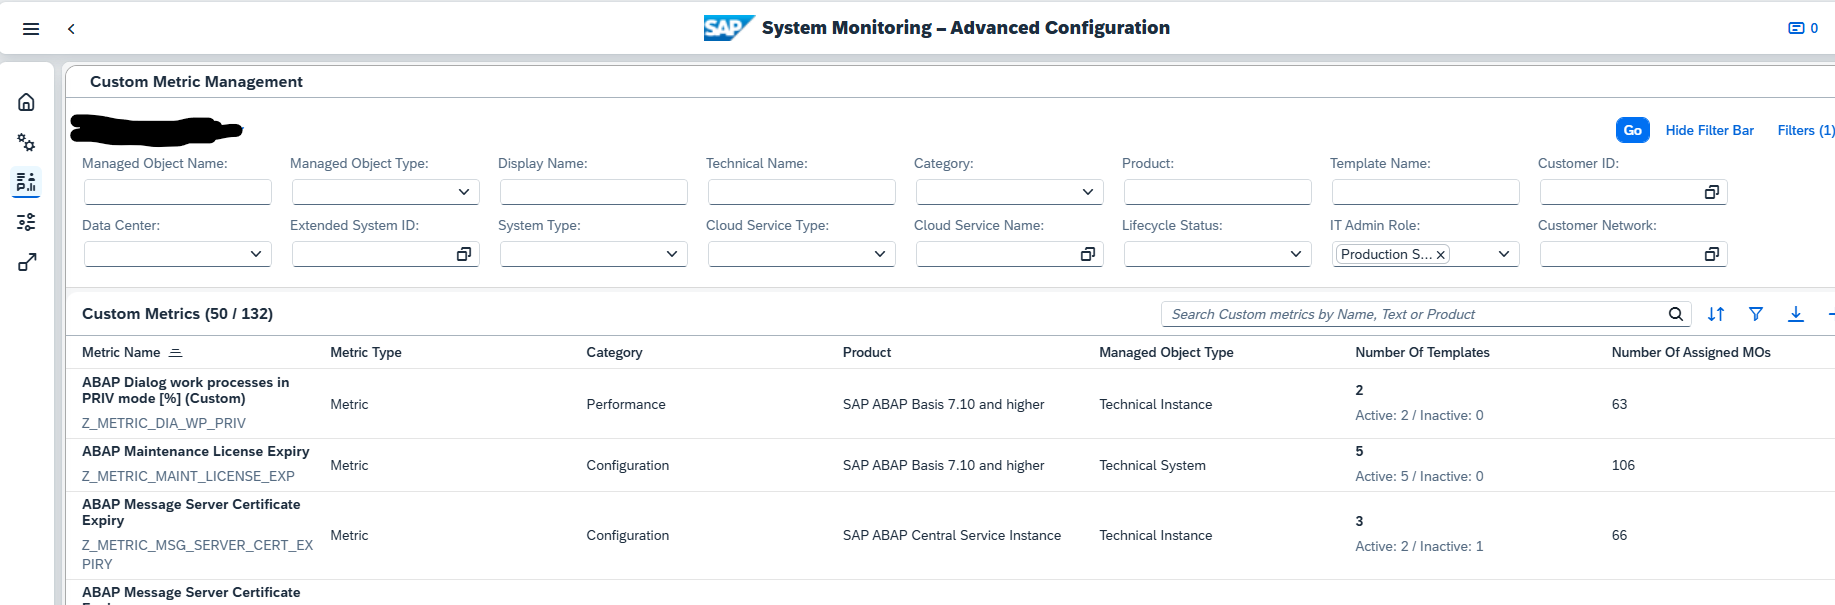
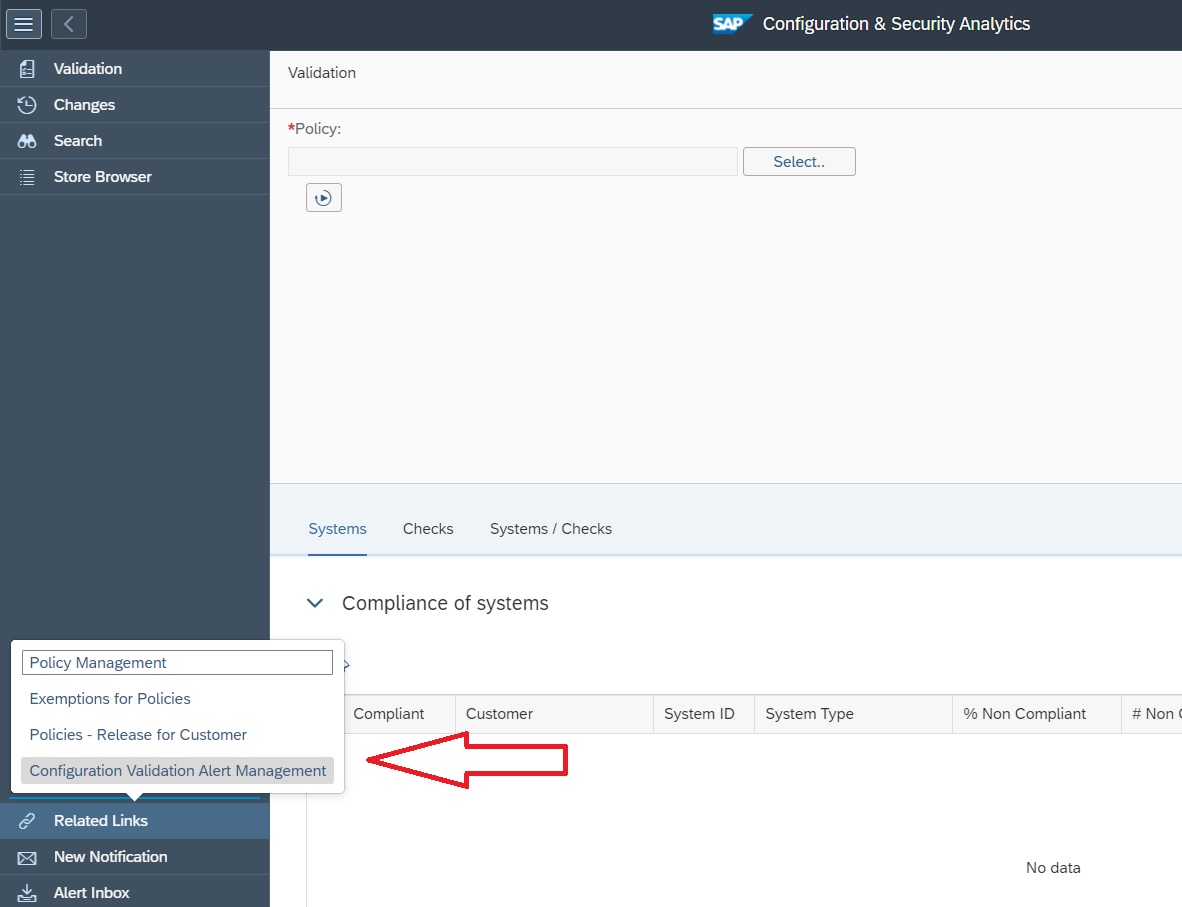
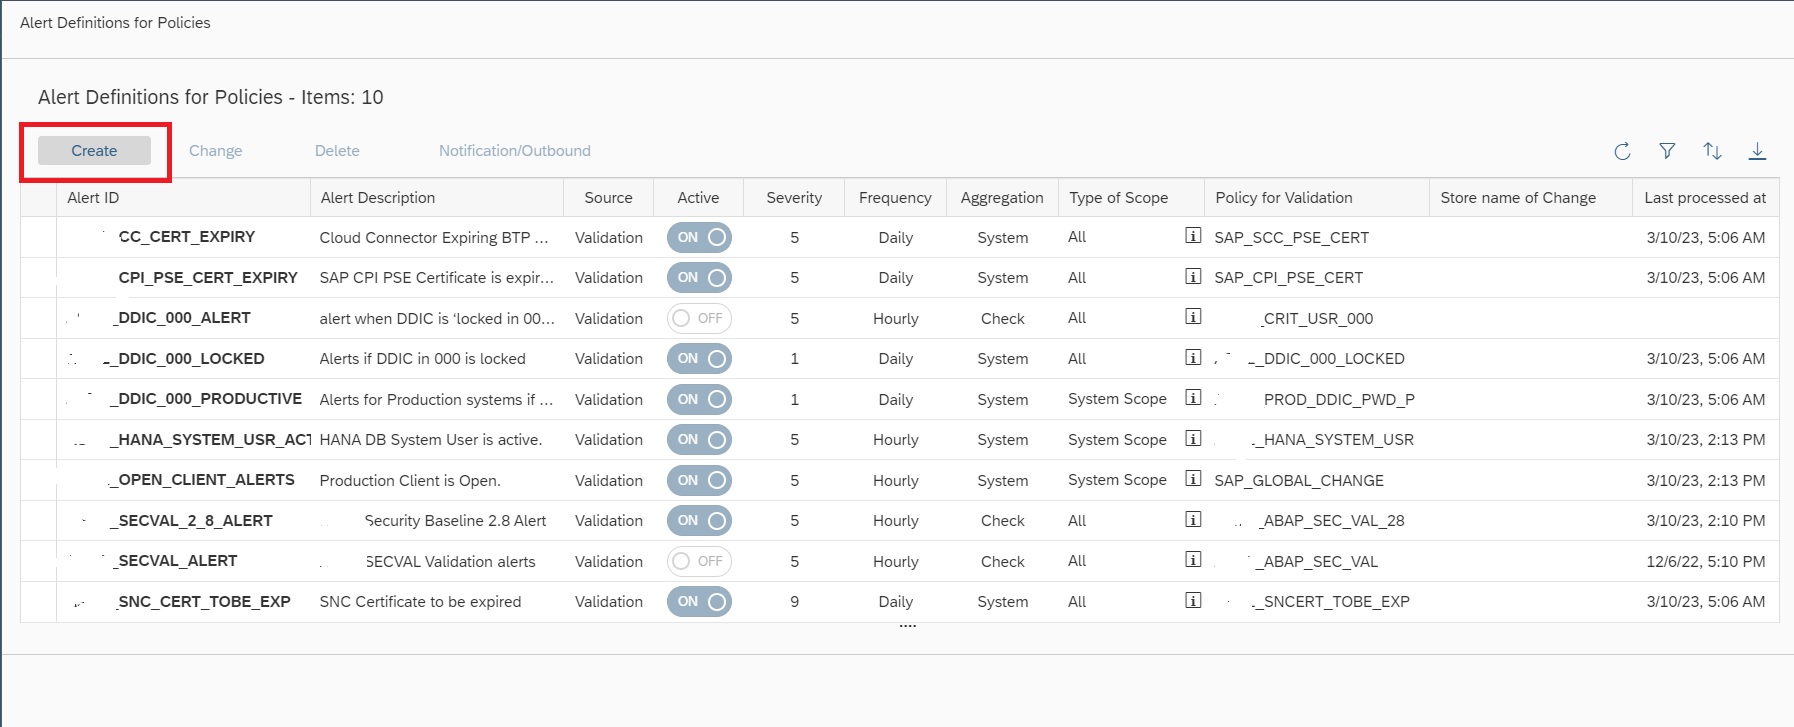
For that go to the Configuration and Security Analytics app in the Advanced Configuration Monitoring area.
In the app navigate to Configuration Validation Alert Management under the the Related links tab.
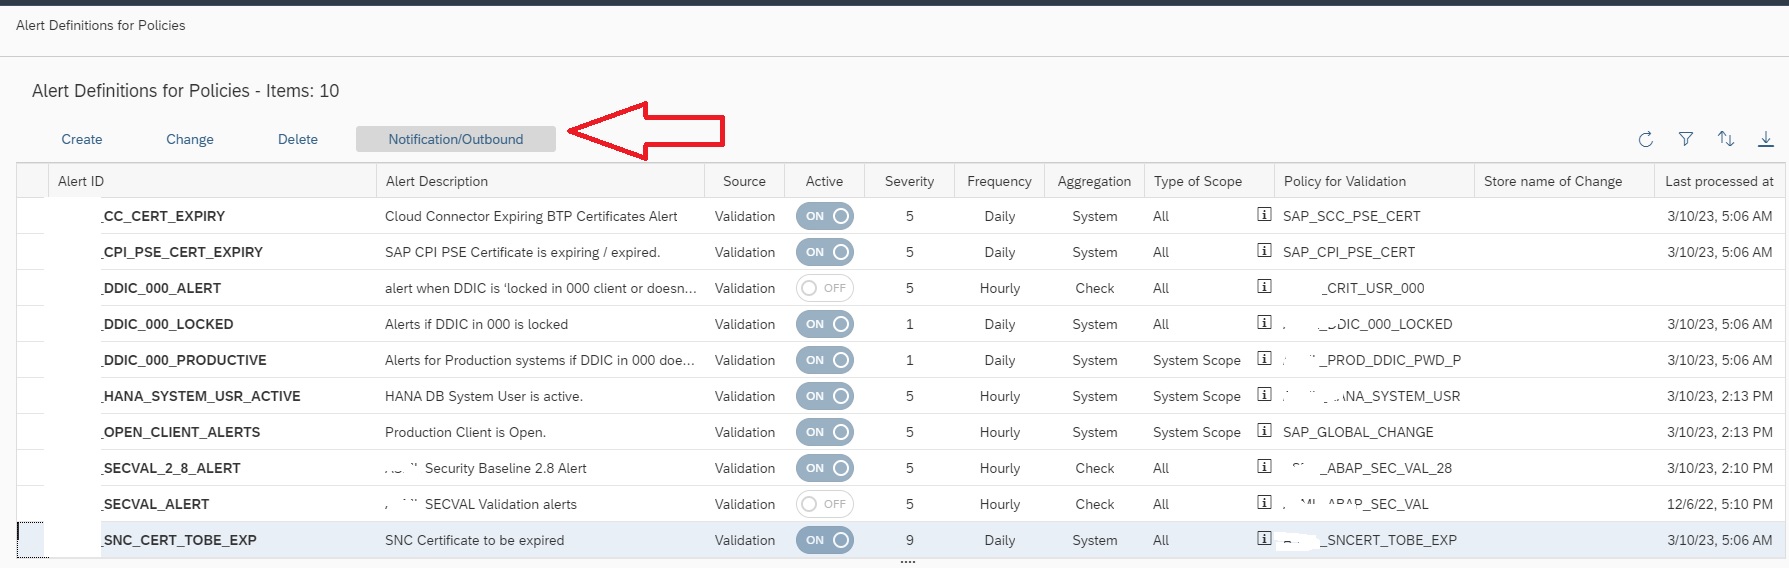
In the Alert Management app click on Create button to create the alerting for the policy you just created.
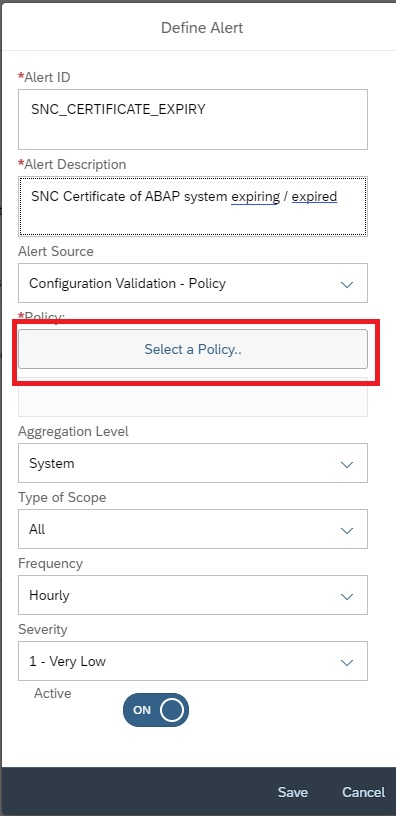
In the next popup, enter details as shown below and then click on Select policy to select the policy for which you want to activate the alert.
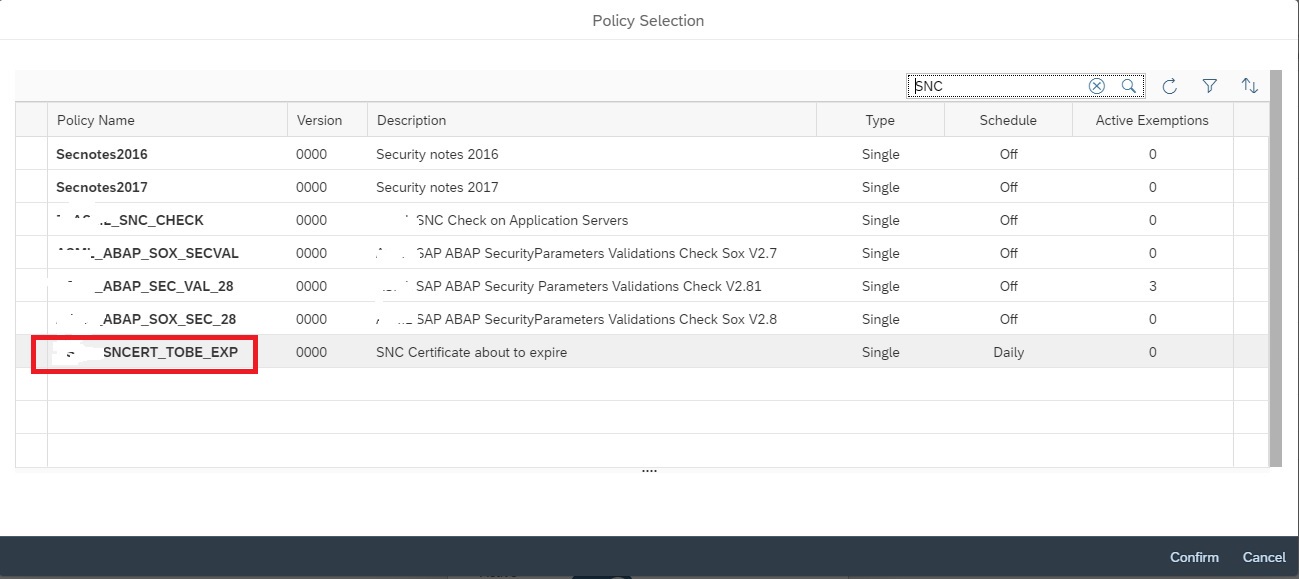
In the next popup select the policy by clicking on the policy name.
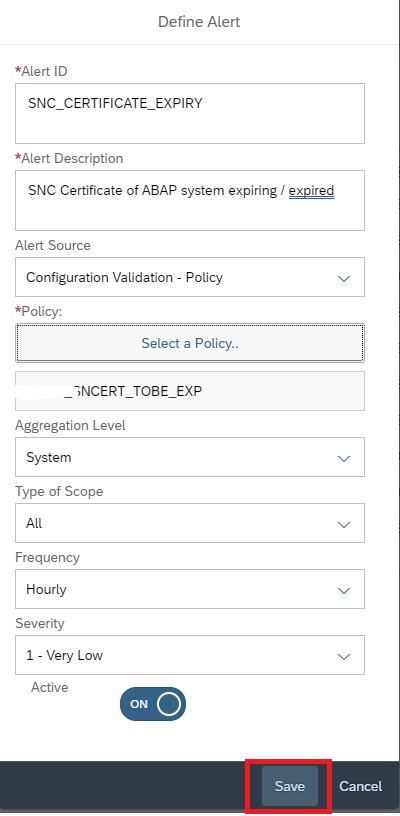
Now click on Save to activate the alerting.
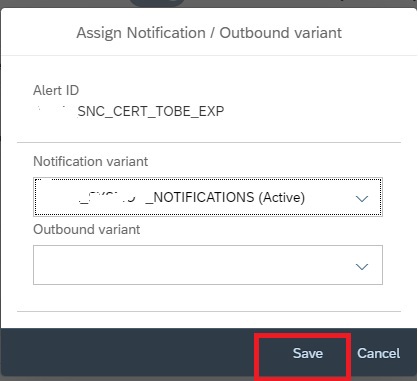
Additionally you can also activate email notification on the alert. For this in the Alert Management main screen, select the alert and then click on Notification/Outbound.
In the next popup select the notification variant and save.
Cloud Connector BTP certificate expiry
With SAP Focused Run 3.0 FP 2 SAP has delivered a configuration validation policy using which you can monitor Cloud Connector BTP Certificate expiry.
Note: For using this functionality you just have to ensure that you have registered your cloud connector managed system to your Focused Run System and have performed SSI for the cloud connector managed system.
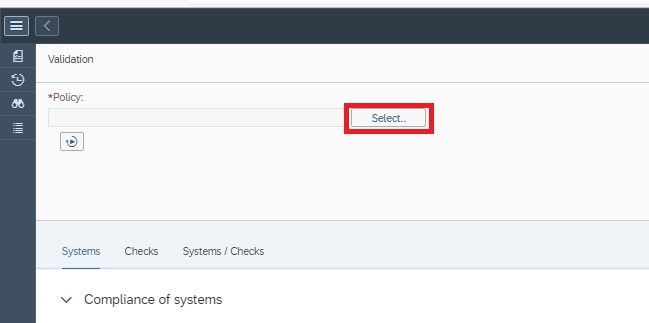
You can do the monitoring via the Configuration & Security Analytics app in the Advanced Configuration Monitoring area of Focused Run Launchpad.
In the app click on the select button to select the policy to monitor Cloud Connector BTP Certificates.
In the pop-up you can search for SCC and then select the policy SAP_SCC_PSE_CERT. This is the standard policy delivered by SAP that performs configuration validation on Cloud Connector BTP Certificate expiry.
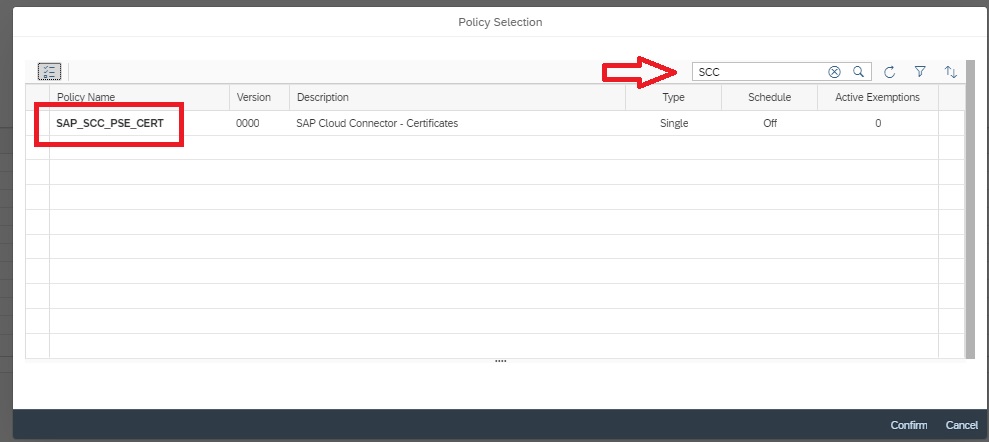
This policy monitors if a BTP certificate in cloud connector system is going to expire in less than 30 days or is already expired.
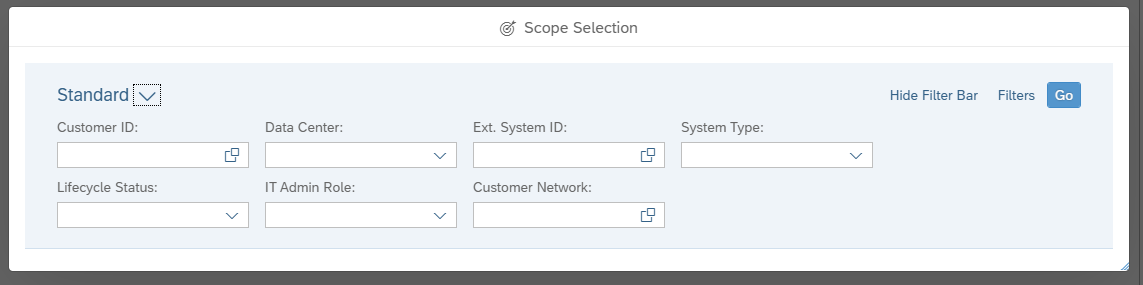
The first view upon selecting the policy is the Systems view. In this view all SAP Cloud Connector systems registered in Focused Run system are listed. A systems is marked as non compliant if it has any certificate which is going to expire in less than 30 days or has any expired certificates. This view also tells how many certificates are there in the system and how many are non compliant.
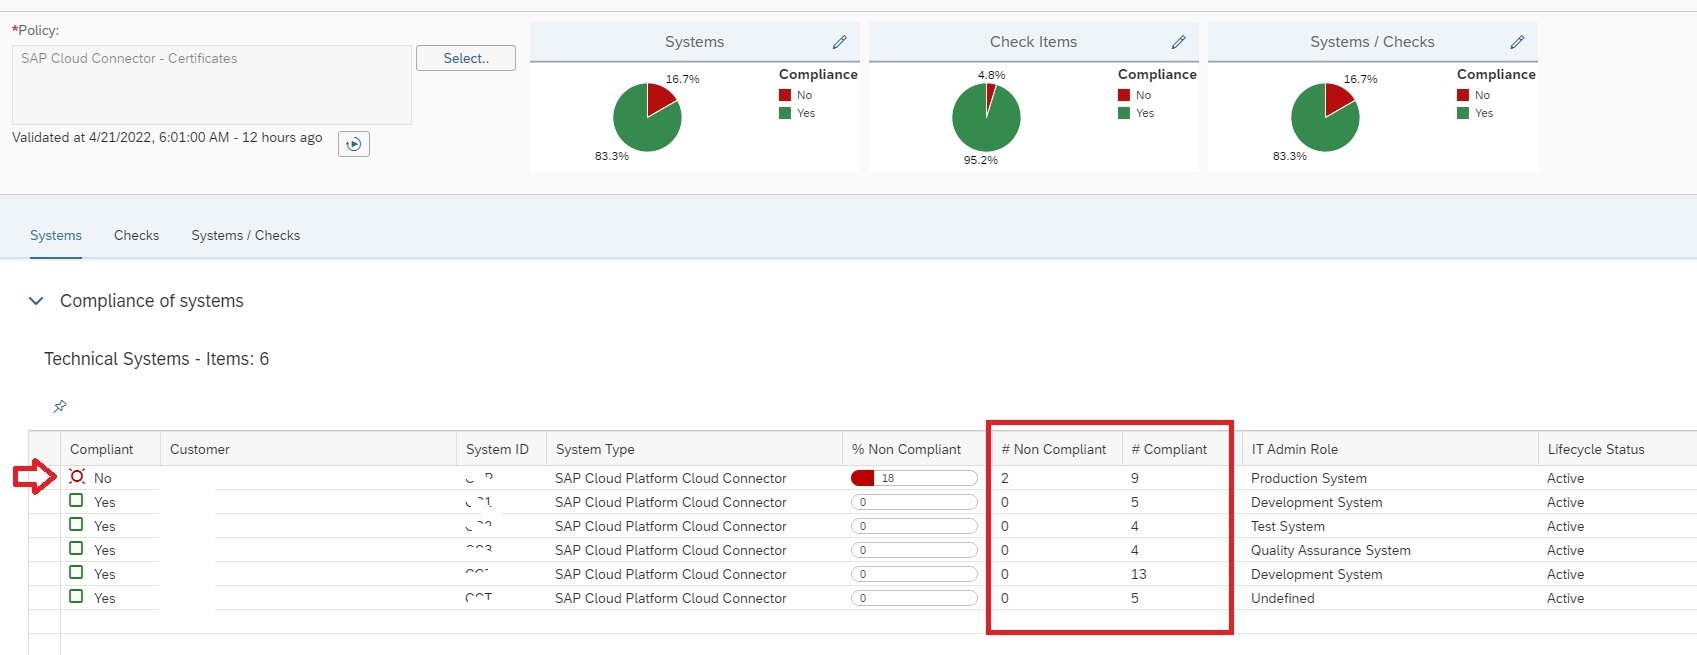
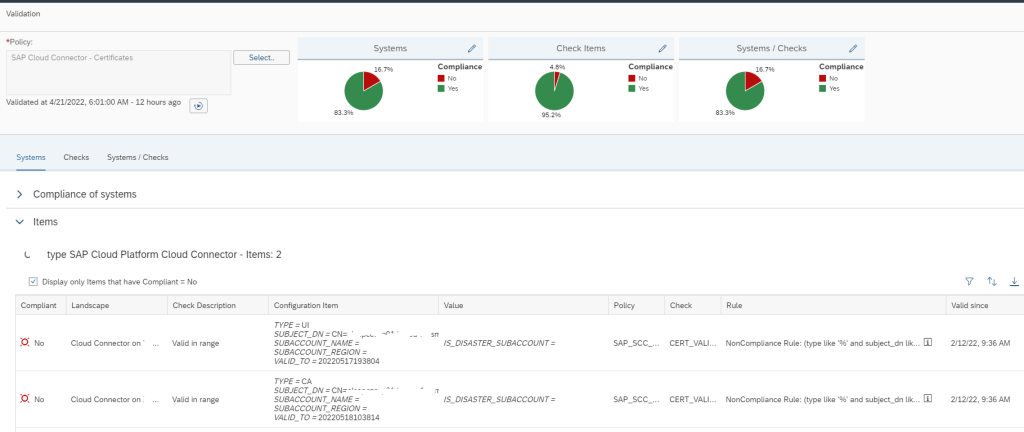
You can click on the row to see the details of the certificates which are expiring or expired.
To know more about Configuration and Security Analytics you can refer here.
Also you can find more detail at SAP documentation here.
<< This blog was originally posted on SAP Focused Run Guru by Manas Tripathy (Simac) and Frank Umans. Repost done with permission. >>