Creating a Custom Metric to Check SAPRouter SNC Certificate Expiry

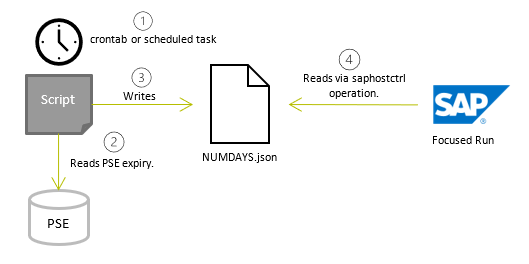
This metric and script checks the SAPRouter SNC certificate expiry and gives an alert depending on how many days left until expiry.

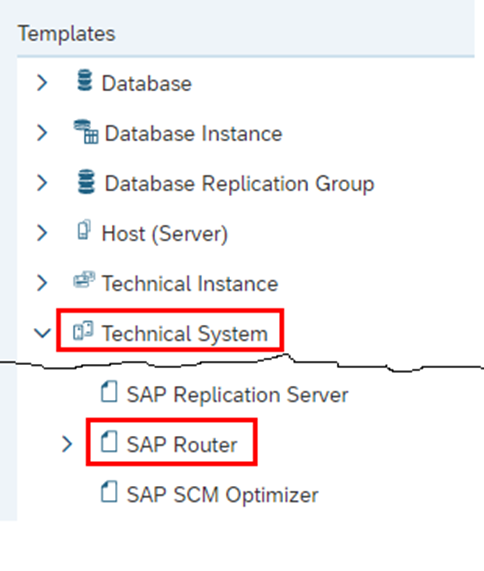
Define SAProuter in Focused Run LMDB

Prerequisite: Make sure you have installed the SAP Host Agent and performed Outside Discovery on the SAPRouter host.

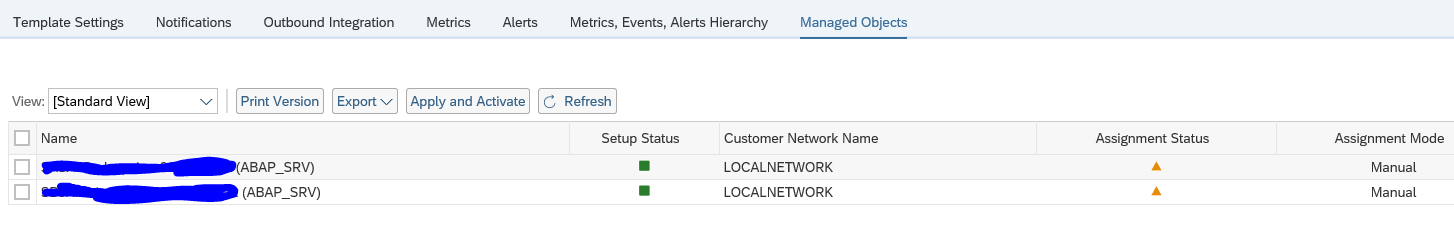
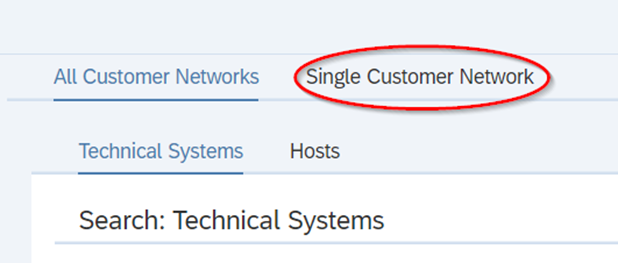
Go to the LMDB of you Focused Run system, then go to Single Customer Network:

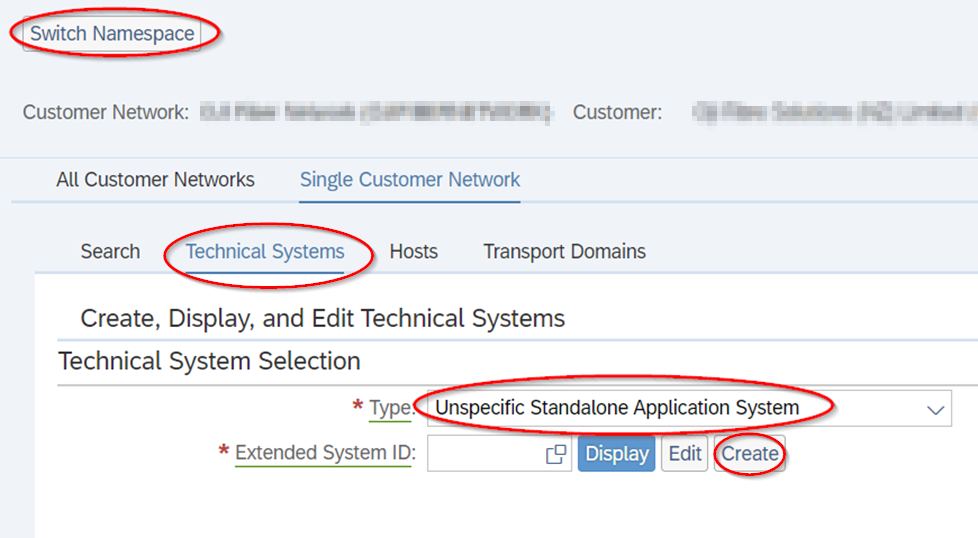
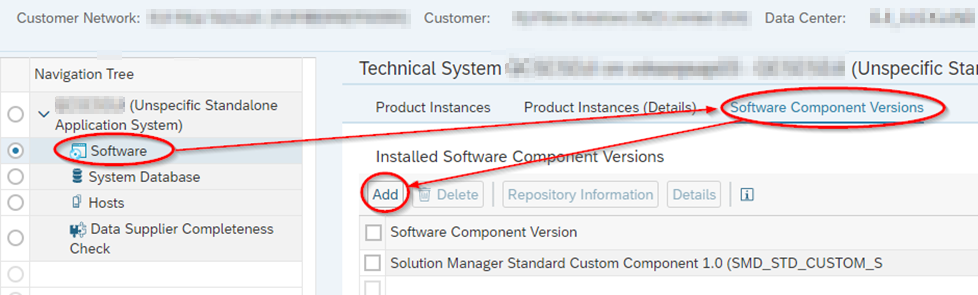
Switch Namespace and go to “Technical Systems” and choose “Unspecific Standalone Application System” from the drop-down, then hit Create.
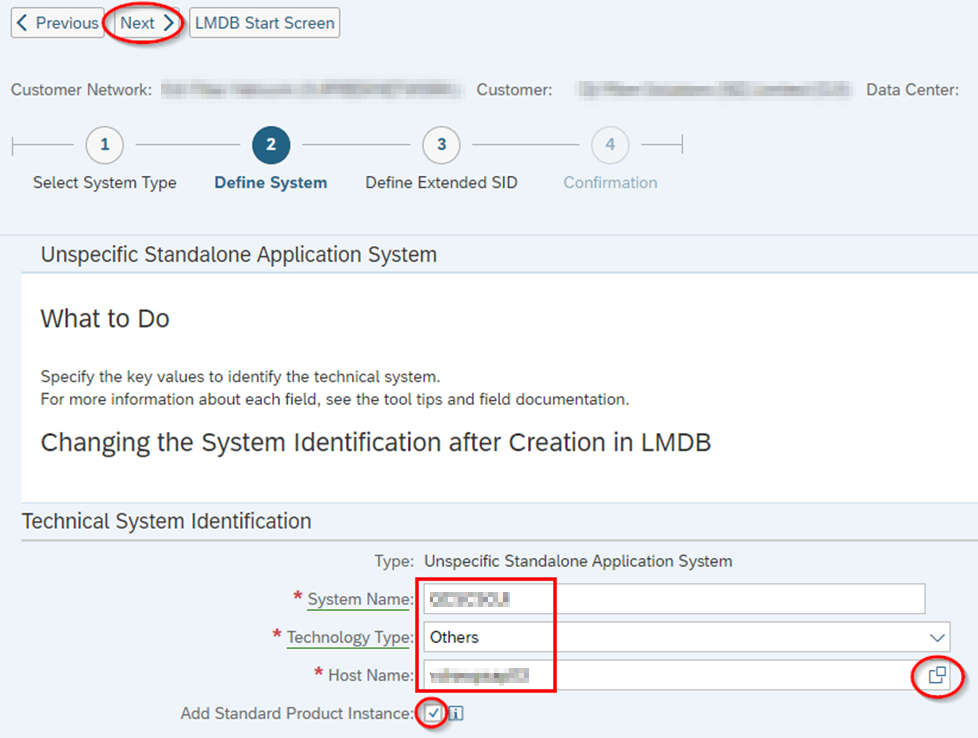
Enter:

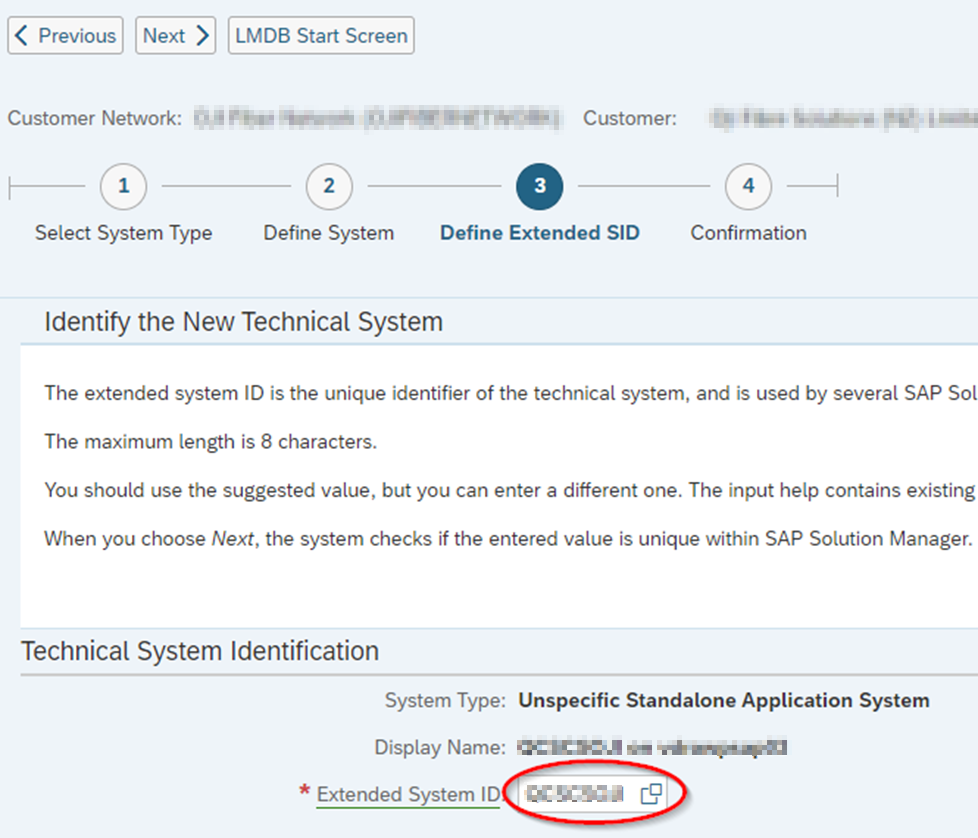
Enter the Extended SID:

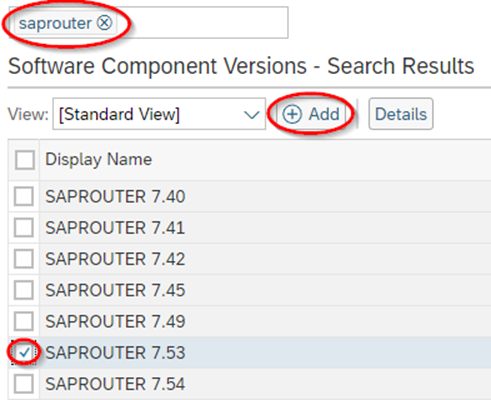
Add Software Component Version:

Search on the software, and then select the correct release, then Add. E.g.:

Save

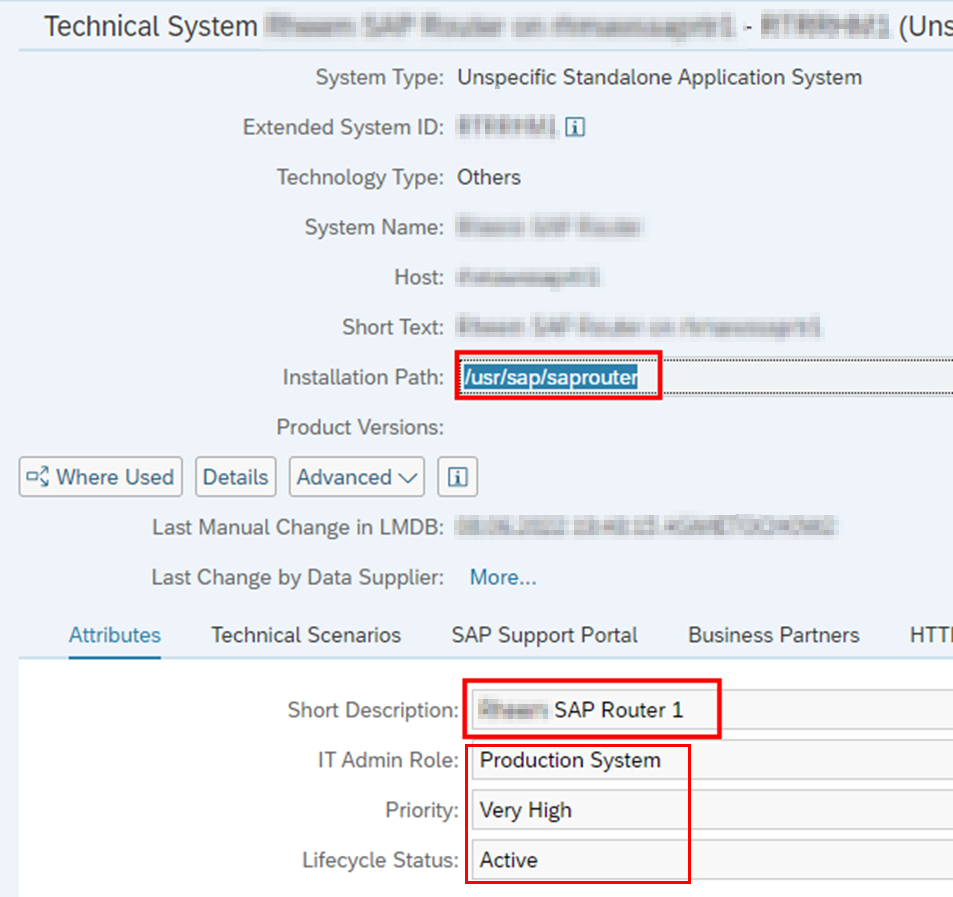
Add Installation Path and Required LMDB Attributes. NOTE: Find out the relevant software installation path of the SAPRouter on the server.

Perform Simple System Integration.

Configure Script and Custom SAPHostCtrl Operation

Prerequisite: The script requires the SAPRouter SNC Certificate to be properly installed, and the PSE credentials in the cred_v2 file for the account that runs the SAPRouter service.

A script is scheduled to run daily as the same user that runs the SAPRouter service. The script reads the expiry date of the from the PSE and writes it to a file in JSON format so that the FRUN metric can read and interpret it. The script by default has SAPRouter home directory as /usr/sap/saprouter or <drive>:\usr\sap\saprouter, and it can be changed. This will be denoted as <SAPROUTER_HOME>. The PSE file variable can also be changed.

Linux/Unix

Create a new executable file in the SAPRouter home directory and copy the code in Appendix A. Ensure it is owned and executable by the user that runs the SAPRouter service and belongs to group sapsys. E.g.,

chown <saprouter user>:sapsys saprouter_expiry_days.sh
chmod 744 saprouter_expiry_days.sh

In the script, adjust the following variables:

  • SAPROUTER_HOME
  • SECUDIR (The SECUDIR folder is where the PSE file resides)
  • SAPROUTER_USER
  • PSE

Test the Script. Switch to the user that runs the SAPRouter service, then execute the script:

/usr/sap/saprouter/saprouter_expiry_days.sh

Look for file NUMDAYS.json. It should contain e.g.:

{type:integer, name:NumDays, value:136}

Schedule script in the root crontab as follows:

# Run SAProuter SNC Certificate expiry check
00 09 * * * su - <saprouter user> -c /usr/sap/saprouter/saprouter_expiry_days.sh

Windows

Create a batch file (*.bat) in the SAPRouter home directory. In the script, adjust the following variables:

  • SAPROUTER_HOME
  • SECUDIR (The SECUDIR folder is where the PSE file resides)
  • PSE

Test the Script. Logon as the user that runs the SAPRouter service. Right-click on the bat script and “run as Administrator”. Alternatively, if you are not logged as the SAPRouter service account, you can “run-as” the user that runs the SAPRouter service and execute the script that way.

runas /user:<domain or hostname>\<SAPRouter service user> <SAPROUTER_HOME>\saprouter_expiry_days.bat

NOTE: The SAPRouter service user requires “Allow log on locally” user rights.

Look for file NUMDAYS.json. It should contain e.g.:

{type:integer, name:NumDays, value:136}

Schedule the Script. Open a command prompt as administrator. Execute the command:

SCHTASKS /CREATE /RU <DOMAIN>\<saprouter user> /RP <password> /SC DAILY /TN "Run SAPRouter SNC Certificate expiry check" /TR "C:\Windows\System32\cmd.exe /C \"<SAPROUTER_HOME>\saprouter_expiry_days.bat\"" /ST 09:00 /RL HIGHEST

Note: The start time e.g., 09:00 is in 24 hour format. You should see:

Run the new task to test it:

SCHTASKS /RUN /TN "Run SAPRouter SNC Certificate expiry check"

You should see:

Check the timestamp of the file NUMDAYS.json.

Create Custom Operation for saphostctrl

To load these values into Focused Run, a custom operation for saphostctrl needs to be created.

Linux/Unix

As Root: Create the following custom operations conf file:

/usr/sap/hostctrl/exe/operations.d/checksnccert.conf

Enter the following into the conf file:

Command: cat /usr/sap/saprouter/NUMDAYS.json
Description: Check number of days to SNC certificate expiry
ResultConverter: flat
Platform: Unix

Test the custom operation as follows:

/usr/sap/hostctrl/exe/saphostctrl -function ExecuteOperation -name checksnccert

Result should be:

Webmethod returned successfully
Operation ID: 06C635D6863A1EEDB6BC5C819EE199D7

----- Response data ----
description=Check number of days to SNC certificate expiry
{type:integer, name:NumDays, value:169}
exitcode=0

Windows

Create the following custom operations conf file:

C:\Program Files\SAP\hostctrl\exe\operations.d\checksnccert.conf

Enter the following into the conf file:

Command: FOR /F "tokens=* delims=" %x in (<SAPROUTER_HOME>\NUMDAYS.json) DO @echo %x
Description: Check number of days to SNC certificate expiry
ResultConverter: flat
Platform: Windows

In a Command Prompt as Administrator, test the custom operation as follows:

"C:\Program Files\SAP\hostctrl\exe\saphostctrl" -function ExecuteOperation -name checksnccert

Result should be:

Webmethod returned successfully
Operation ID: 00155D657F901EEDBCF9E32BC564F964

----- Response data ----
description=Check number of days to SNC certificate expiry
{type:integer, name:NumDays, value:360}
exitcode=0

Create Custom Alert in Focused Run

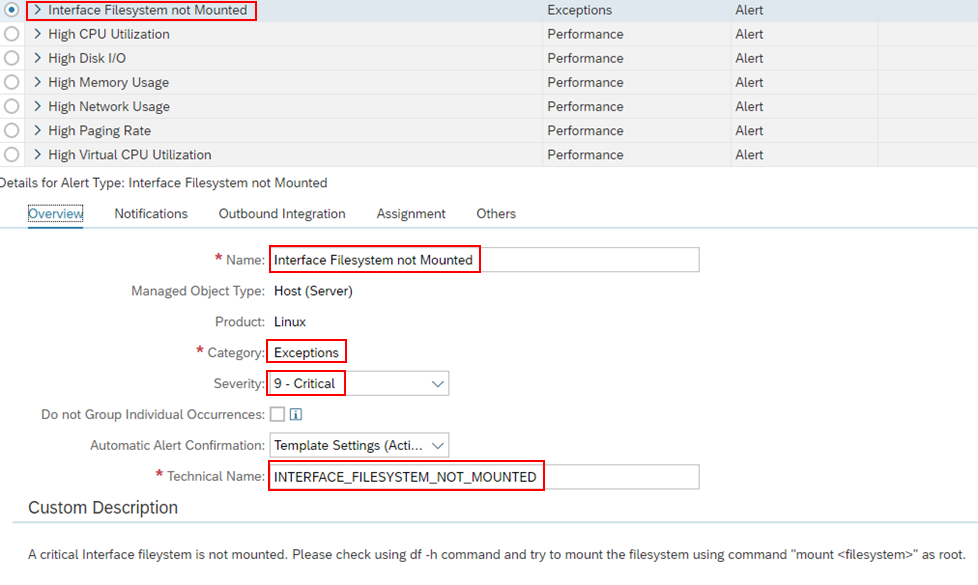
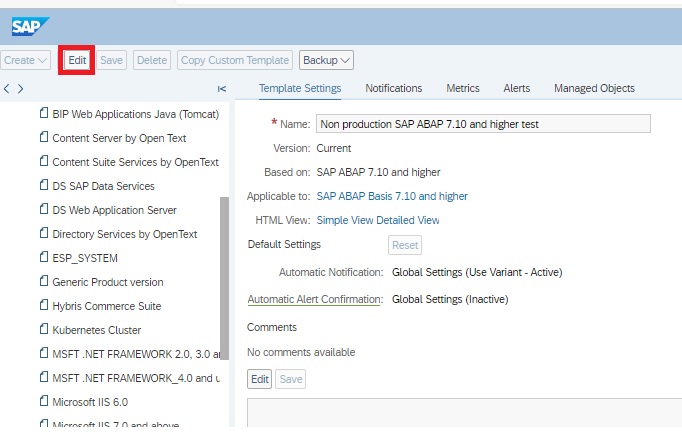
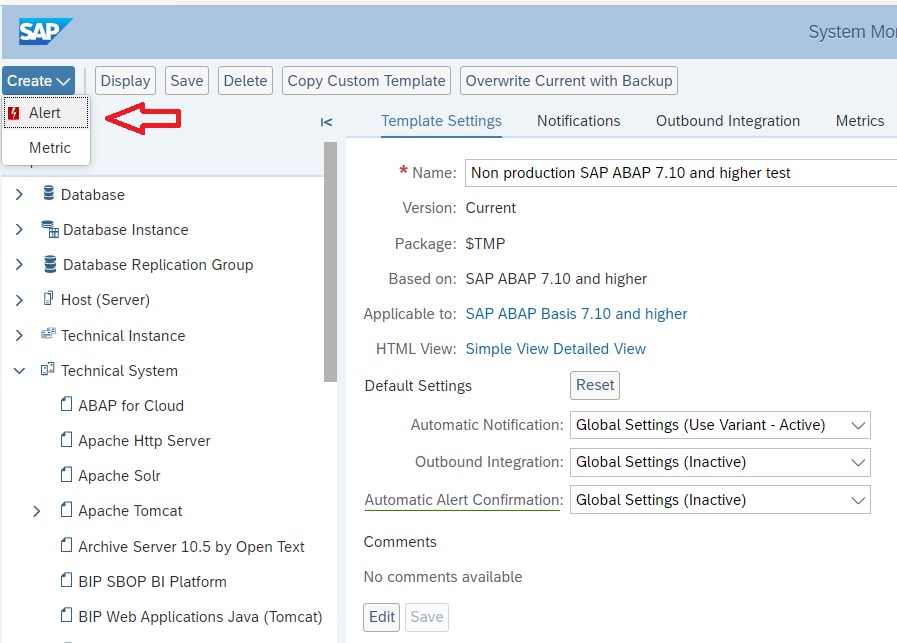
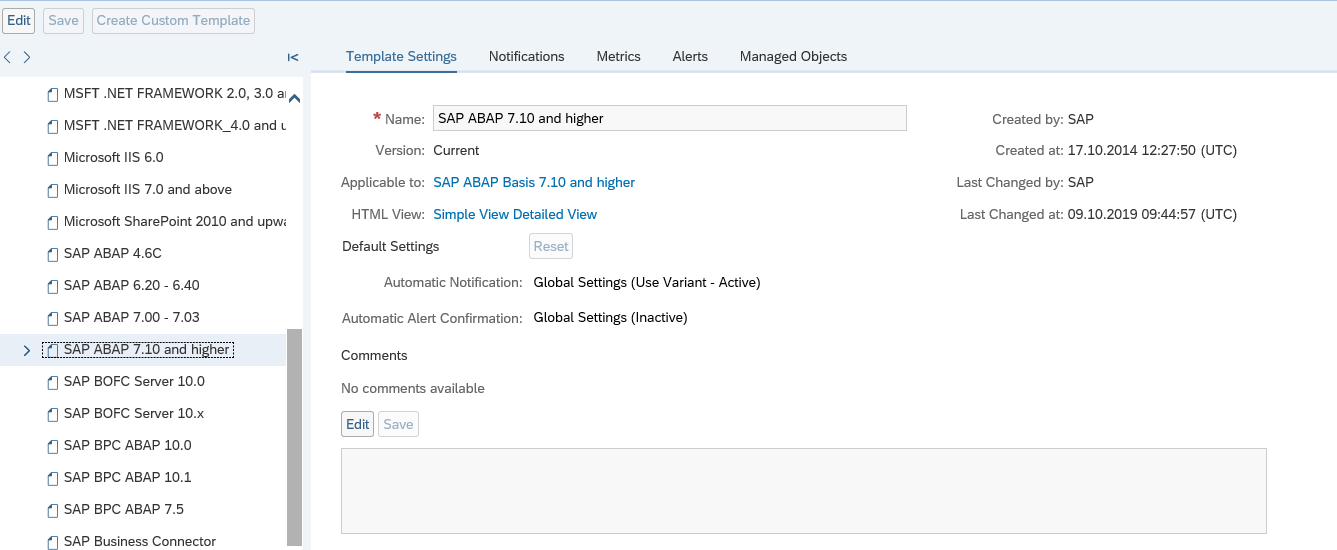
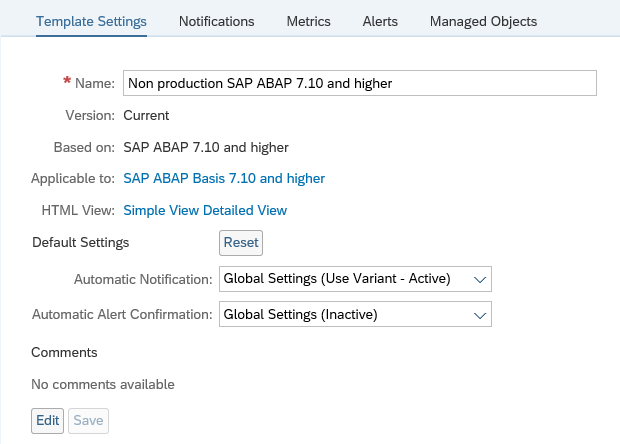
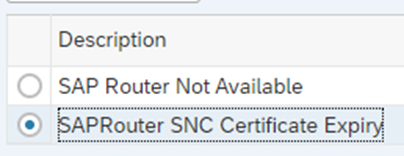
Create a new monitoring template for SAPRouter here:

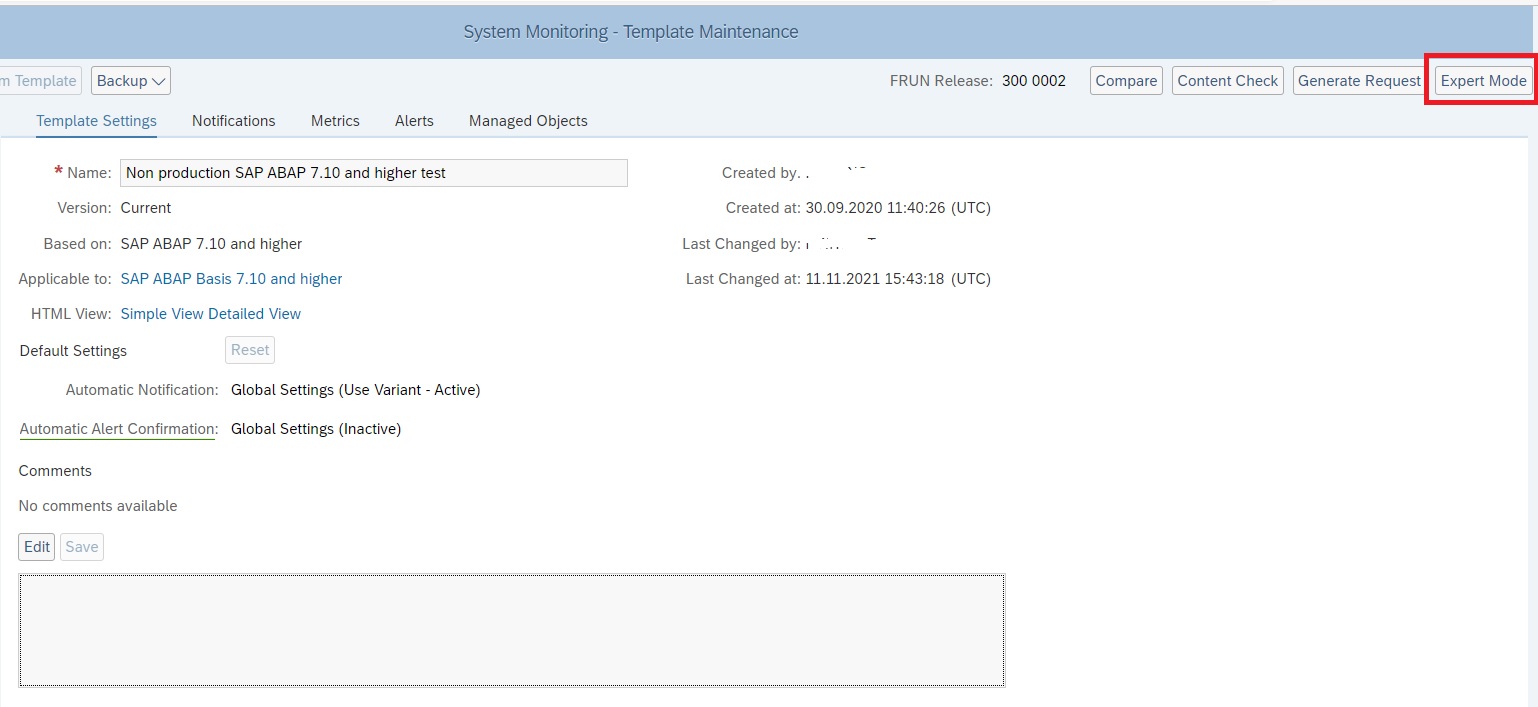
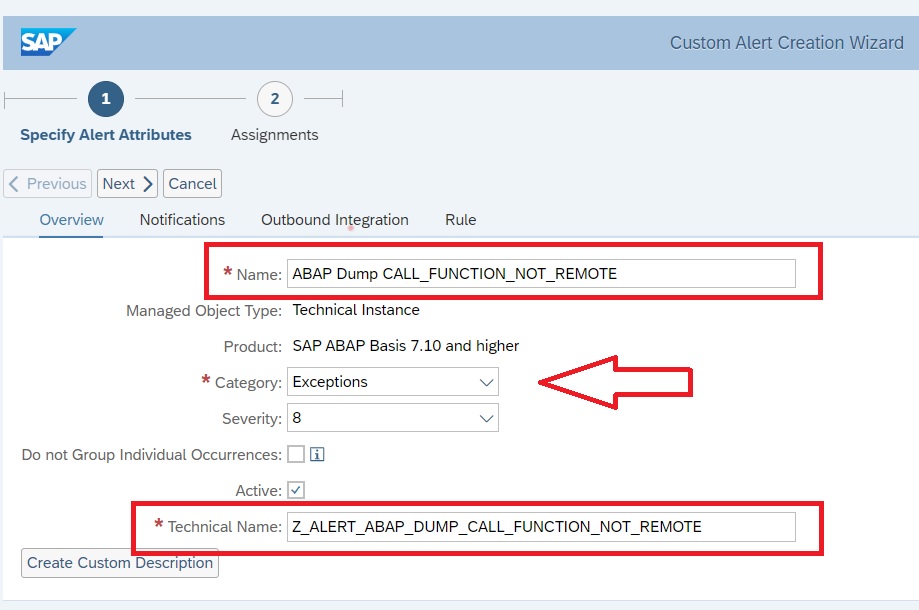
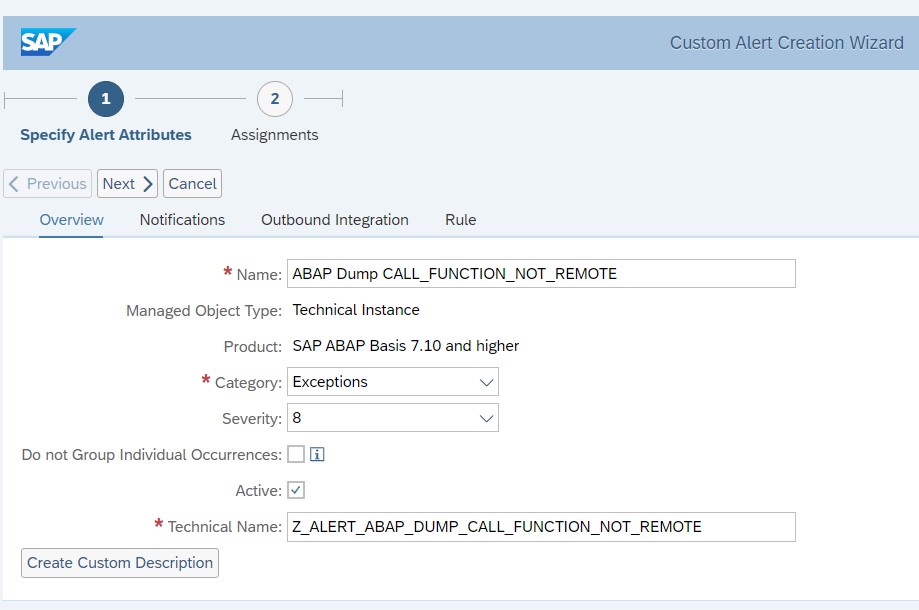
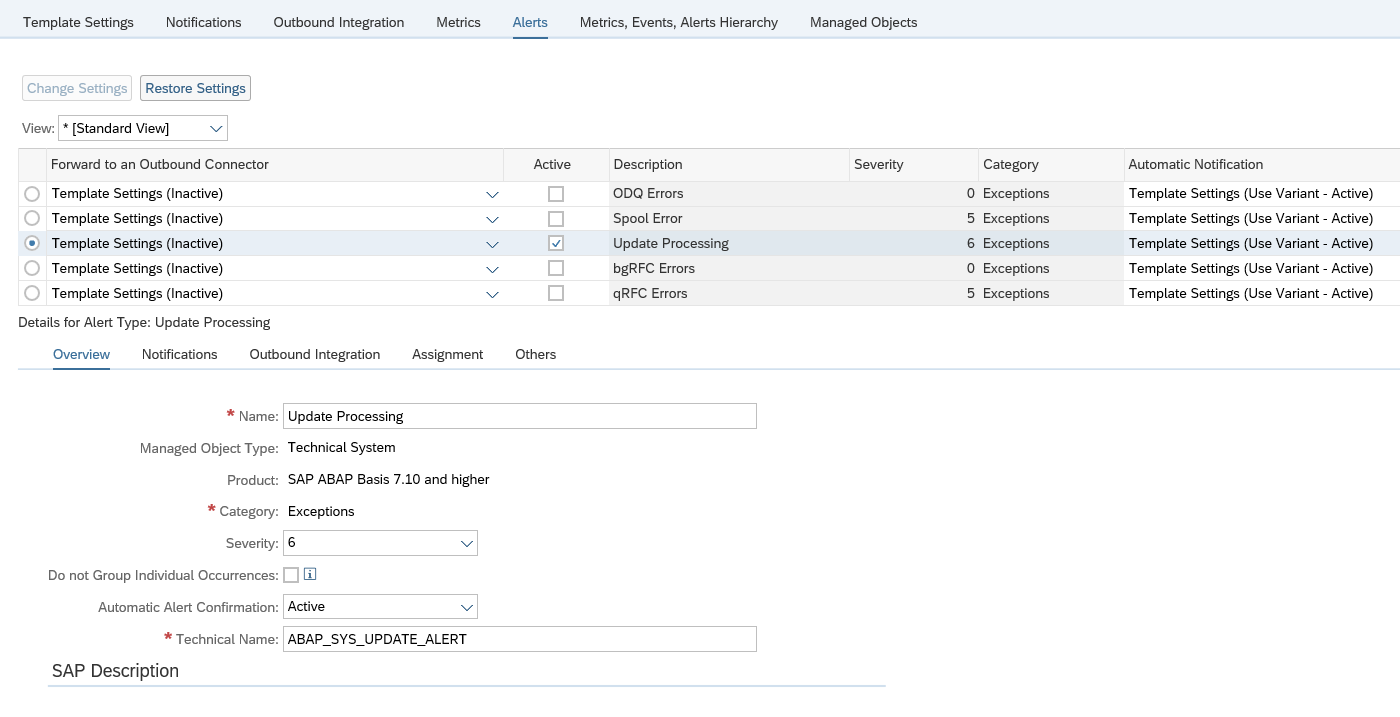
Enter into Expert Mode. Create a new Alert with the following settings:

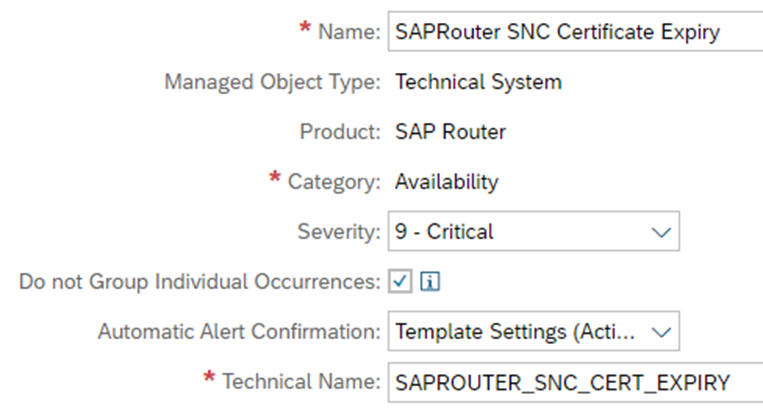
NOTE: If the tick box “Do not Group Individual Occurrences” is ticked, it will alert at each data collection regardless of its previous rating, and not only at a change of rating.

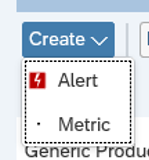
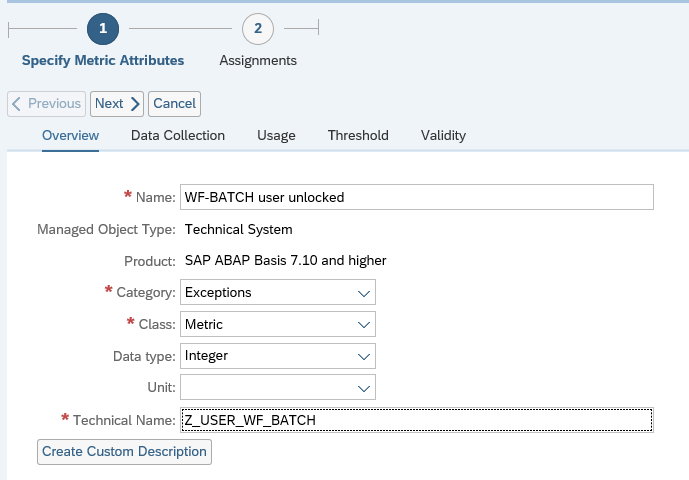
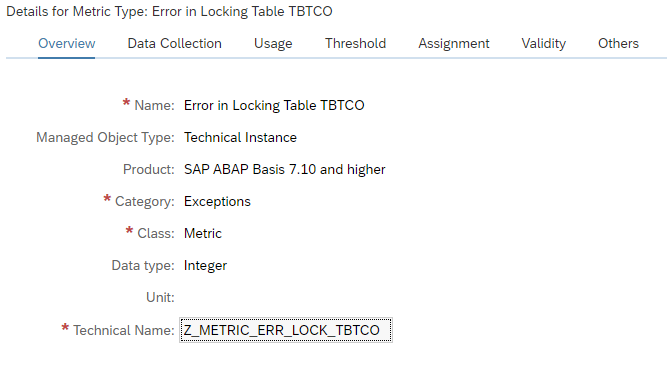
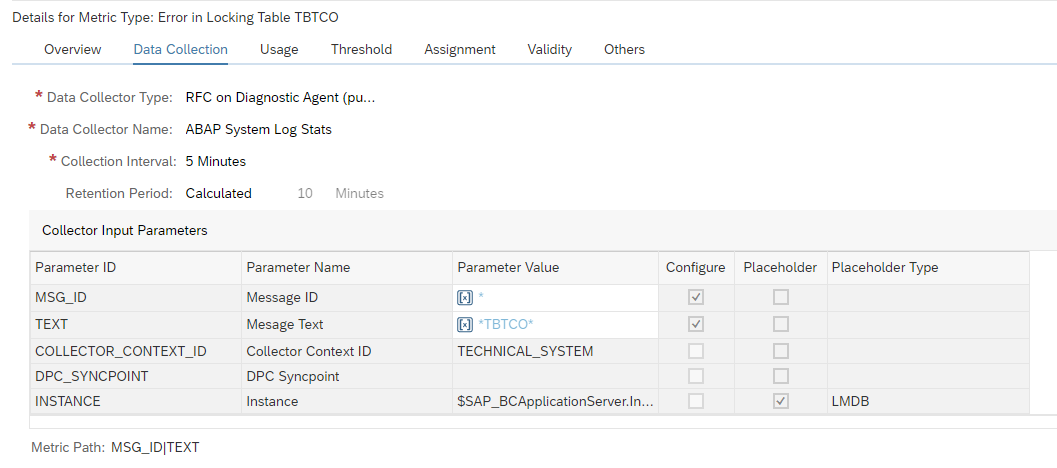
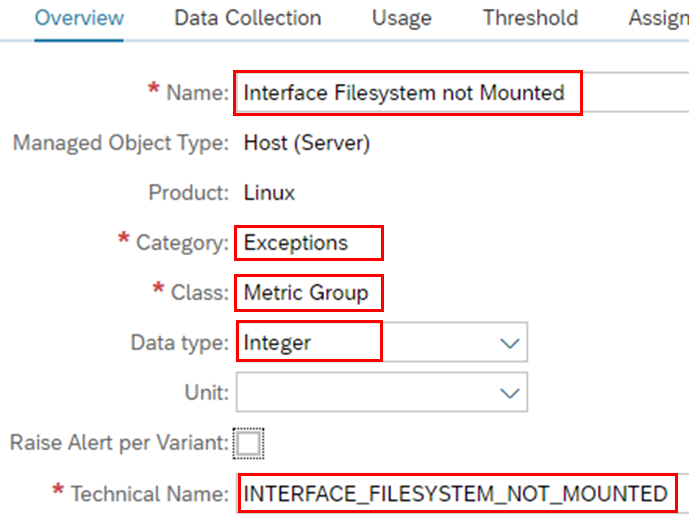
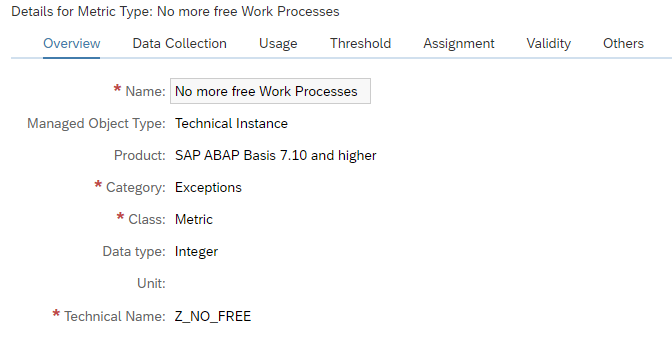
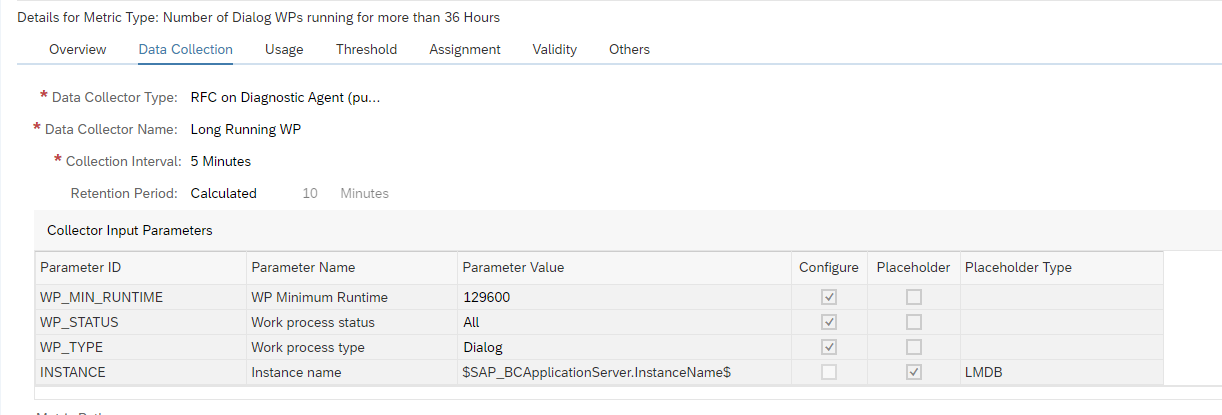
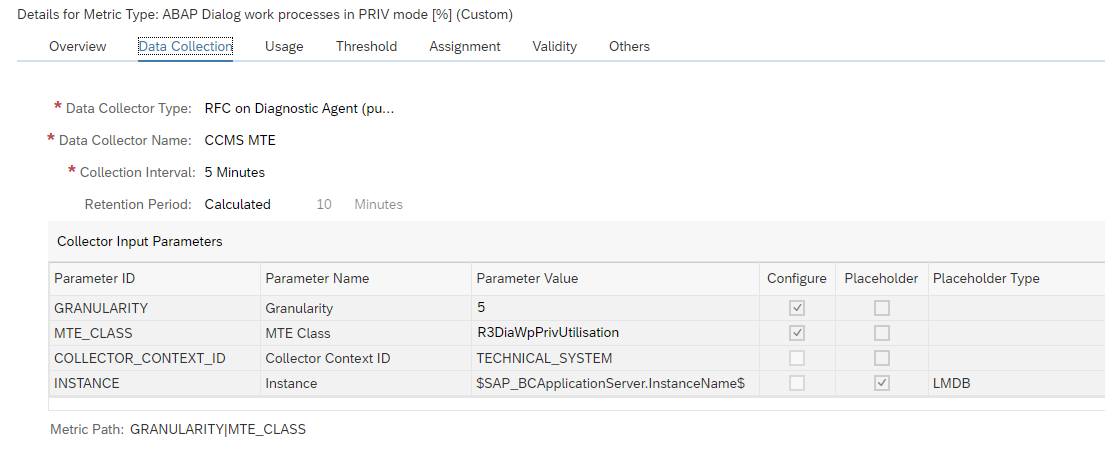
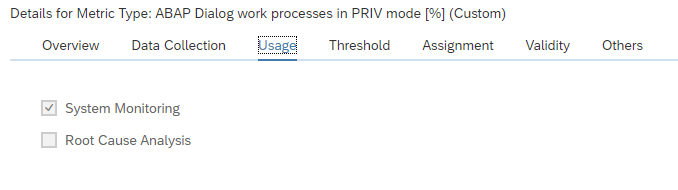
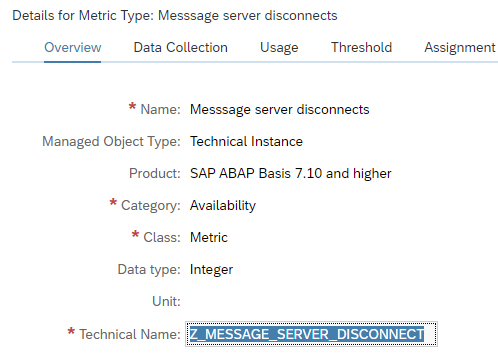
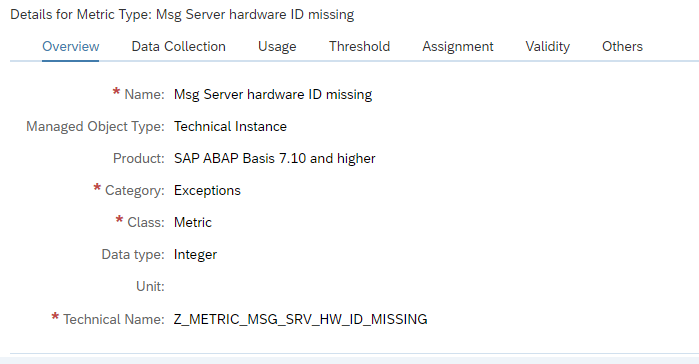
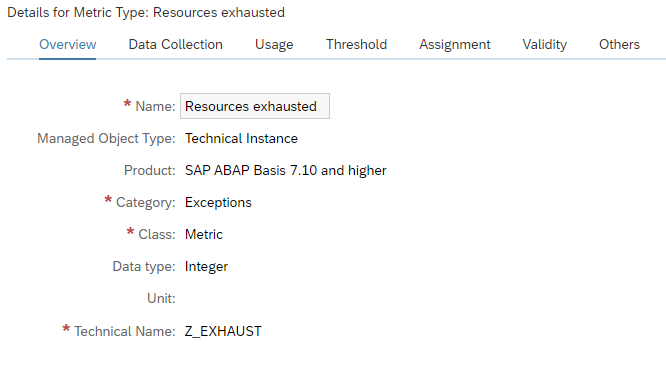
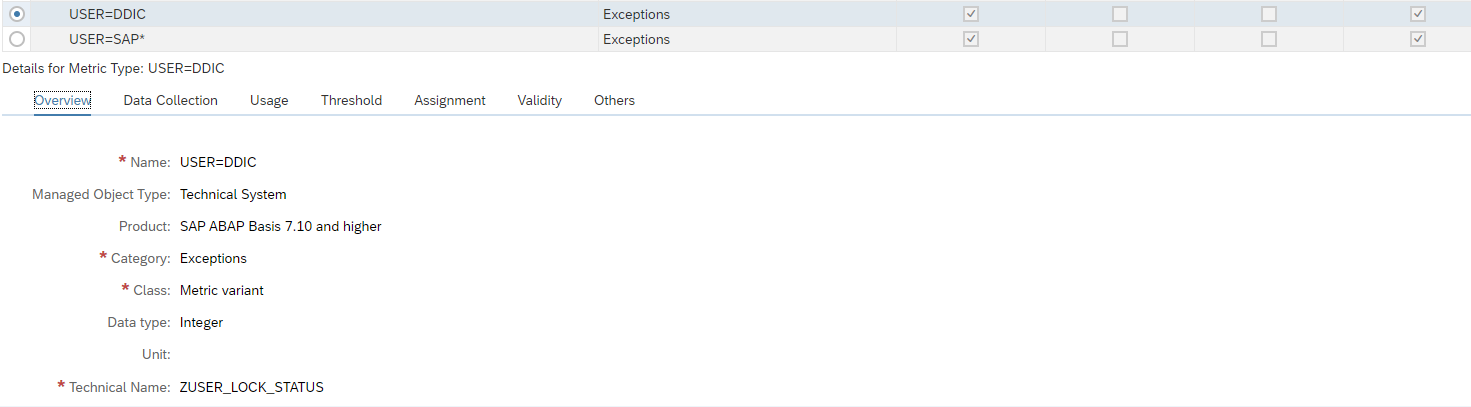
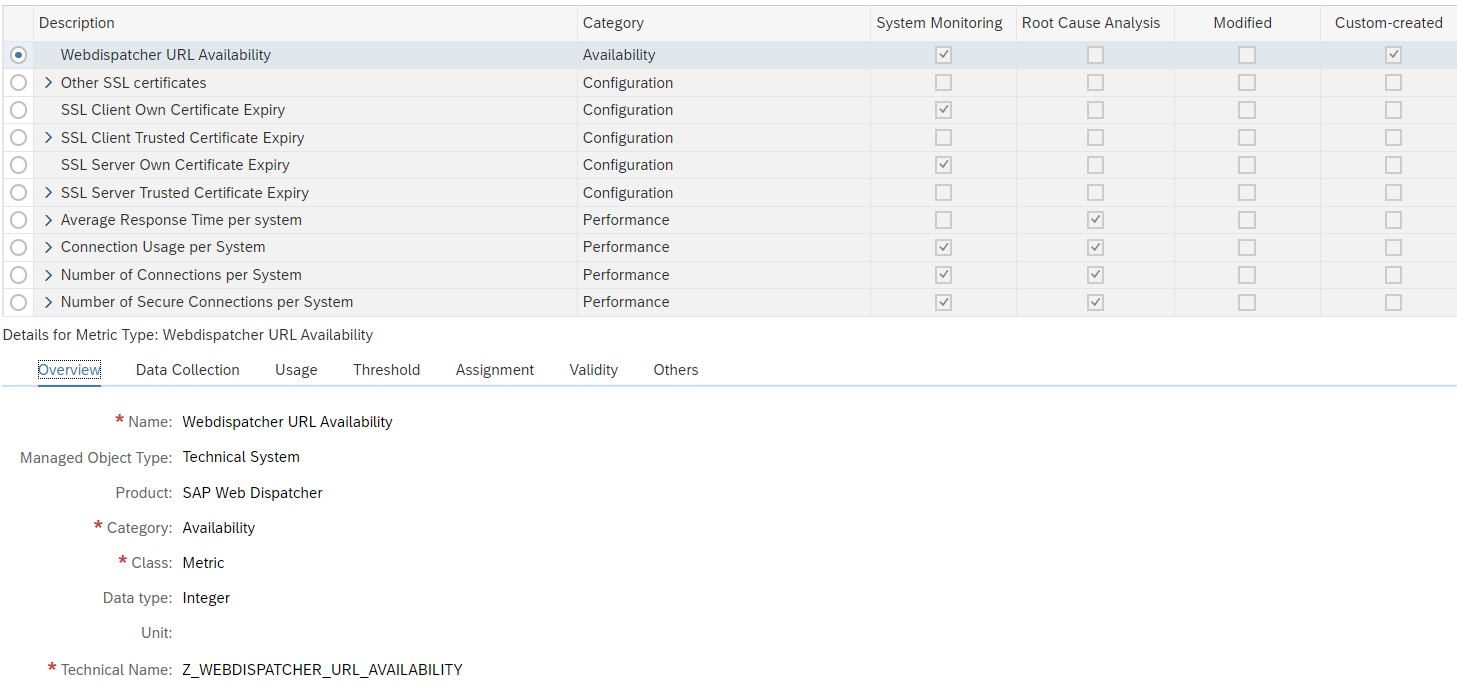
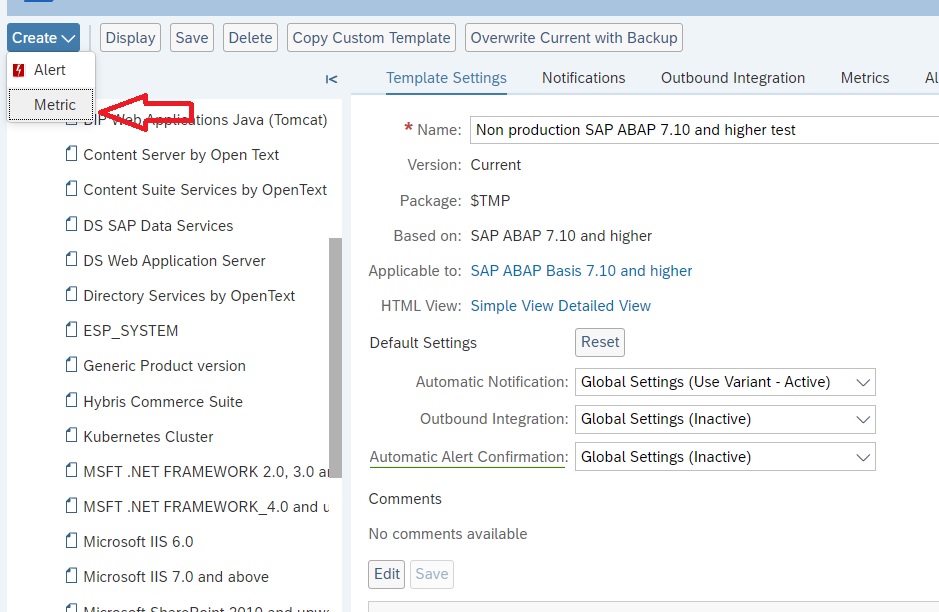
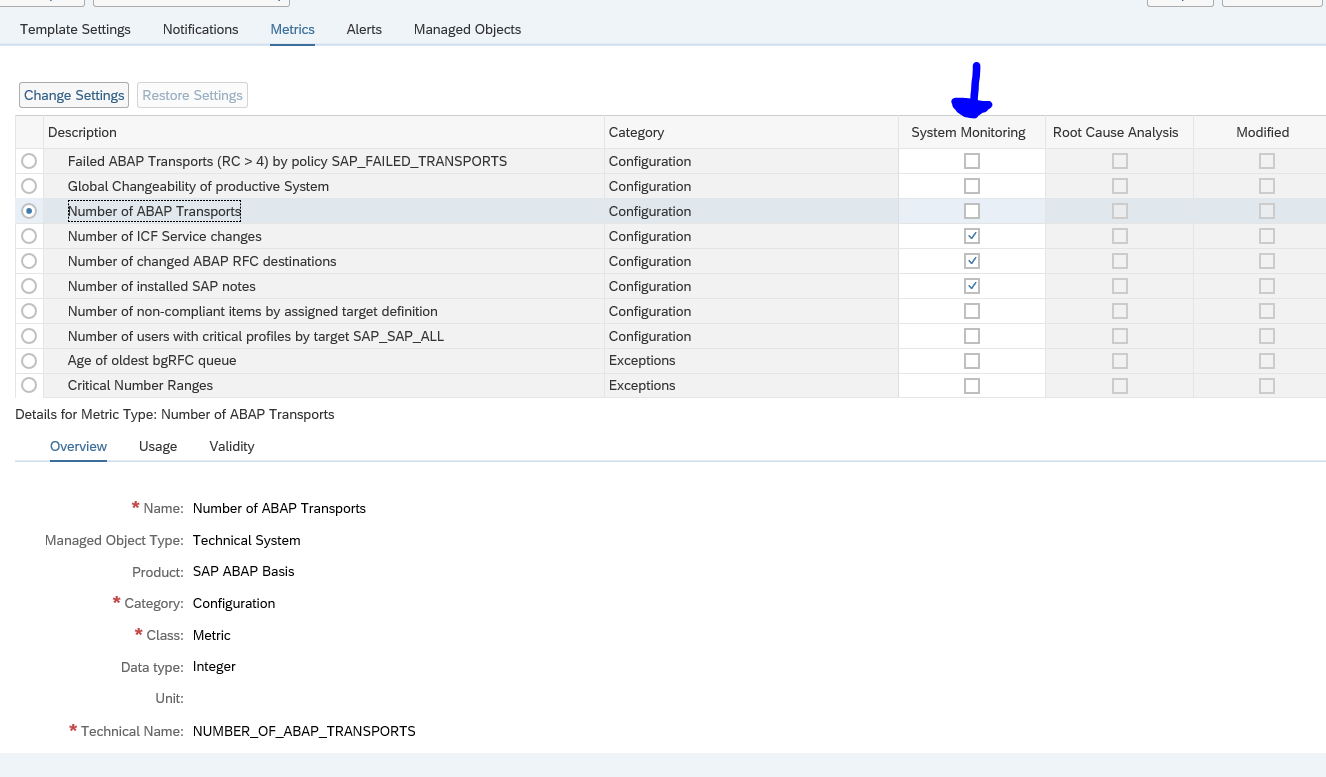
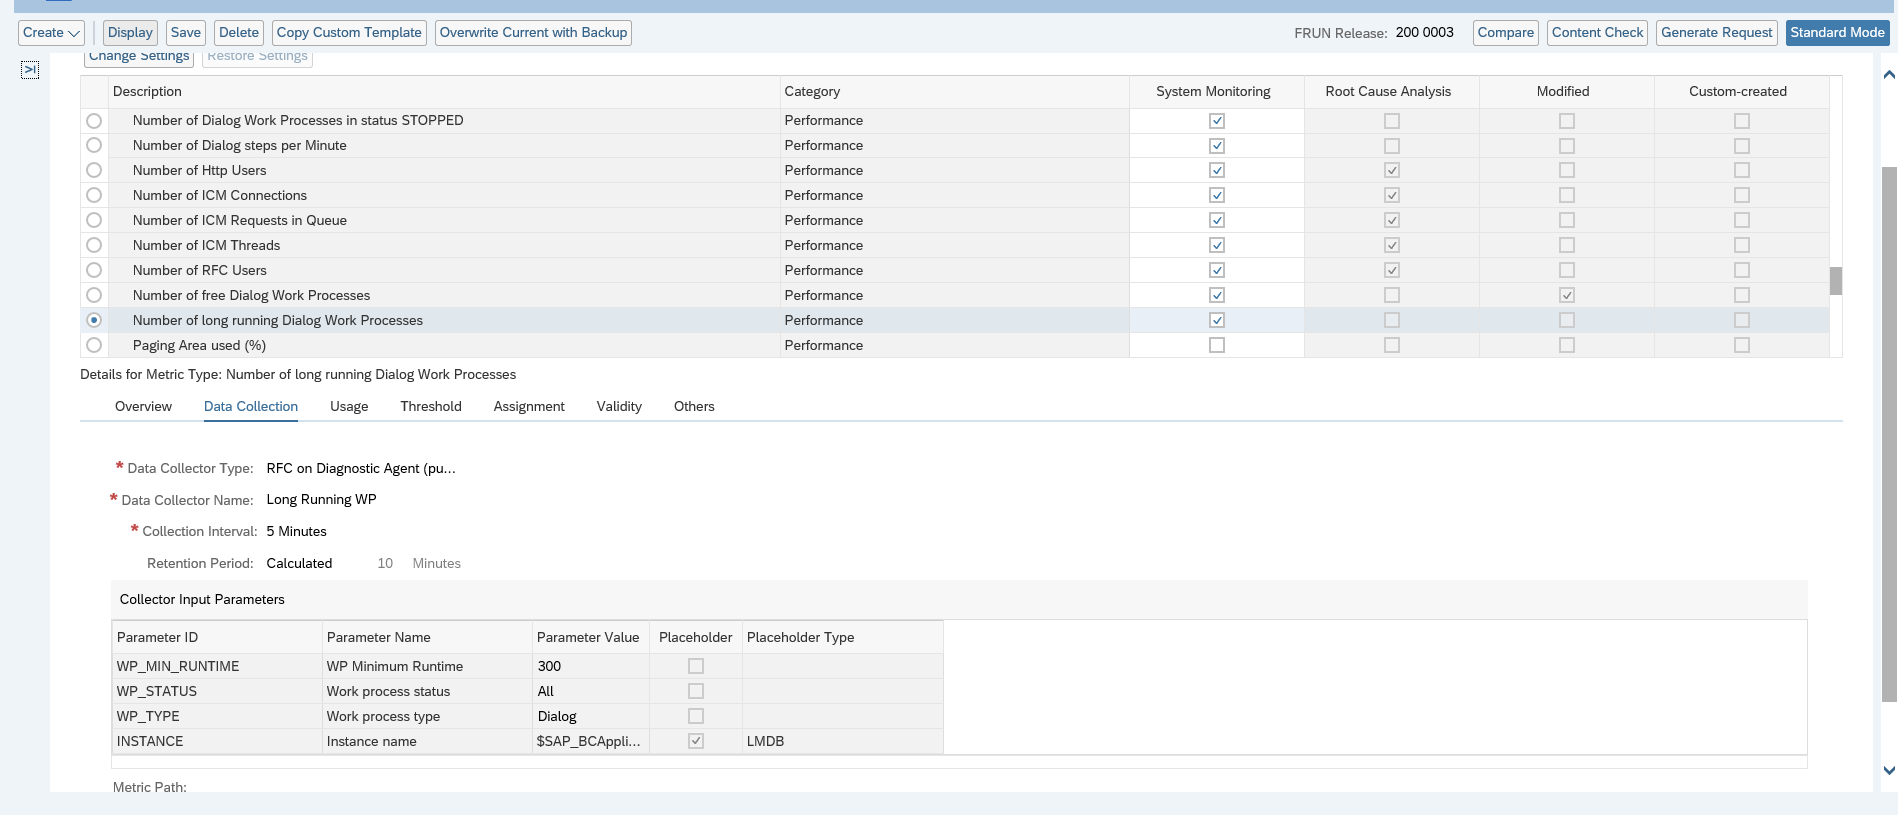
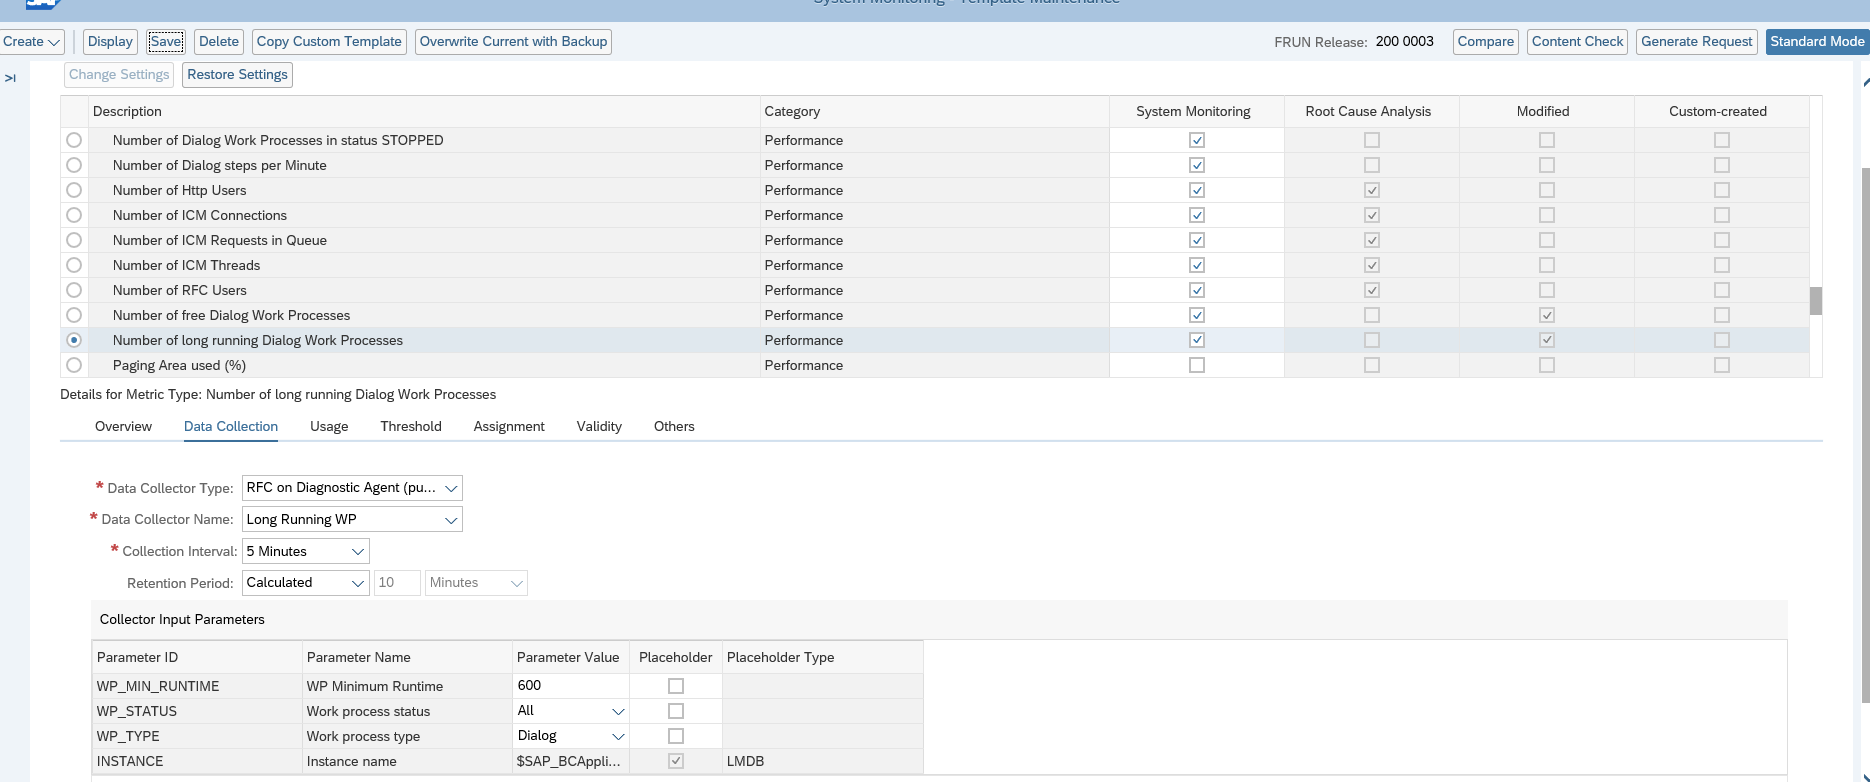
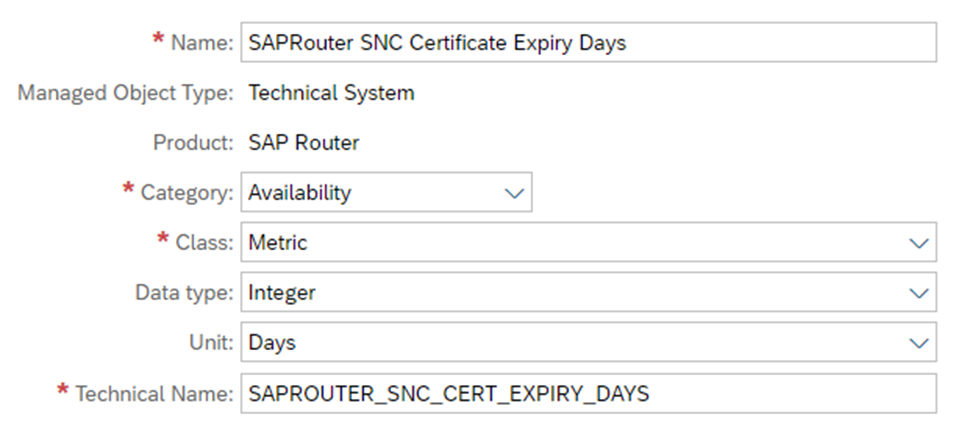
Create Custom Metric In Focused Run

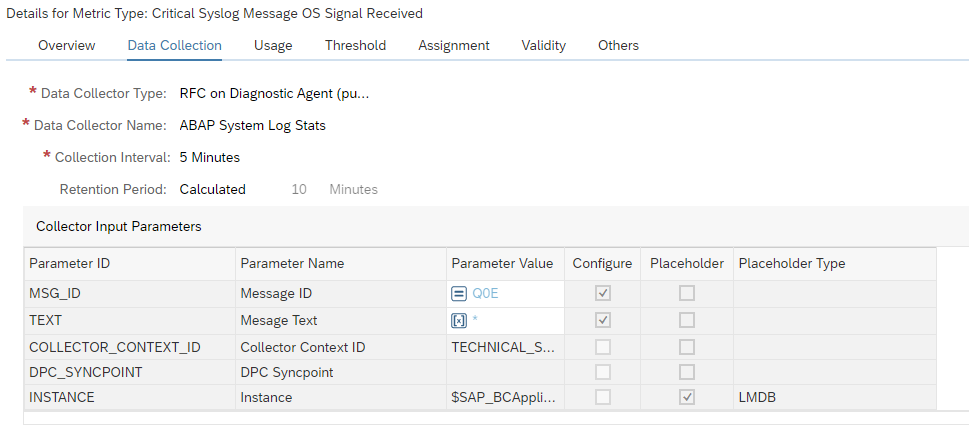
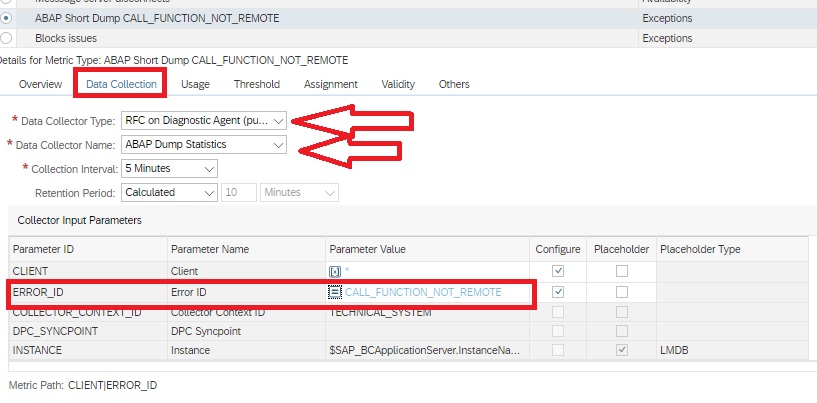
Create a new Metric with the following settings:
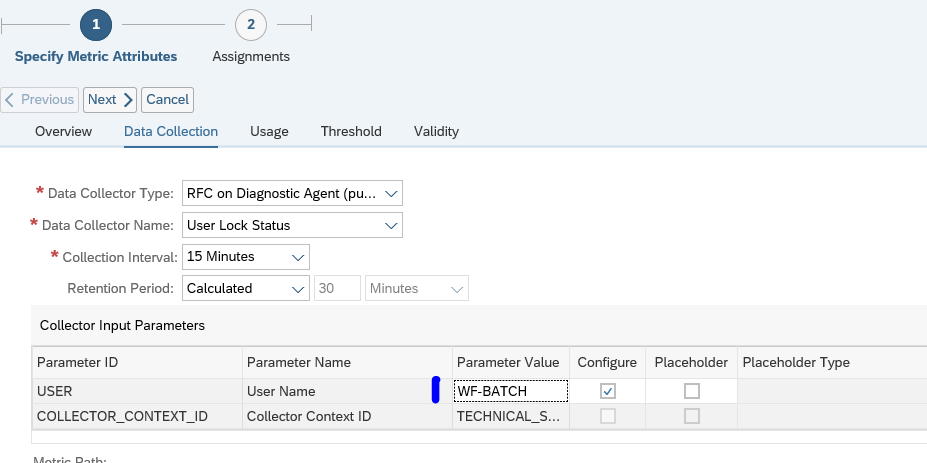
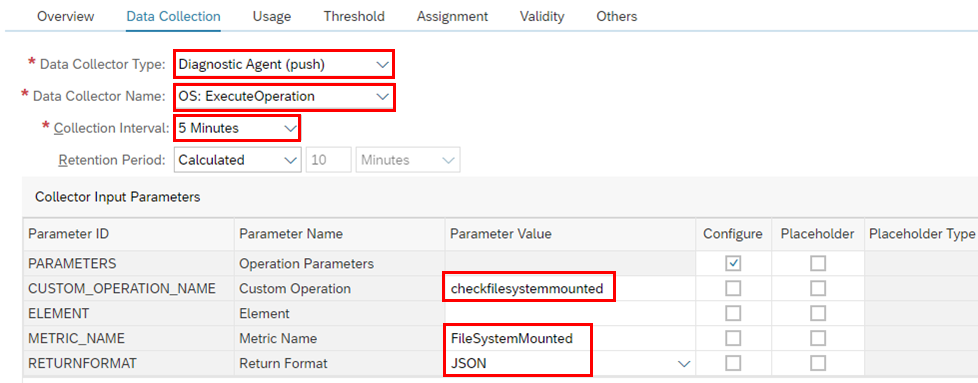
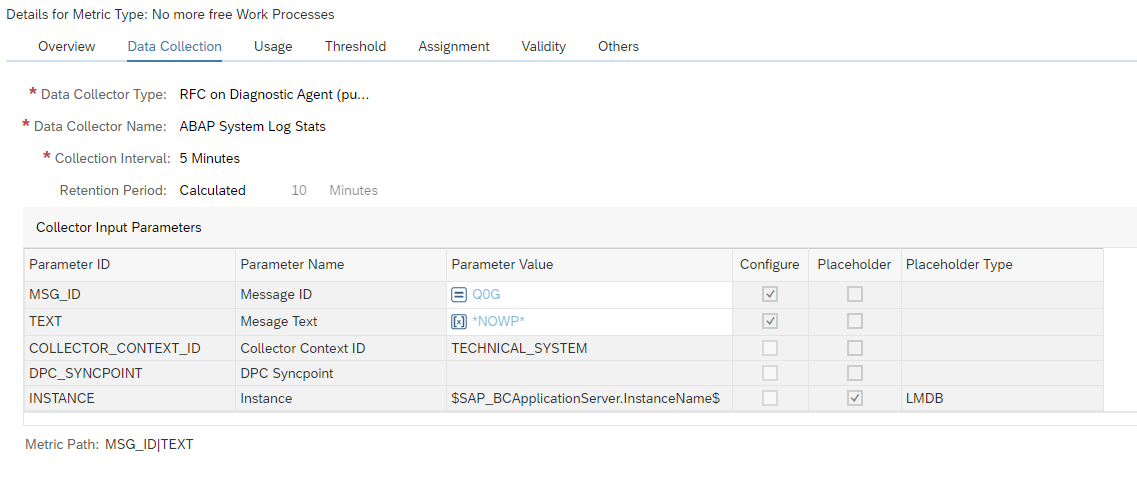
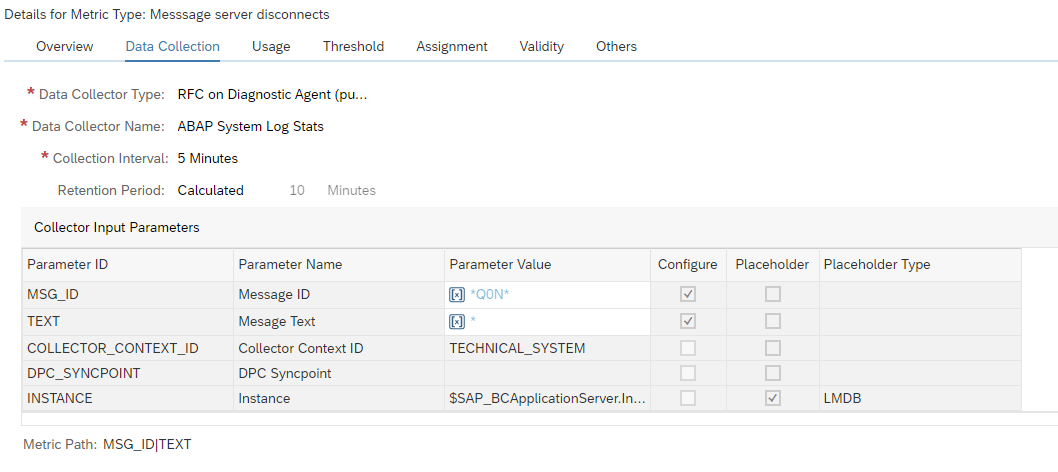
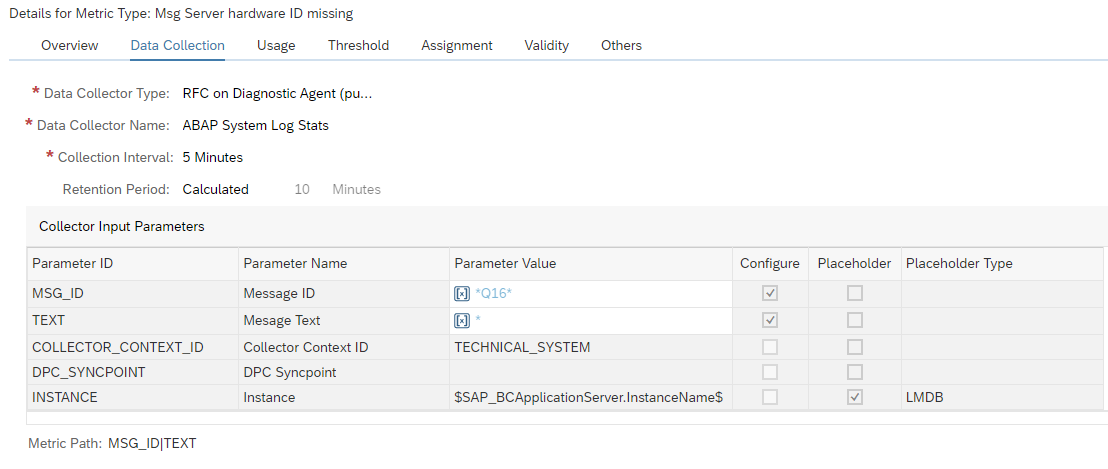
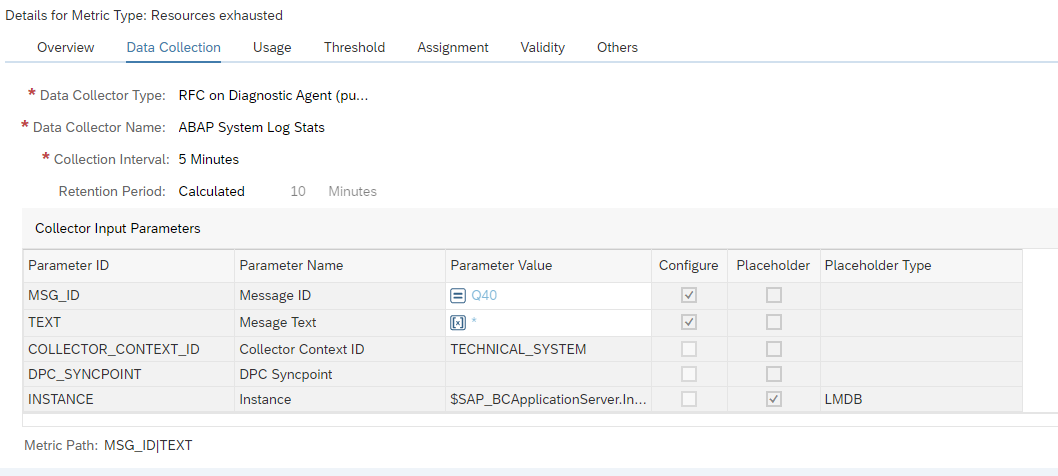
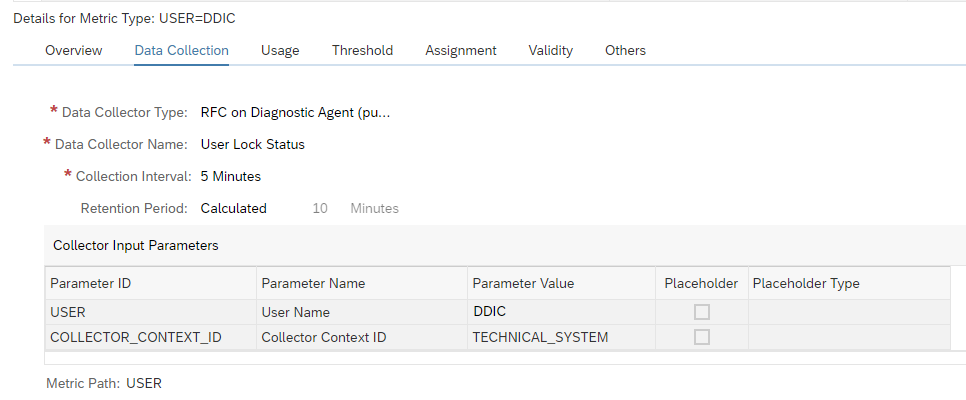
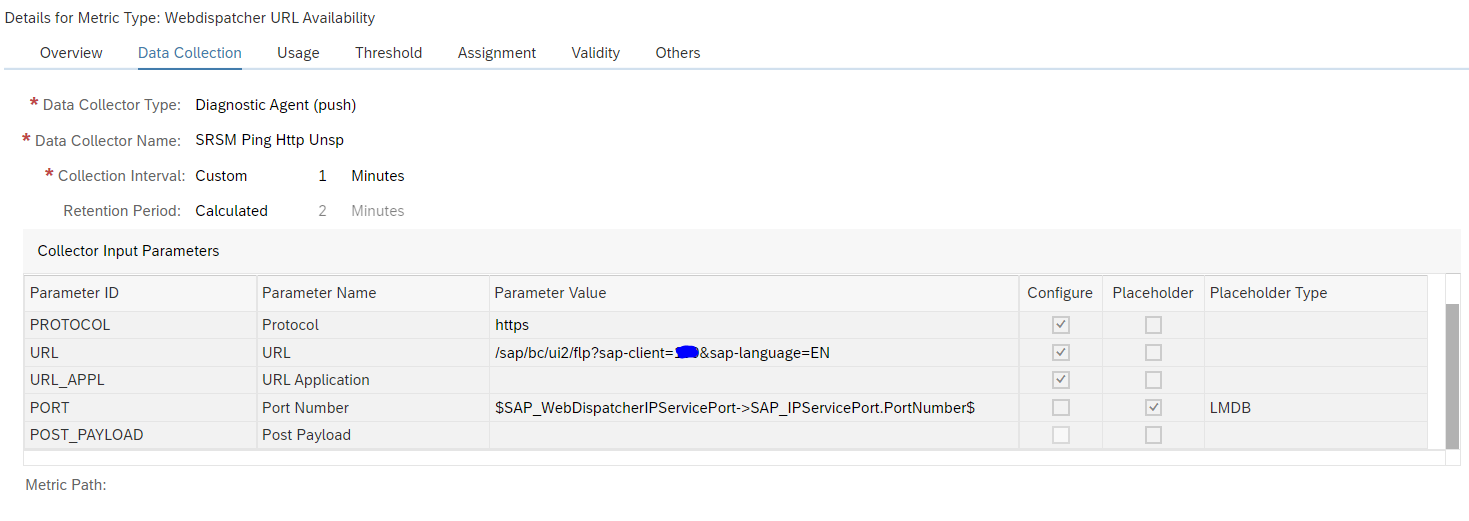
Data Collection

All parameters of the Data Collector which are fixed should have the “Configure” box unticked, and the common parameters pre-filled with the correct values.

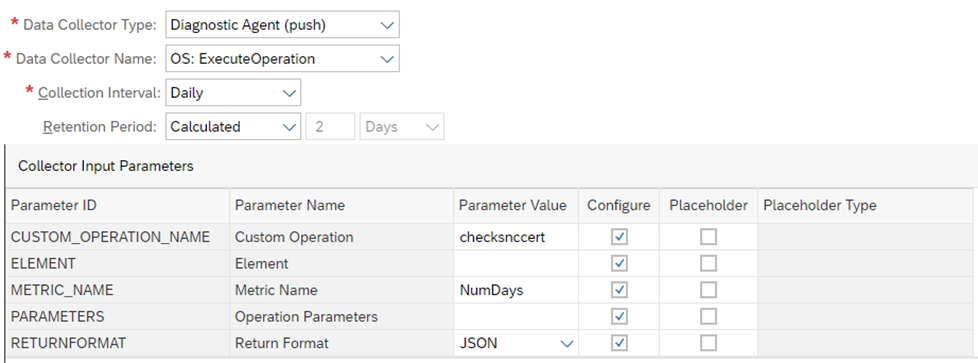
The “Custom Operation” parameter is the saphostctrl operation “checksnccert” created earlier. The “Metric Name” parameter is the name of the metric in the JSON output file produced by the script, which is “NumDays”.
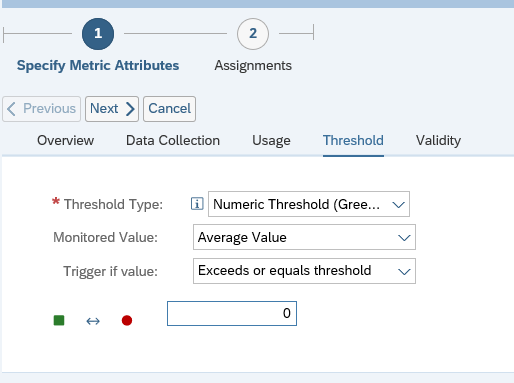
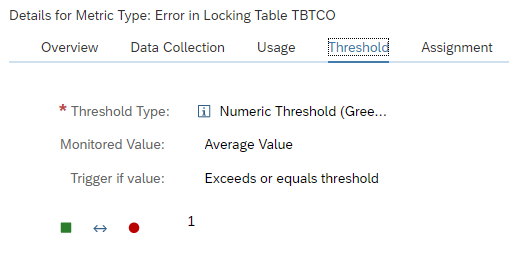
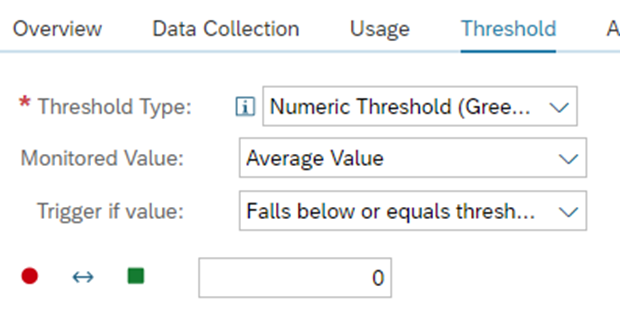
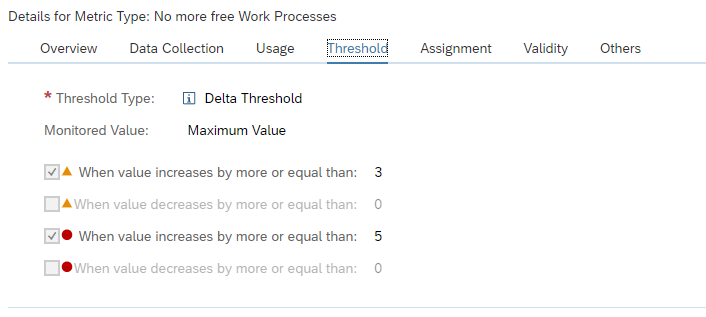
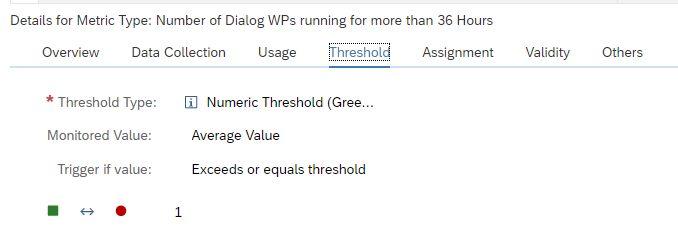
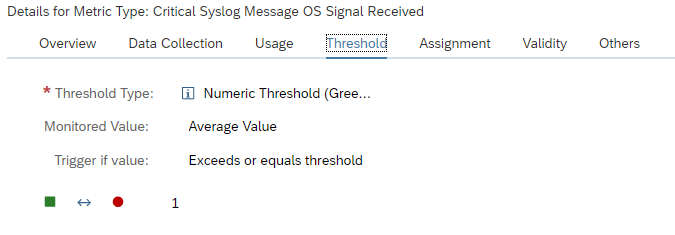
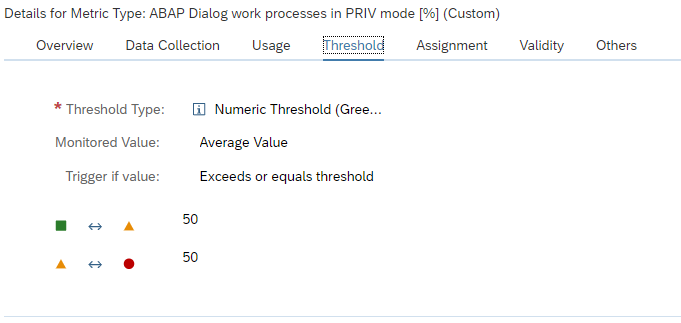
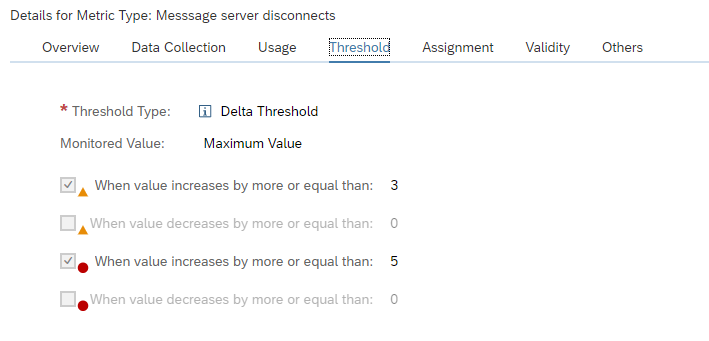
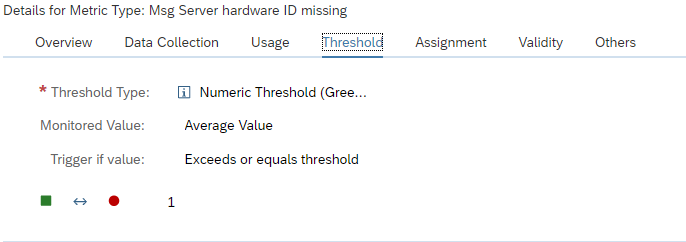
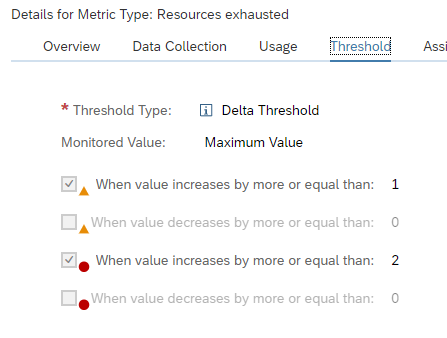
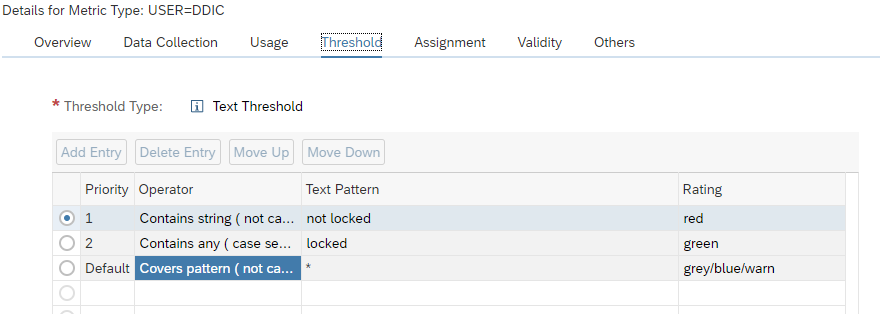
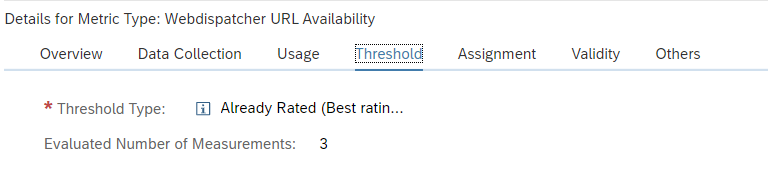
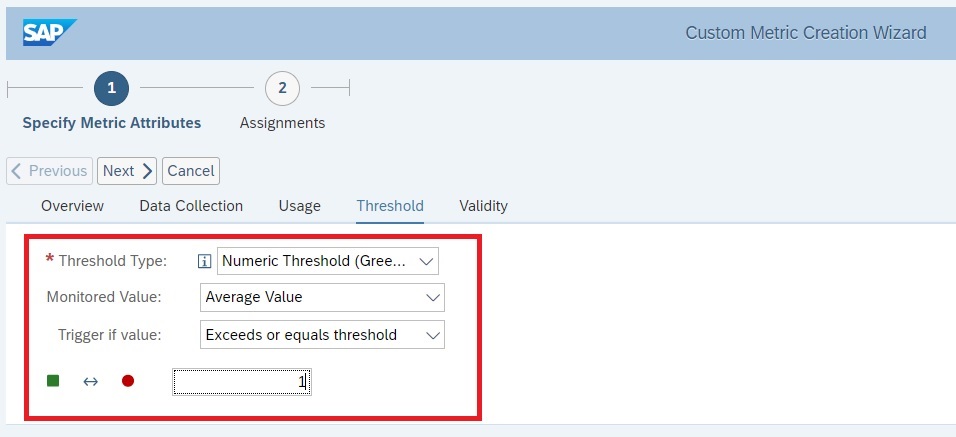
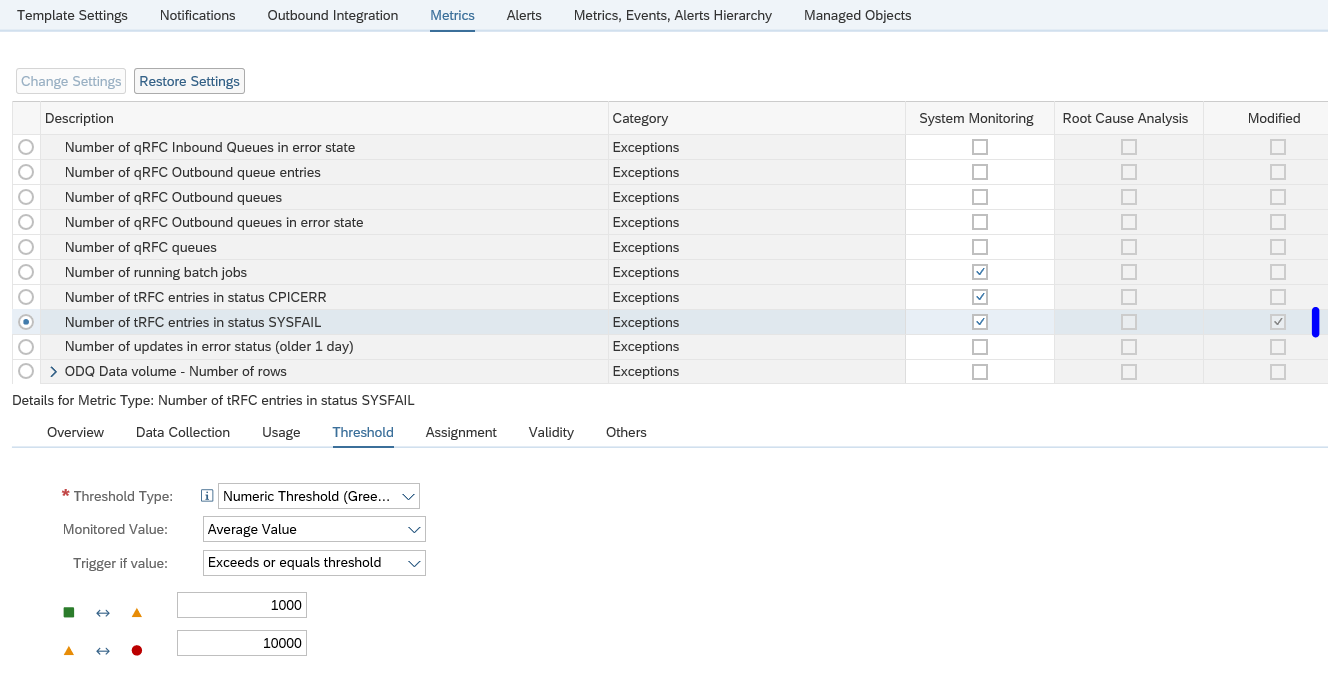
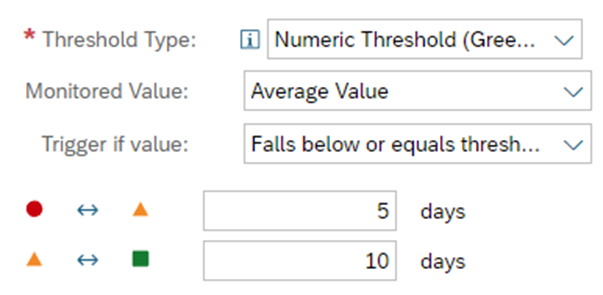
Threshold

The threshold picks up the integer as returned by the script; if it falls to below or equals 10 days, then raise a yellow alert, if below or equals 5 days, then raise a red alert. Choose whatever threshold values suit you.
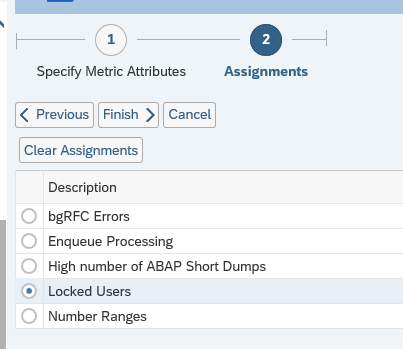
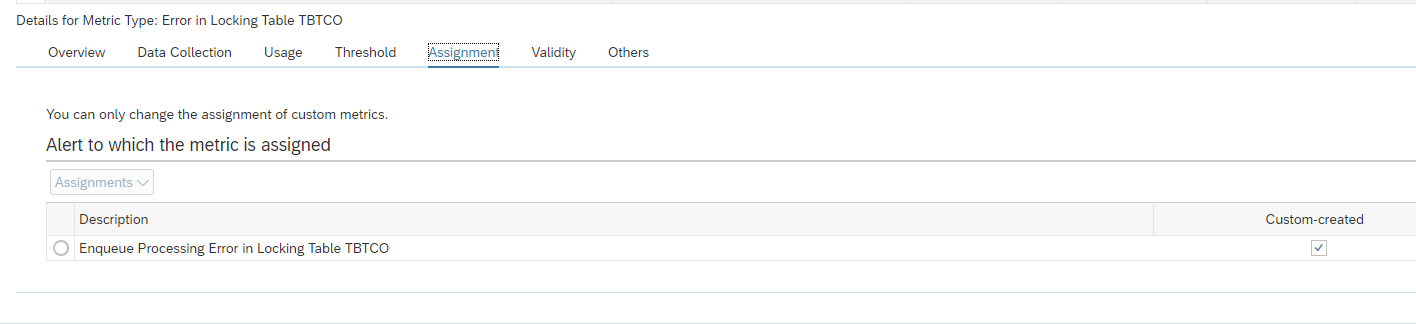
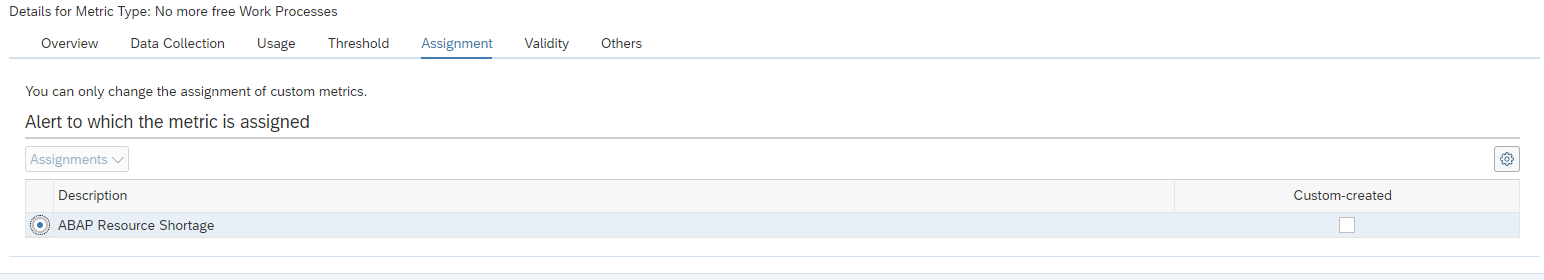
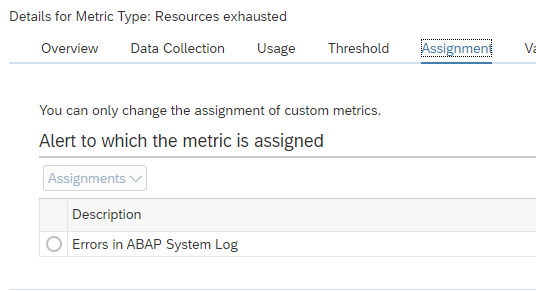
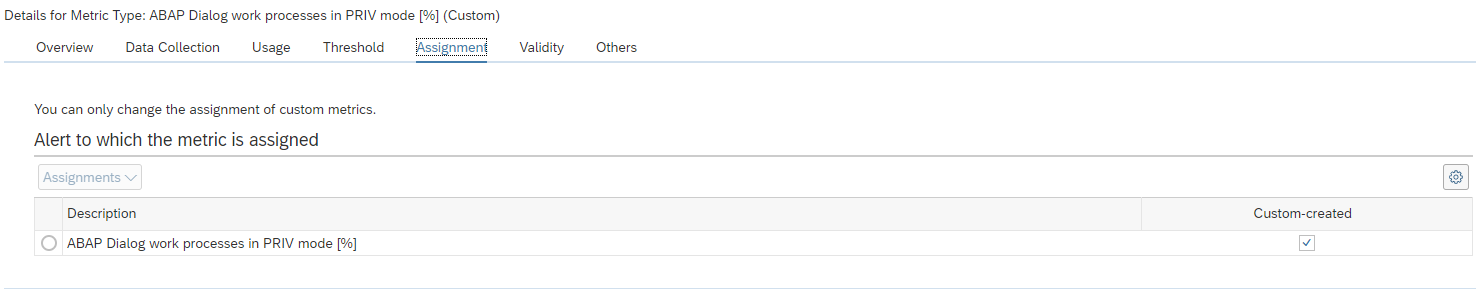
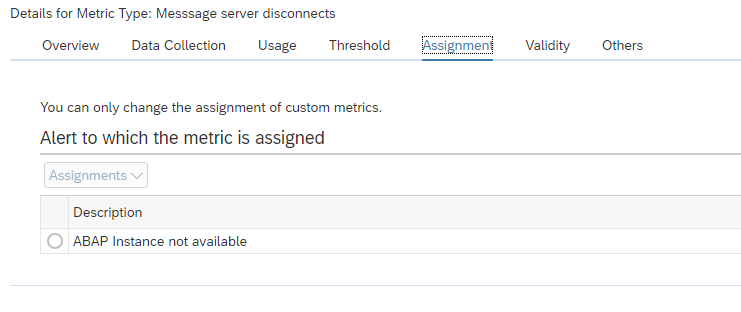
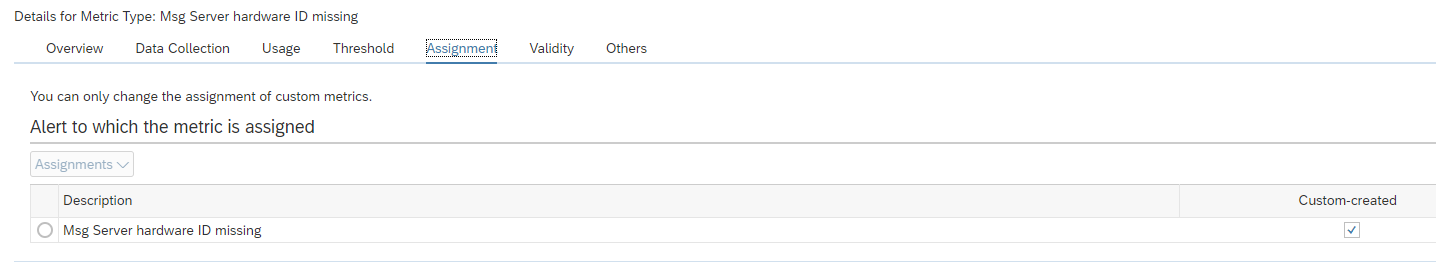
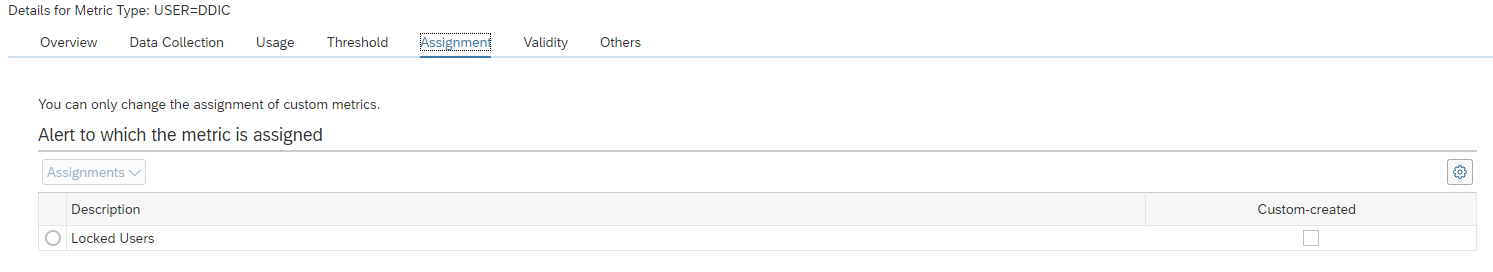
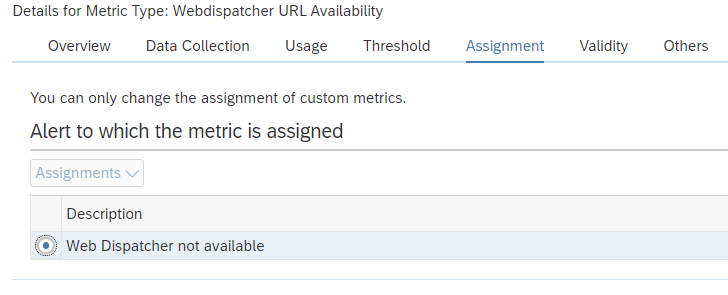
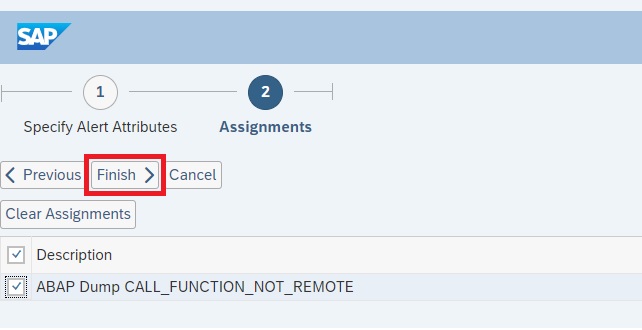
Assignment

Assign the Metric to the Alert:
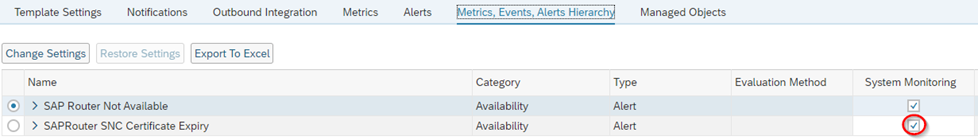
Activate the Alert

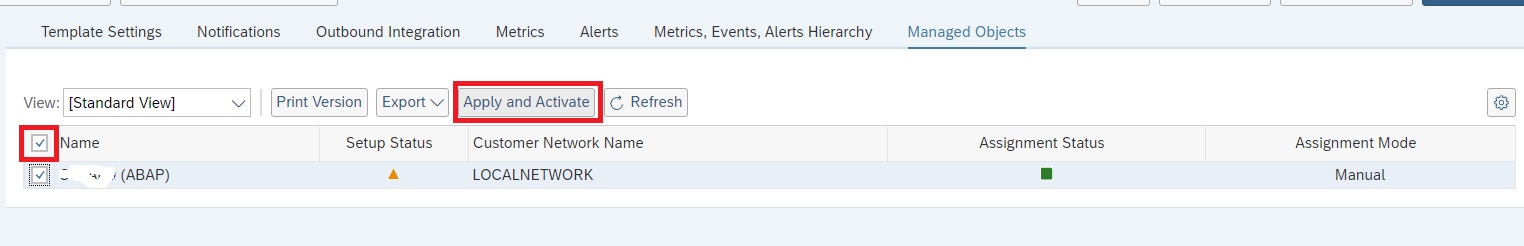
Apply SAPRouter Template and Check Monitoring

TIP: Initially set the collection interval to 5 minutes and apply template to see whether it is collecting data. Then you can set the collection interval back to daily.

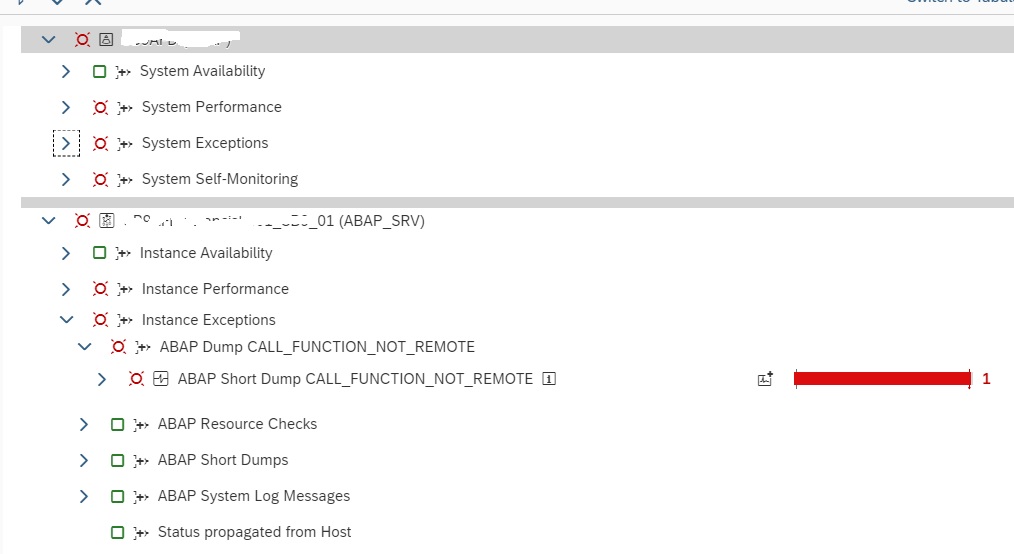
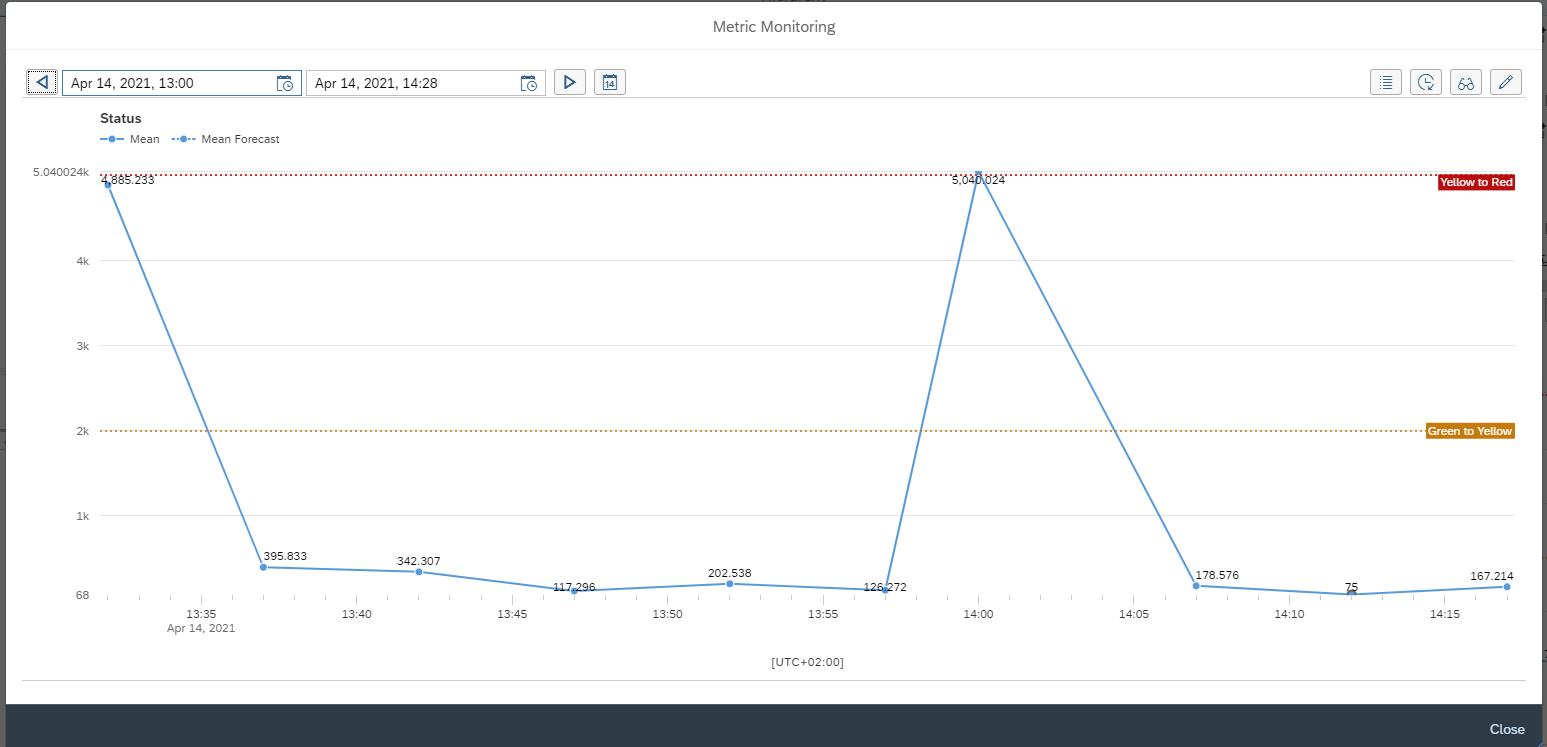
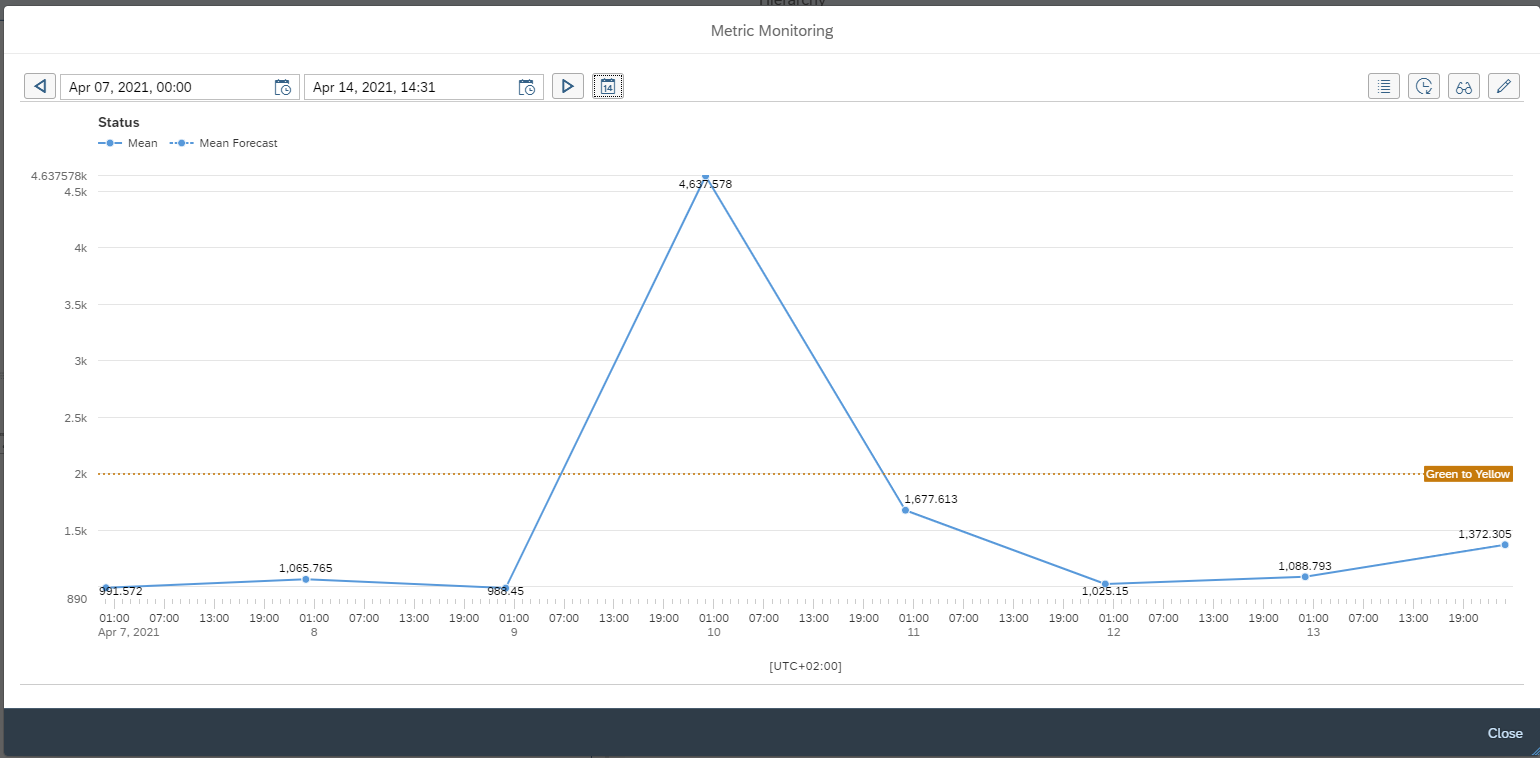
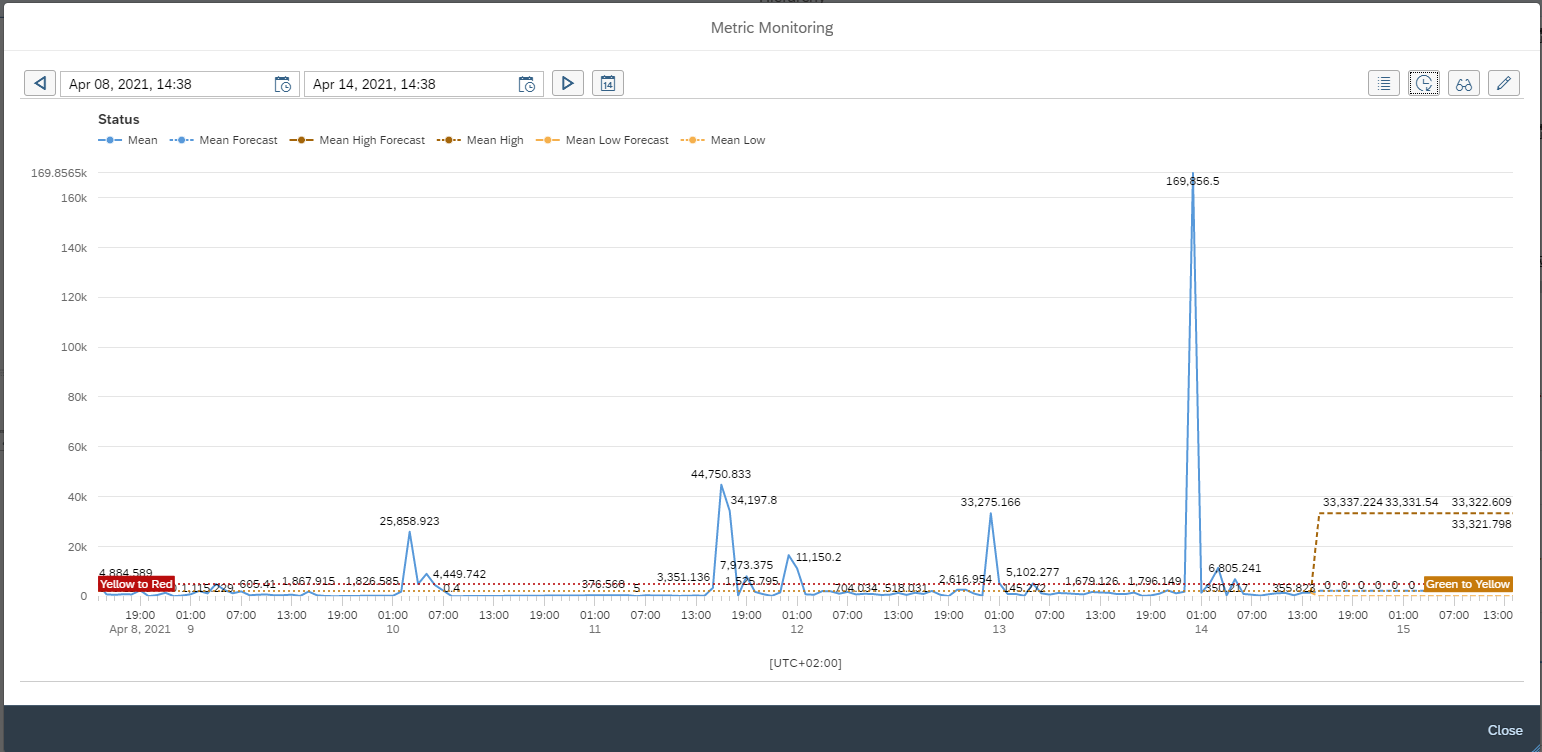
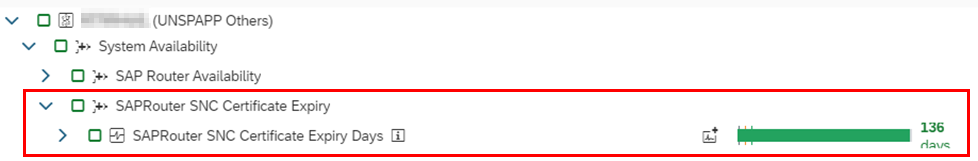
You should see this in the Monitoring Application:

Appendix A: saprouter_expiry_days.sh

#!/bin/bash
# Outputs the expiry date of the SNC Certificate and calculates the number of days
# If the number of days falls below threshold, it sends an alert
# Written by Tony Swietochowski

SAPROUTER_USER=saprouter
SAPROUTER_HOME=/usr/sap/saprouter
SECUDIR=$SAPROUTER_HOME/sec
PSE=local.pse
HOSTNAME=$(hostname -f)

# Check  for saprouter user
[[ ! "$USER"=="$SAPROUTER_USER" ]] && echo "This script must be run using the $SAPROUTER_USER user. Exiting." && exit 1

EXPIRYDATE=$(${SAPROUTER_HOME}/sapgenpse get_my_name -p $PSE -n validity 2>&1 | grep NotAfter | awk -F\( '{print$2}' | cut -c -6)
NUMDAYS=$(echo $(( ($(echo $(date --date="$EXPIRYDATE" +%s) - $(date -d $(date +%y%m%d) +%s)) )/86400 )))
# Above method based on https://stackoverflow.com/questions/4946785/how-to-find-the-difference-in-days-between-two-dates

echo $NUMDAYS > $SAPROUTER_HOME/NUMDAYS
echo \{type:integer, name:NumDays, value:$NUMDAYS\} > $SAPROUTER_HOME/NUMDAYS.json

Appendix B: saprouter_expiry_days.bat

@echo off

REM Outputs the expiry date of the SNC Certificate and calculates the number of days
REM If the number of days falls below threshold, it sends an alert
REM Written by Tony Swietochowski

set SAPROUTER_HOME=D:\usr\sap\saprouter
set SECUDIR=%SAPROUTER_HOME%\sec
set SNC_LIB=%SECUDIR%\sapcrypto.dll
set PSE=local.pse

for /f "tokens=2 delims=\" %%i in ('whoami') do set THISUSER=%%i
FOR /F "tokens=* USEBACKQ" %%F IN (`hostname`) DO (SET HOSTNAME=%%F)

chdir /d %SAPROUTER_HOME%

for /f "tokens=2 delims=(" %%a in ('%SAPROUTER_HOME%\sapgenpse.exe get_my_name -p %PSE% -n validity ^2^>^&^1 ^| findstr /l "NotAfter"') do set DATESTRING=(%%a

set expiry_year=20%DATESTRING:~1,2%
set expiry_month=%DATESTRING:~3,2%
set expiry_day=%DATESTRING:~5,2%

set current_year=%date:~-4%
set current_month=%date:~4,2%
set current_day=%date:~7,2%

set "from=%current_month%-%current_day%-%current_year%"
set "to=%expiry_month%-%expiry_day%-%expiry_year%"
echo Wscript.Echo DateDiff("d", "%from%", "%to%") > %TEMP%\tmp.vbs

for /f %%a in ('cscript /nologo %TEMP%\tmp.vbs') do set /a "numdays=%%a"

del %TEMP%\tmp.vbs

echo Number of days to SAPRouter certificate expiry: %numdays% > %SAPROUTER_HOME%\NUMDAYS.log
echo {type:integer, name:NumDays, value:%numdays%} > %SAPROUTER_HOME%\NUMDAYS.json

<< This blog was originally posted on SAP Focused Run Guru by Tony Swietochowski (DXC). Repost done with permission. >>

SAP Focused Run creation of custom metrics for system monitoring

In most cases a fine tuning of an existing SAP template is sufficient for your needs.

In some cases you want to have your own metric defined to monitor a special part of the SAP system. This own created metrics are also called custom metric.

SAP, when you read this blog, please feel free to copy any of the custom metrics below into the standard SAP set. This will help everybody.

Questions that will be answered in this blog are:

  • How do I create a custom monitoring metric?
  • Do I need to re-create the custom metric per monitoring template?
  • What are examples of custom metrics?

Creating custom metric

In this example we create a custom metric to make sure that the background user WF-BATCH is not locked by accident.

There is already a metric in the ABAP template that is called User Lock Status. This can be used as a basis for our custom metric.

Goto your template into change mode and on top left choose Create (you need to be in Expert mode first):

And select Metric. Now the screen opens for a new metric creation:

Fill out the details, and create a custom description:

Now go to the tab Data Collection:

Copy the data from your reference metric here. Don’t forget to fill out the Parameter Value. In this case WF-BATCH. Also make sure you have a reasonable Collection Interval timing. Not everything is need to be collected every 5 minutes.

Now go to the tab Threshold:

Configure your threshold setting.

Now press the Next button and assign the metric to the correct group:

Now press Finish to save the metric.

The new custom metric is now available in the monitoring template:

You see that this one has the Custom created marked. Later you can use the filter on Custom created column to quickly find it again.

Deploying custom metric to other templates

If you have to deploy the custom metric to other templates: so far this is a manual action. Per template you have to re-create the same custom metric. I have not found a nice way of re-using custom metrics yet.

List of other custom metrics

See below:

  • Checking for certificates that are about to be expired and already expired certificates (in stead of only one out of the box metric that contains both)
  • Checking web dispatcher URL
  • Detecting errors in table locking of TBTCO
  • Detecting if file system is mounted
  • Detecting long running DIA processes
  • Detecting no more free work processes
  • Detecting OS signals
  • Detecting PRIV modes
  • Detecting message server disconnects
  • Detecting missing hardware ID
  • Detecting resource exhaustion in ABAP system
  • Detecting specific ABAP short dumps
  • User lock status of DDIC and SAP*

Other interesting ones:

For system log message read OSS note 3391086 – Grey Metrics for ABAP Syslog.

Detecting errors in table locking of TBTCO

From availability perspective, you want to detect as quickly as possible if you are suffering from locking errors of table TBTCO. TBTCO table is used for printing. If the locking error situation occurs the printing function will fail, and even worse, it can impact the complete SAP ABAP system.

You can create a custom monitoring metric to measure and act on this.

Create technical name Z_METRIC_ERR_LOCK_TBTCO:

In the data collection:

Data to enter: RFC on diagnostics agent (push). Select ABAP System Log Stats. Filter on message text *TBTCO*. This captures severe errors for TBTCO like the locking error.

Define the threshold for alerting:

And assign the metric to the ABAP Instance not available alert group:

Detecting if file system is mounted

Some filesystems are critical to a business, such as those used in interfaces. This custom metric group will alert if a filesystem is not mounted.

Create the Bash Script to Check the Filesystem Status

Firstly, we need to create a bash script that takes the filesystem as its input argument and then checks its status. Create the following script called /sbin/checkfilesystemmounted.sh (owner is root, permissions 755). You may put this script somewhere else if you prefer, but be sure to refer to the correct location later on in this post.

#!/bin/bash
findmnt $1 >/dev/null && echo \{type:integer, name:FileSystemMounted, value:1\} || echo \{type:integer, name:FileSystemMounted, value:0\}

The findmnt command returns the mount details if the filesystem is mounted. The filesystem is passed as a script argument in variable $1. If the filesystem is mounted, the script returns integer 1. If the filesystem is not mounted, the script returns integer 0. For example, to check your desired filesystem, execute it like this as root:

/sbin/checkfilesystemmounted.sh /the/filesystem/you/want/to/check

The output will be in JSON format. If the filesystem is mounted, the value will be 1, as follows:

{type:integer, name:FileSystemMounted, value:1}

The name:FileSystemMounted is the name of the value to be picked up by saphostctrl, as described next.

Create the Custom Operation for saphostctrl

To load these values into Focused Run, we create a custom operation for saphostctrl. Create the following custom operations conf file:

/usr/sap/hostctrl/exe/operations.d/checkfilesystemmounted.conf

This contains:

Command: /sbin/checkfilesystemmounted.sh $[FILESYSTEM]
Workdir: /home/sapadm
Description: Check if filesystem is mounted
ResultConverter: flat
Platform: Unix

To test the custom operation, execute the following command:

/usr/sap/hostctrl/exe/saphostctrl -function ExecuteOperation -name checkfilesystemmounted FILESYSTEM=/the/filesystem/you/want/to/check

The result should be as per the following example:

Webmethod returned successfully
Operation ID: 0A02C69098121EDDA68C041B50FE858D

----- Response data ----
description=Check if filesystem is mounted
{type:integer, name:FileSystemMounted, value:1}
exitcode=0
Create the Custom Alert in SAP Focused Run

In Focused Run, we create an alert in a Linux host monitoring template. For example, the alert name is “Interface Filesystem not Mounted”. The Alert should be in Category “Exceptions” and the Severity is up to you. In this case it is 9.

Create the Custom Metric Group in SAP Focused Run

Next, we create the custom Metric Group . A Metric Group allows variants to be created, and each variant corresponds to a filesystem you wish to monitor.

Overview Tab:
  • Name: “Interface Filesystem not Mounted”
  • Category: Exceptions
  • Class: Metric Group
  • Data Type: Integer
  • Technical Name: INTERFACE_FILESYSTEM_NOT_MOUNTED

Data Collection Tab:
  • Data Collector Type: Diagnostic Agent (push)
  • Data Collector Name: OS: ExecuteOperation
  • Collection Interval: 5 Minutes (depending on the criticality)
  • CUSTOM_OPERATION_NAME: checkfileystemmounted – This corresponds to the custom operation for saphostctrl created earlier
  • METRIC_NAME: FileSystemMounted – This corresponds to the name of the metric in the JSON output by the bash script
  • RETURNFORMAT: JSON – This is the output format of the bash script

Usage Tab:

Threshold Tab:

As the script returns a numeric value 0 if the filesystem is not mounted, then the threshold will alert if the value is 0.

Assignment Tab

Assign to the custom alert created earlier.

Add Variants

The variable passed to the saphostctrl operation is “FILESYSTEM”. We can add the rest of the filesystems as individual variants. The format for the operation parameters is as follows:

FILESYSTEM:/the/filesystem/you/want/to/check

For example:

You can enter as many filesystems as you like as separate variants.

Activate Alert

Go to the “Metrics, Events, Alerts Hierarchy” tab, and activate System Monitoring.

Testing the Metric

In a non-Production environment, try to unmount a filesystem, and at most 5 minutes later, there should be an alert produced.

Detecting no more free work processes

From availability perspective, you want to detect as quickly as possible if you don’t have any free work processes left.

The template to be adjusted is the technical instance SAP ABAP 7.10 and higher template. Don’t forget to tick it on for monitoring otherwise it is not active.

In expert mode create a custom metric.

Create technical name Z_NO_FREE:

In the data collection:

Data to enter: RFC on diagnostics agent (push). Select ABAP System Log Stats. Filter on message number QoG with text *NOWP*.. For more information on system log messages, read this blog.

Define the threshold for alerting:

And assign the metric to the ABAP Resource Shortage alert group:

Detecting long running DIA process

In some exceptional cases you can have a DIA process that runs for a long time without action and still occupies the resources.

You can create a custom monitoring metric to measure and act on this. The template to be adjusted is the technical system SAP ABAP 7.10 and higher template. Don’t forget to tick it on for monitoring otherwise it is not active.

In expert mode create a custom metric. Create technical name Z_METRIC_LONGRUN_DIA_WP_36HRS:

Now setup the definition for the data collection:

It is using the Push.

And set the usage:

Last but not least: you need to set the alerting threshold:

The alert is raised if a single DIA work process is running longer than 36 hours.

Save the custom metric and make sure the template reassignment is done to activate the custom metric for your systems.

Detecting OS signals

In some cases the OS system will give critical signals to the SAP system that are visible in the ABAP system log. An example is the signal 11. When this happens, the system is in trouble and you as admin need to check fast to see what is going on to stop the system from full collapse, crash or very poor performance.

You can create a custom monitoring metric to measure and act on this.

The template to be adjusted is the technical instance SAP ABAP 7.10 and higher template.

Don’t forget to tick it on for monitoring otherwise it is not active.

In expert mode create a custom metric.

Create technical name Z_METRIC_OS_SIGNAL_RECEIVED:

In the data collection:

Data to enter: RFC on diagnostics agent (push). Select ABAP System Log Stats. Filter on MSG_ID QoE. This captures severe errors for OS signals.

Define the threshold for alerting:

And assign the metric to the system message alert group:

Detecting PRIV modes

The template to be adjusted is the technical system SAP ABAP 7.10 and higher template. Don’t forget to tick it on for monitoring otherwise it is not active.

Create technical name Z_METRIC_DIA_WP_PRIV:

Now setup the definition for the data collection:

This will collect the PRIV dialog processes in percentage.

Mark the custom metric as relevant for monitoring:

And set the assignment:

Last but not least: you need to set the alerting threshold:

Save the custom metric and make sure the template reassignment is done to activate the custom metric for your systems.

Detecting message server disconnects

From availability perspective, you want to detect as quickly as possible if you are suffering from message server disconnects.

Creation of the custom metric for message server disconnects

Create technical name Z_MESSAGE_SERVER_DISCONNECT:

In the data collection:

Data to enter: RFC on diagnostics agent (push). Select ABAP System Log Stats. Filter on message number Q0L, Q0M and Q0N. Any of those indicate message server errors. For more information on system log messages, read this blog.

Define the threshold for alerting:

And assign the metric to the ABAP Instance not available alert group:

Detecting missing hardware ID

From availability perspective, you want to detect as quickly as possible if you are suffering from missing hardware ID.

The template to be adjusted is the technical instance SAP ABAP 7.10 and higher template. Don’t forget to tick it on for monitoring otherwise it is not active.

In expert mode create a custom metric.

Create technical name Z_METRIC_MSG_SRV_HW_ID_MISSING:

In the data collection:

Data to enter: RFC on diagnostics agent (push). Select ABAP System Log Stats. Filter on message number Q16. This indicates missing hardware ID. For more information on system log messages, read this blog.

Define the threshold for alerting:

And assign the metric to the ABAP Instance not available alert group, create a custom alert group:

detecting resource exhaustion in ABAP system

From availability perspective, you want to detect as quickly as possible if you are suffering from resource exhaustion.

You can create a custom monitoring metric to measure and act on this.

Creation of the custom metric for resource exhaustion

Create technical name Z_EXHAUST:

In the data collection:

Data to enter: RFC on diagnostics agent (push). Select ABAP System Log Stats. Filter on message number Q40. This is the message for resources exhausted. For more information on system log messages, read this blog.

Set the usage to monitoring:

Define the threshold for alerting:

And assign the metric to the ABAP Instance not available alert group:

User lock status of DDIC and SAP*

From security perspective, you want to validate that 2 important users are locked in the main system clients: SAP* and DDIC. For more background you can read this blog.

Create technical name ZUSER_LOCK_STATUS:

In the data collection:

Data to enter: RFC diagnostics agent (push). User Lock status Data collector. Enter as parameters the user ID (DDIC) and the COLLECTOR_CONTEXT_ID as TECHNICAL_SYSTEM.

Set the threshold as a text threshold:

Set the red rating in case the string contains the word ‘not locked’ and set to green in case it contains the word ‘locked’.

Now assign it to Alert group for locked users:

Save the metric.

Repeat the same for SAP*.

Checking web dispatcher URL

When you are using a web dispatcher, you want to check that the main URL is available. You can achieve this via URL monitoring in health monitoring (see blog).

In some cases you want to integrate this vital start URL into system monitoring, since that is your main central tool.

You can create a custom monitoring metric to measure and act on this.

In the use case below we will setup URL monitoring for web dispatcher for SAP Netweaver Gateway serving FIORI pages.

Creation of the custom metric for web dispatcher URL monitoring

The template to be adjusted is the technical system SAP Web Dispatcher template. Don’t forget to tick it on for monitoring otherwise it is not active.

In expert mode create a custom metric. Create technical name Z_WEBDISPATCHER_URL_AVAILABILITY:

In the data collection:

Data to enter: RFC on diagnostics agent (push). Select SRSM Ping Http Unsp. Select the HTTPS protocol and setup the URL to monitor: /sap/bc/ui2/flp?sap-client=xxx&sap-language=EN. This is the main FIORI start URL. The port number is taken from the LMDB settings of the web dispatcher: $SAP_WebDispatcherIPServicePort->SAP_IPServicePort.PortNumber$.

Define the threshold for alerting:

We take here three measurements. If we don’t do this, a single glitch in the network will cause an alert to be triggered.

And assign the metric to the system message alert group:

Monitoring specific ABAP dumps

In System Monitoring of ABAP systems in Focused Run, with the standard monitoring template, we can monitor the frequency of ABAP dumps.

For monitoring if there are dumps of a specific type we have to create a custom metric. In this blog we explain how.

For creating a custom metric in the monitoring template, open the Template Maintenance App in the Advanced System Management area of Focused Run Launch-pad.

Open your custom ABAP instance level template in edit mode.

Switch to expert mode for template maintenance.

Click on Create –> Metric to create a custom metric.

Provide a Name, a Technical Name and metric type in the Overview tab as shown below.

In the Data collection tab enter details as shown below. Here for the parameter Error_ID you can provide the ID of the specific ABAP dump that you want to monitor.

Navigate to Threshold tab to specify the Threshold type and Threshold. For instance in this example we have specify the threshold to rate the metric as reed if there is 1 or more of the specific dump.

Now you can click on Next and then Finish button to save the metric.

Next you need to create a custom alert to generate a specific alert for this specific dump.

In the expert mode maintenance go to the Create button and then from the drop down select Alert.

Enter the details as shown below and click on Next button.

Then in the Assignments tab you will see the custom metric you just created. Select the check box for this metric and click on Finish to save the alert.

Now your custom metric is ready together with alerting active.

To activate this template update on all managed systems navigate to Managed Objects tab for the template and click on Apply and Activate button.

Now you can see custom metric under instance level in system monitoring.

<< This blog was originally posted on SAP Focused Run Guru by Frank Umans, Tony Swietochowski (DXC) and Manas Tripathy (Simac). Repost done with permission. >>

SAP Focused Run fine tuning of monitoring templates

This blog explains about the fine tuning of monitoring templates.

Questions that will be answered are:

  • How to update the SAP content for templates?
  • What is a good rule of thumb for the amount of templates to create and maintain?
  • Should I transport the templates or maintain them locally?
  • How to create your own template?
  • How to fine tune a single metric?
  • How to change the alerting settings of a metric?
  • How to assign the template to a system?
  • How to update the template of a system?
  • Which tools can I use to perform fine tuning of alert thresholds?
  • Can I perform a forecast based on the data?
  • Can I perform a sensitivity analysis?
  • Which installation activities are required to enable the forecast and sensitivity functions?
  • How do I define rule bassed template assignments?

SAP content updates

As a starting point you use the SAP pre-delivered content. Also the SAP content gets updated. OSS note 3275006 – Manual content update for FRUN-CONT 400 in SAP Focused Run. is keeping track of the updates. It also explains where to download the content files.

Use program RCSU_MANUAL_UPLOAD to upload the downloaded content. Then use the FIORI tile Content management to activate the new content:

And update the content or see it is already up-to-date:

Before you start fine tuning your own templates, make sure the standard SAP content is up-to-date.

Amount of templates to fine tune

In principle it is up to you to generate as much templates as needed. Initially it seems a good idea to have many different templates. The setback is that fine tuning a specific metric that is valid for all templates, you need to repeat this action. Also when you have fine tuned a template, you need to update the attached systems.

A good starting point for fine tuning is to have 2 templates to start with:

  1. Template for productive system
  2. Template for non-productive system

The template for productive system can have more metrics activated with sharper thresholds for generating alerts.

The main goal for a non-productive template can be focused on system availability only.

For productive system you want to manage all aspects of a system including performance and all content exceptions.

Local maintenance or transport

The template maintenance can be done on a productive Focused Run system directly. Or you can choose to maintain the templates on a trial/test Focused Run system, test it there, and then transport it to the productive Focused Run system. The transport is the best approach that gives the most control.

Who should fine tune a template?

This is an organisational question. If you let everybody maintain the templates and metric content of the templates, you will quickly loose control. Best to limit the amount of people to maintain the template settings. Be careful when handing out template control to a service provider. They tend to change the thresholds to very high levels, so they get less alerts. In stead of solving the alerts….

Creation of own template

Open the template maintenance Fiori tile:

Select the template you want to fine tune. In this example we will fine tune the Technical System template for ABAP 7.10 and higher:

Press the Edit button and then the button Create Custom Template:

Give the template a good name. The most descriptive text must be at the beginning.

Fine tuning the template

Case 1: include or exclude in monitoring

Goto the metrics tab:

In the system monitoring you can switch on or off metrics. Press save after each change to save your setting changes.

Case 2: fine tune data selection

In the standard SAP delivery there is an alert for Number of long running Dialog Work Processes. Goto the Expert mode (button top rights), then select the tab data collection:

Go into edit mode via the Change Settings button, and you can update the field value in parameter value for WP_MIN_RUNTIME to your needs:

This is just an example. You can fine tune a lot of metrics in this way.

Case 3: fine tune threshold and alert settings

If you want to change the thresholds, first click on the expert mode button on the top right corner. Then press the Change setting button to edit the Threshold tab settings:

In this example we changed the type from Numeric (green/red) to Numeric (green/yellow/red) and we changed the values. The modified column indicates that we have changed a metric and

that the definition is different from the standard SAP one.

On the Alerts tab you can make changes to the alert settings:

You can change the following:

  • If an alert is to be generated or not (Active means, alert is generated)
  • Severity of the alert
  • If an alert will be automatically confirmed when the system detects that the issue is solved
  • If an automatic notification will be send or not

In the last tab Managed Objects you can see there are no systems assigned yet to the newly created template:

How to fine tune an alert in practice

In our example we will look at the Dialog Response Time metric. The current threshold for red alert is set to 5000 ms (5 seconds). The alert is triggered too often. But the question to answer now: what is a good threshold to set based on the historical data?

First click the Open metric in new window icon to enlarge the screen:

The enlarged screen now opens:

As you can see 2 times the red threshold was hit. We want to fine tune now. First select the calendar icon and select last 7 days to get full week overview:

You can use the forecast button to let the system create a forecast:

The forecast will now show mean, mean low and mean high forecast:

In this specific use case the prediction is that the maximum is 3300 ms (3.3 seconds).

Now open the statistics button to see the statistics and the recommended threshold tool button:

By changing the Sensitivity slider, the system will calculate different proposal for the alert threshold. In our case when we move sensitivity to 4 the new recommended threshold value is recalculated:

In this case it is 7669 ms.

So we now have collected following facts:

  • Current threshold of 5 seconds is reached too often
  • Average forecast based on history has a mean value of 3.3 seconds
  • Performing the sensitivity analysis the threshold recommendation is about 7.7 seconds

Based on this data the red threshold is best to increase from 5 to 8 seconds to get a good alert function. It will not reach too soon, hence limiting false alerts, but it will still alert in time in case poor performance happens.

Enabling forecast and sensitivity analysis

The forecast and sensitivity analysis function use the Application Function Library (AFL) and SAP HANA Automated Predictive Library (APL). These must be installed separately. The installation details and post steps for granting permissions are described in the Focused Run master guide in the section “Predictive Analytics Setup – Metric Forecasting”.

After the installation you must activate and assign PFCG role SAP_FRN_APP_PAS_DISP to be able to see the buttons.

Assigning custom template to a system

To assign a new custom template to a system, goto the Individual maintenance Fiori tile:

Select the system and press the button Change assignment and assign the wanted new template:

Now press the button Reconfigure to effectuate the template change.

Automation of template assignments can be configured as well by using rules.

Template updates

If you have systems assigned to a template, and you have executed template changes, goto the tab Managed objects in the template maintenance screen:

Select the systems and press the Apply and Activate button. The system will apply the updated template now.

If you use transport mechanism for template updates: after transport import, you need to go to the updated templates, and still to the update assignment. This is not automatically done after the transport.

Compare templates

In the main screen of template maintenance you can select the button Compare to start the template comparison app. Select the templates to compare:

You now see the delta’s between the templates:

Creating custom metrics

Creation of custom metrics is possible to have metrics for your specific needs.

The setback of custom metric is that it needs to be created each time for each template. This is another reason to keep the amount of custom templates as low as possible.

Read all about custom metrics in this blog.

Rule Based Template Assignment

When we perform Simple System Integration (SSI) on a managed system , it automatically activates the SAP default monitoring template on the managed system. However, in most of the SAP Focused Run (FRUN) implementation scenarios, we create customer defined monitoring templates (Custom Templates), which we then manually assign/activate on the managed system.

Rule Based Template Assignment is a feature in FRUN by which we can define based on managed system category which custom monitoring template to be assigned and activated directly when we perform SSI on the managed system.

Defining Rule Based Template Assignment

For Rule Based Template Assignment navigate to the Fiori tile Individual Maintenance in the Advanced System Management section of Fiori launch-pad.

In the Individual Maintenance App navigate to the Rule Maintenance by clicking on the button as shown below.

In the Rule Rule Based Assignment Screen, on the left hand side panel, select the specific Managed Object type for which you want to define the Rule Based Template Assignment.

In this blog we take the example of defining a Rule Based Template Assignment for managed system of type SAP ABAP BASIS 7.10 and higher and specify the custom template for System Level monitoring template. So we select Technical Systems upon which the right side panel now gives a list of all product types. In the right side panel we scroll down and select SAP ABAP BASIS 7.10 and higher.

Now we need to define the Rule based on which the Custom Defined Template to be defined. In this blog we take the example that we have defined 2 custom templates one for Production Systems and one for Non Production Systems. So we will need to define rule to assign template based on filters System Type ABAP and IT Admin role defined in LMDB. For more information on this function read this blog.

In the subsequent screen select Maintain Rules.

In the Maintain Rule screen we select the following filters.

Name your Rule and Save.

Similarly you can create Rule ABAP Non production, just ensure to select the following IT Admin Roles.

Now back in the main screen select the Rule you created from the drop down.

And for Template select the custom template you want to select for the assignment.

Add the assignment.

Now click in “Continue with Next Step” button until you come to the Reconfiguration tab and then close. This will allow you to save your Rule Assignment.

Once you have assigned the ABAP Production and ABAP Non production rules in the main screen you will see the following assignments listed.

After the assignments done, the next time SSI performed on any ABAP system will take up the custom monitoring template as defined in these rules.

In Individual Maintenance system list you can also see whether current assignment is SAP default or Rule Based Template Assignment.

<< This blog was originally posted on SAP Focused Run Guru by Frank Umans and Manas Tripathy (Simac). Repost done with permission. >>