This blog will give an overview of the Configuration and Security monitoring function of SAP Focused Run.
Questions that will be answered in this blog are:
- How does the Configuration and Security monitoring function of SAP Focused Run work?
- How can I quickly check my security baseline against all my systems?
- How can I quickly check the status of application of the security OSS notes?
- Can I see a trend in configuration and security monitoring to see if improvements are happening?
- How can I quickly determine configuration changes done in my systems?
- How can I quickly determine Cryptolib versions across my landscape?
- How can I quickly check disablement of webadmin page?
- How can I quickly check if any system has HTTP port still enabled?
- How can I monitor changes in RFC’s in ABAP systems?
- How to use configuration validation for transport tracking?
Configuration and security monitoring goal
The goal of configuration monitoring is to compare system settings for security versus the baseline defined in Focused Run. Deviations from the baseline can be reported.
The security and configuration validation can be used for:
- Validation of ABAP security parameters
- Validation of JAVA security parameters
- Validation of HANA security parameters
- Security OSS notes
- Diverse topics like client opening and SAP_ALL assignments
- Age of system components
- Cryptolib versions
- Disablement of webadmin page
- Check if HTTP port is enabled
- Monitor RFC changes in ABAP systems
- Many more
The technical explanation is perfectly explained on the SAP Focused Run expert portal.
Configuration and security monitoring policy
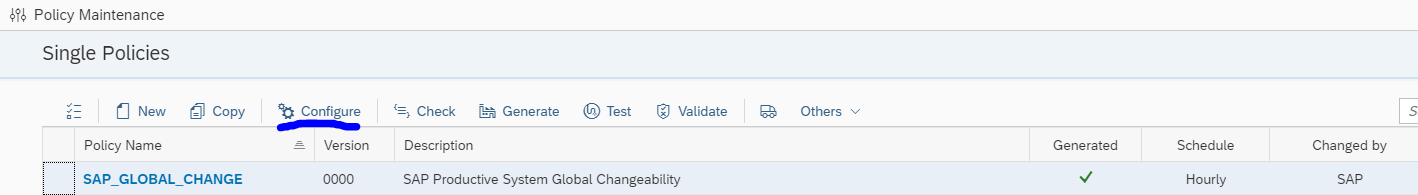
To view the policies for configuration monitoring click on the Fiori tile for Policy Management:
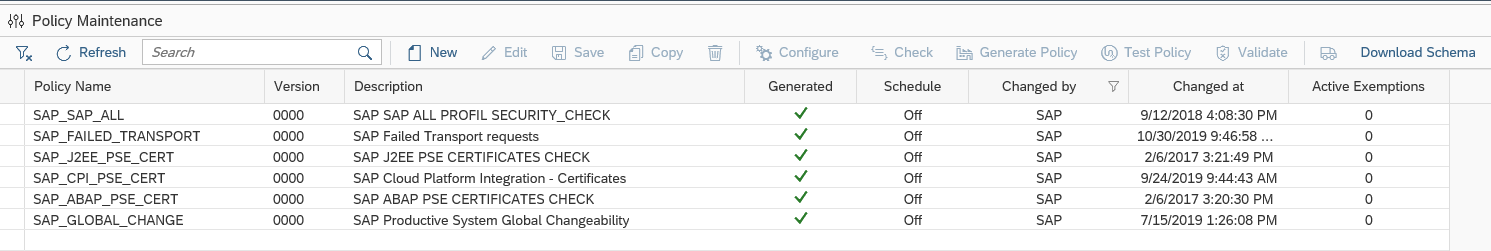
You now reach the policy maintenance overview screen:
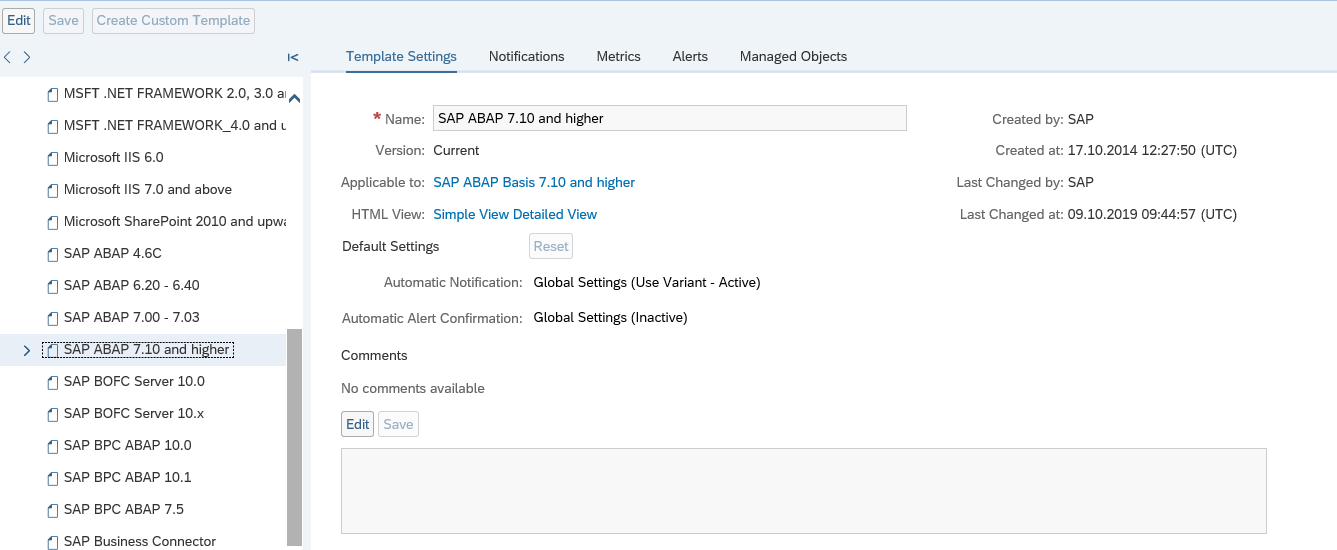
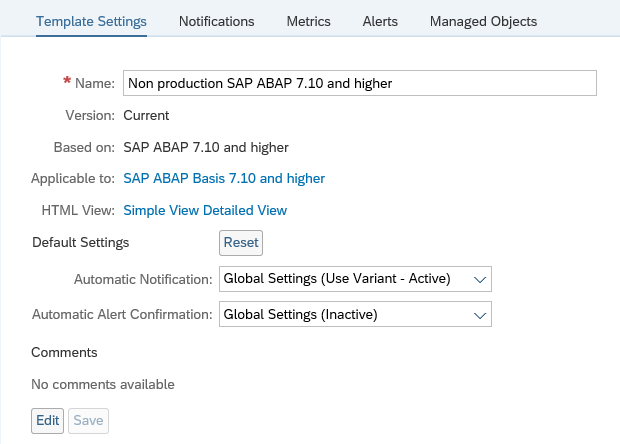
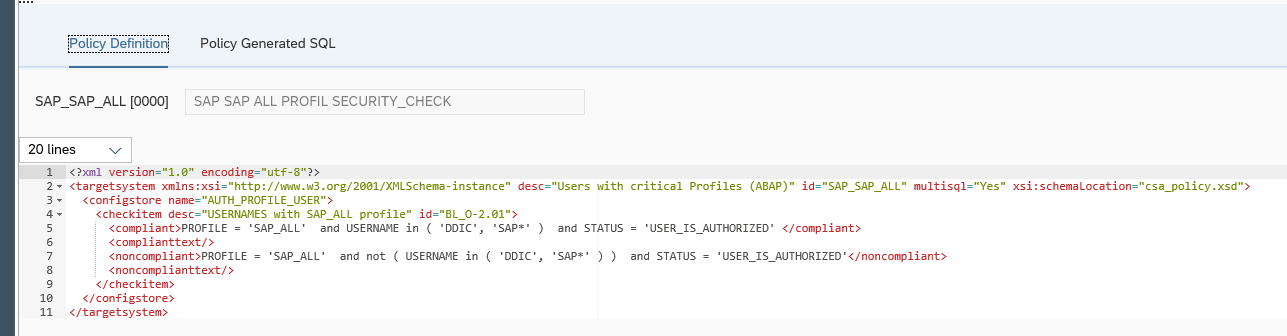
By selecting a policy, you can display the XML definition of the policy:
In a later blog we will explain fine tuning these XML definitions.
Running a policy
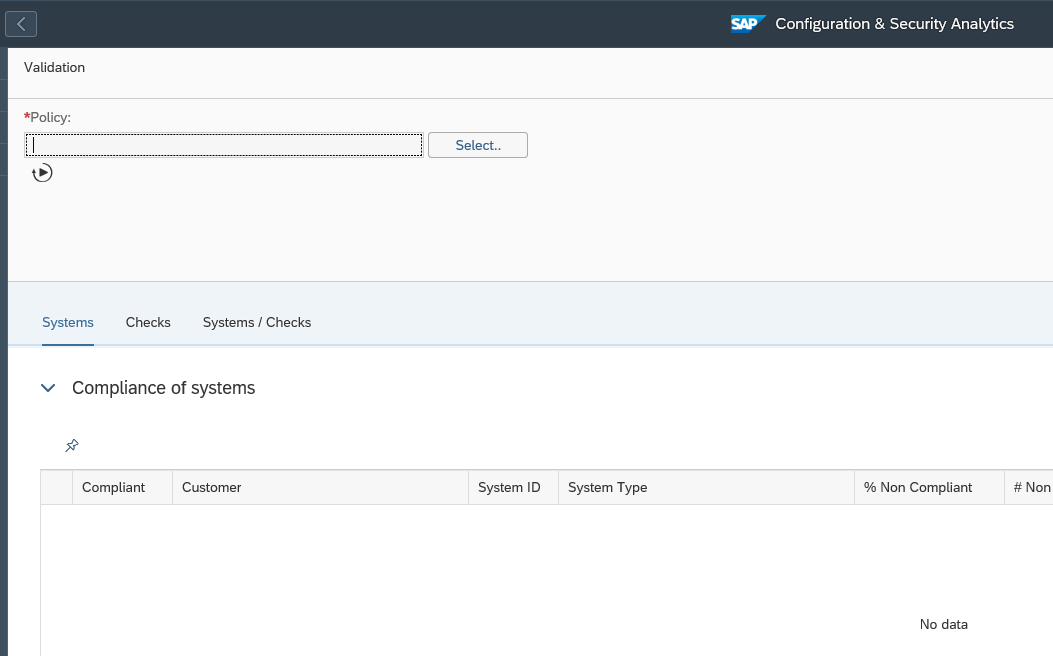
With the Fiori tile Configuration monitoring analytics you can run the policy against your systems:
After opening the tile you have to set the scope of systems. Then you reach the initial screen:
Now use the Select button to select the policy you want to run. The system will run the policy against the systems selected in the scope and show you the results:
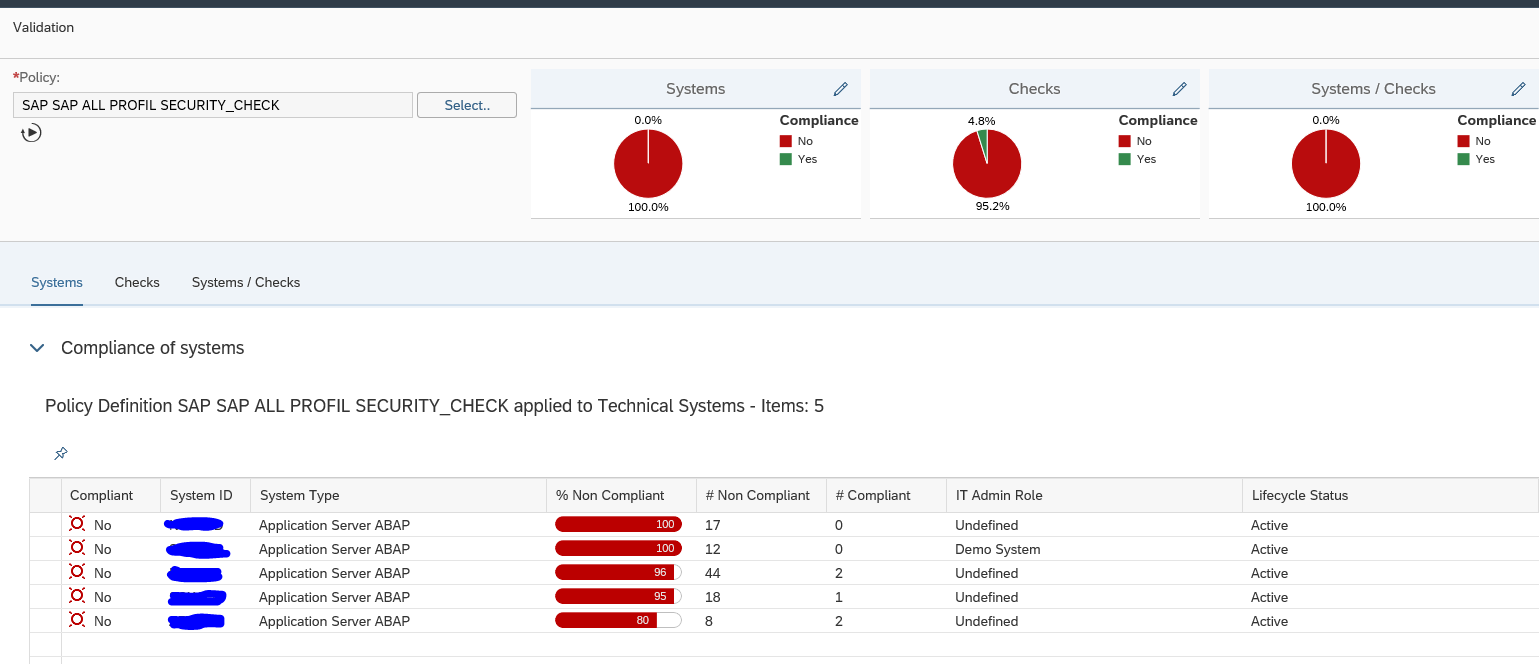
This is the overview across the systems. By clicking on a row you can zoom into that specific system:
Security baseline validation
The example above is a simple single check. You can define your own XML with your security baseline settings. The running is identical as the example above.
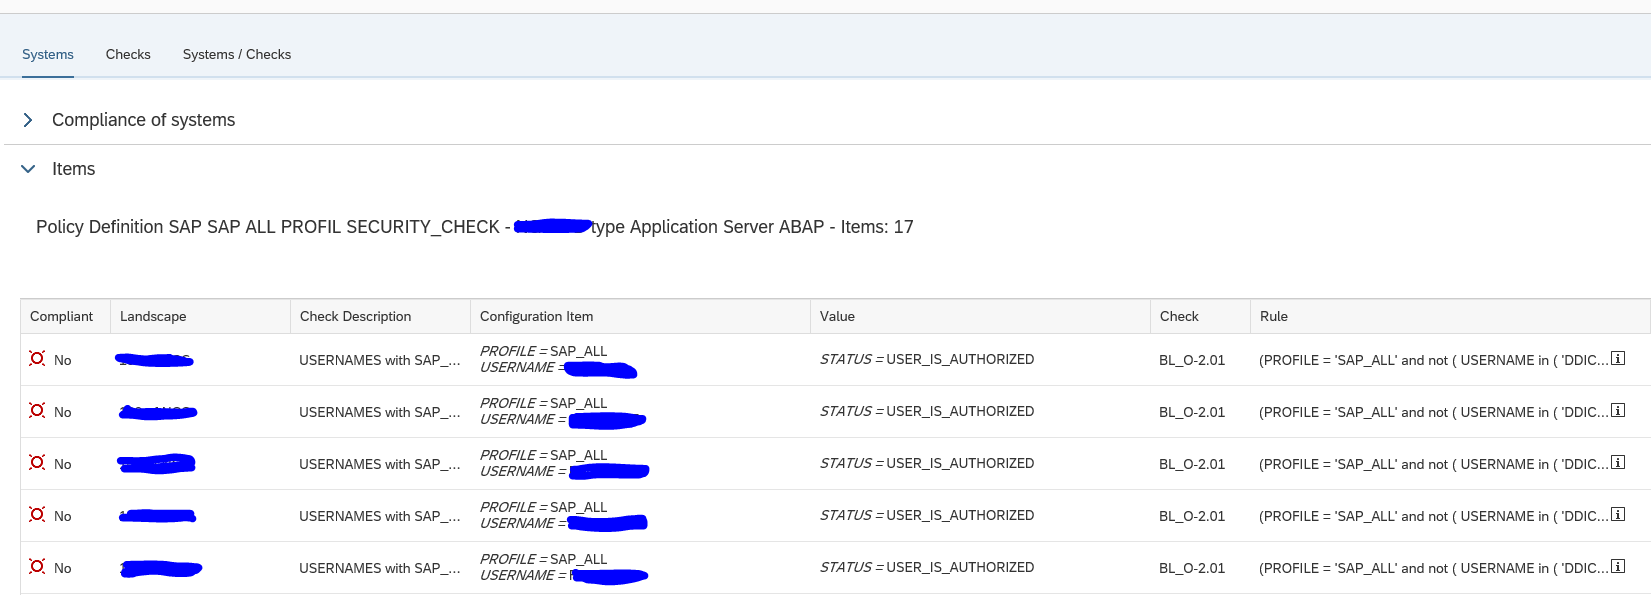
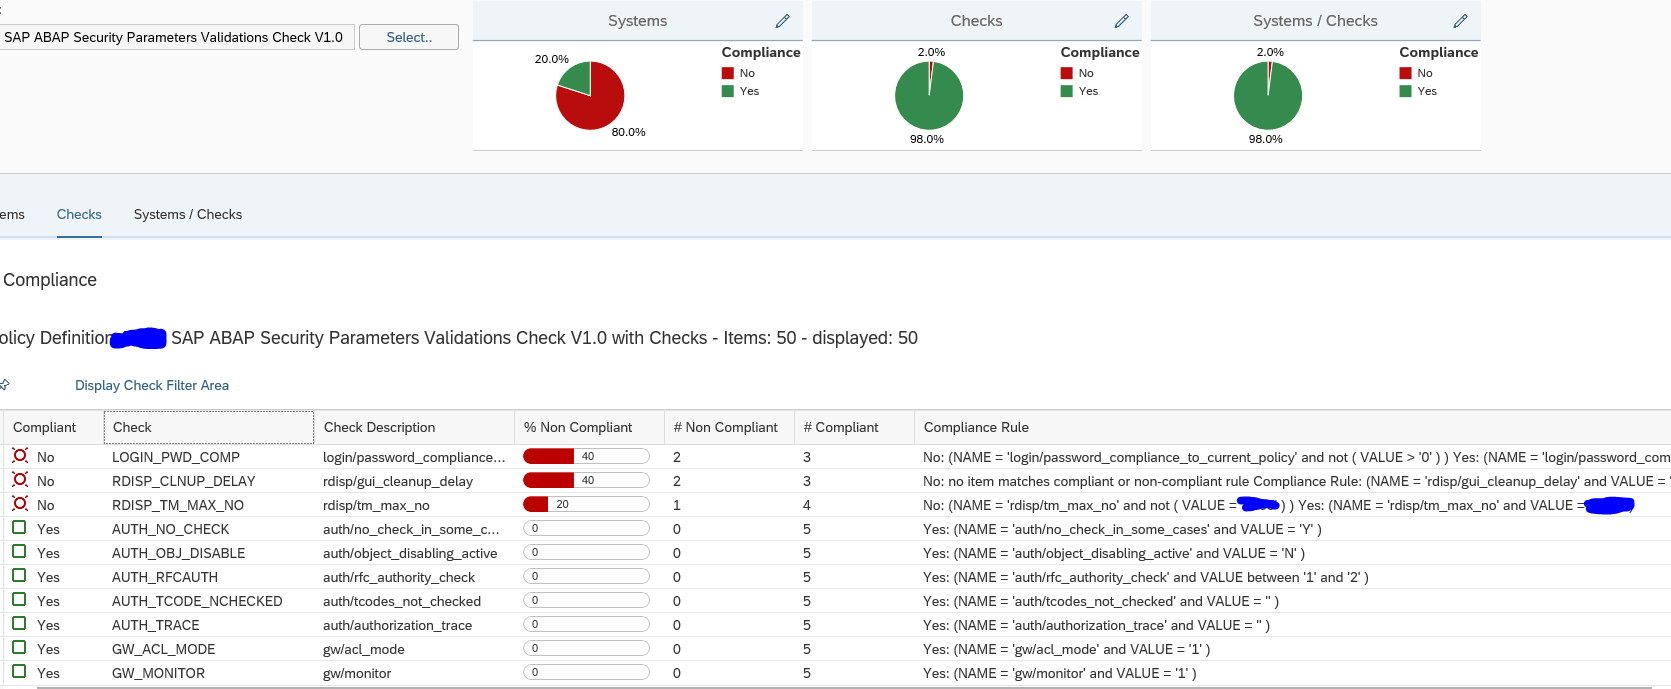
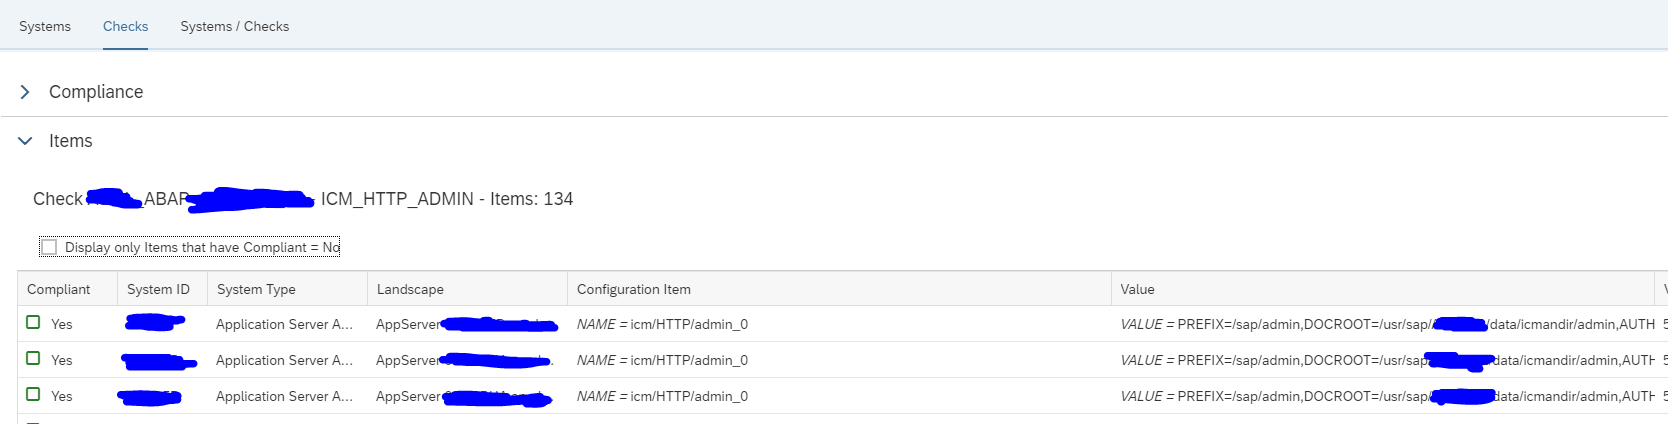
What you can do now as well is go to the Checks tab to see which item has the most compliance issues across all the systems:
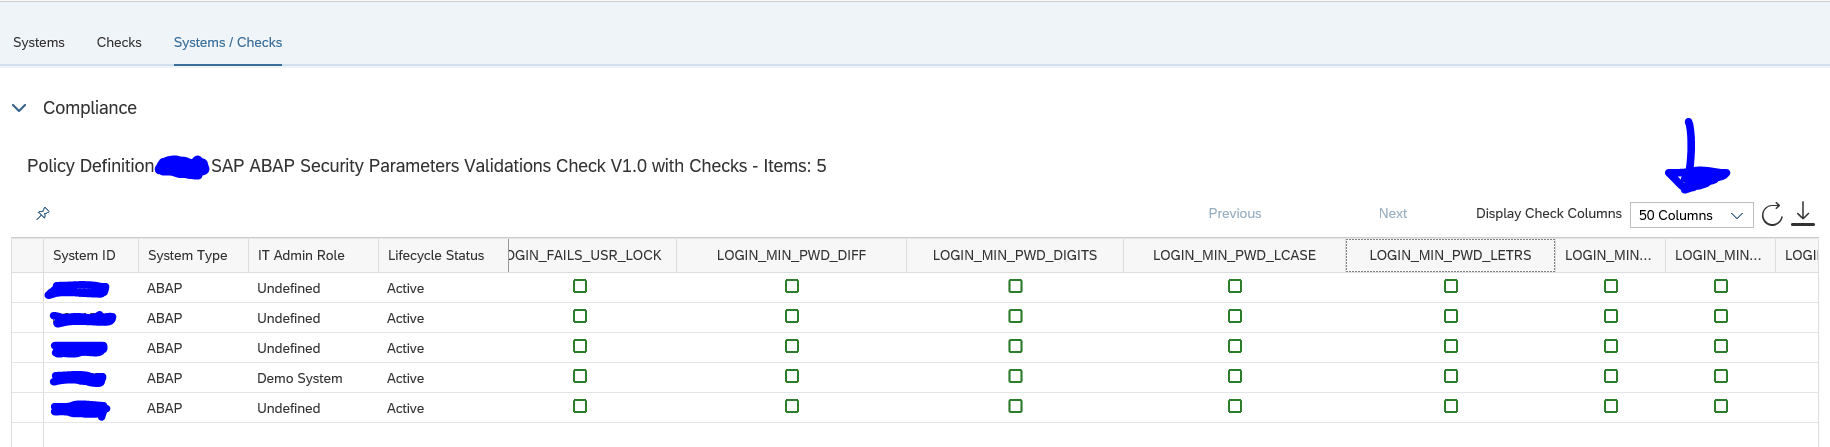
By clicking the Systems/Checks tab you can list out all items across all systems:
Remark: the default only shows 4 columns. You have to switch to multiple columns.
For the exact setup of this function, read this blog.
Security OSS notes
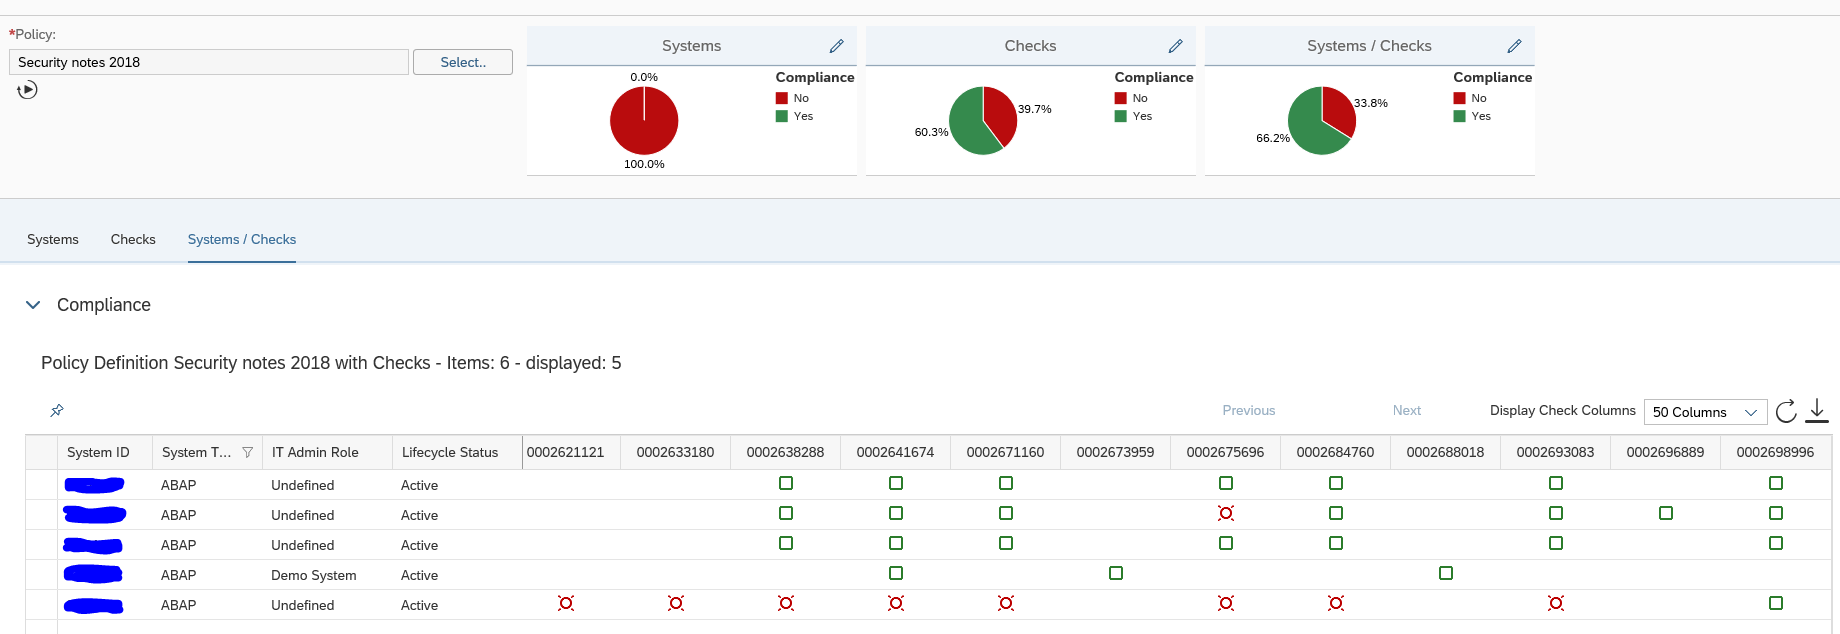
On the SAP github XML files can be downloaded for security note validation. You upload the XML as a policy in the Policy Administration. You now can run this policy against your systems to follow up on the status of the security OSS notes:
The XML file delivered by SAP checks the base version of the ABAP stack. So not all notes are relevant for all releases. If a note is not relevant the items is blank. If it is green, the note has been applied. If it is red, the note is not applied.
For the exact setup of monitoring security notes, read this blog.
SAP solution manager has a similar function called System Recommendations. The setup is more complex and follow up is far more cumbersome than with Focused Run. The only advantage of SAP solution manager System Recommendations is that the security notes content gets updated automatically. With SAP Focused Run you will need to monthly download the latest XML file on the security patch day.
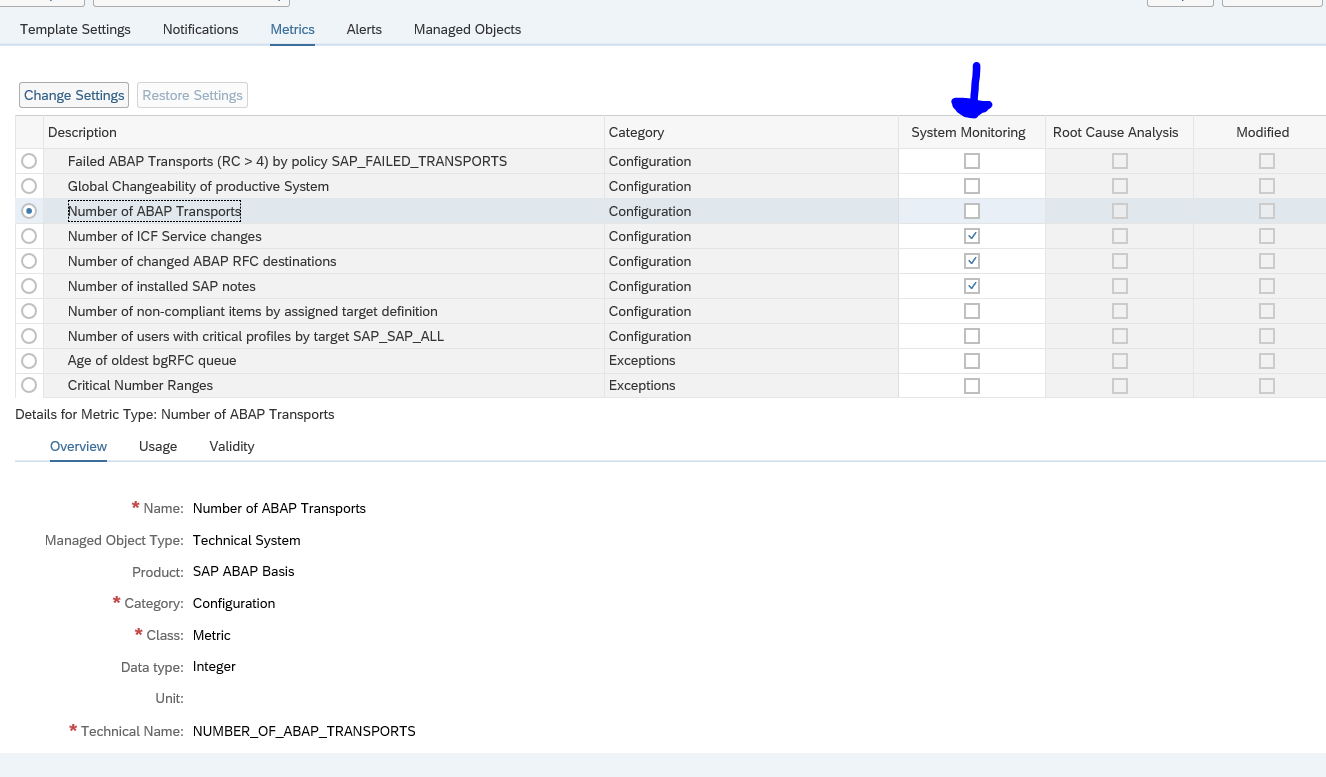
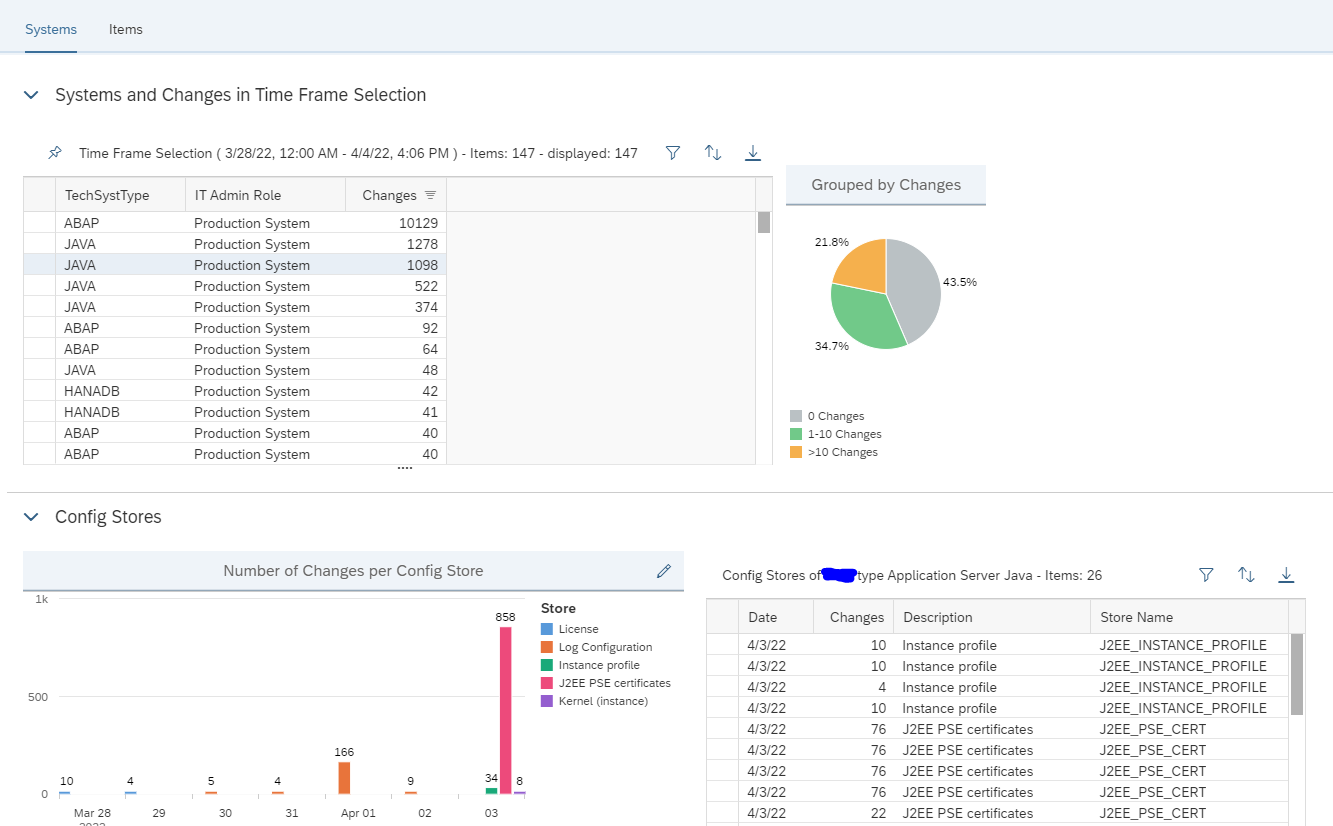
Determining configuration changes
Go to the Configuration and Security Analytics FIORI tile:
On the left side choose the tool to display configuration changes:
In the next screen you can see the changes per system:
In the details you can see what has been changed and when.
Search for specific configuration changes
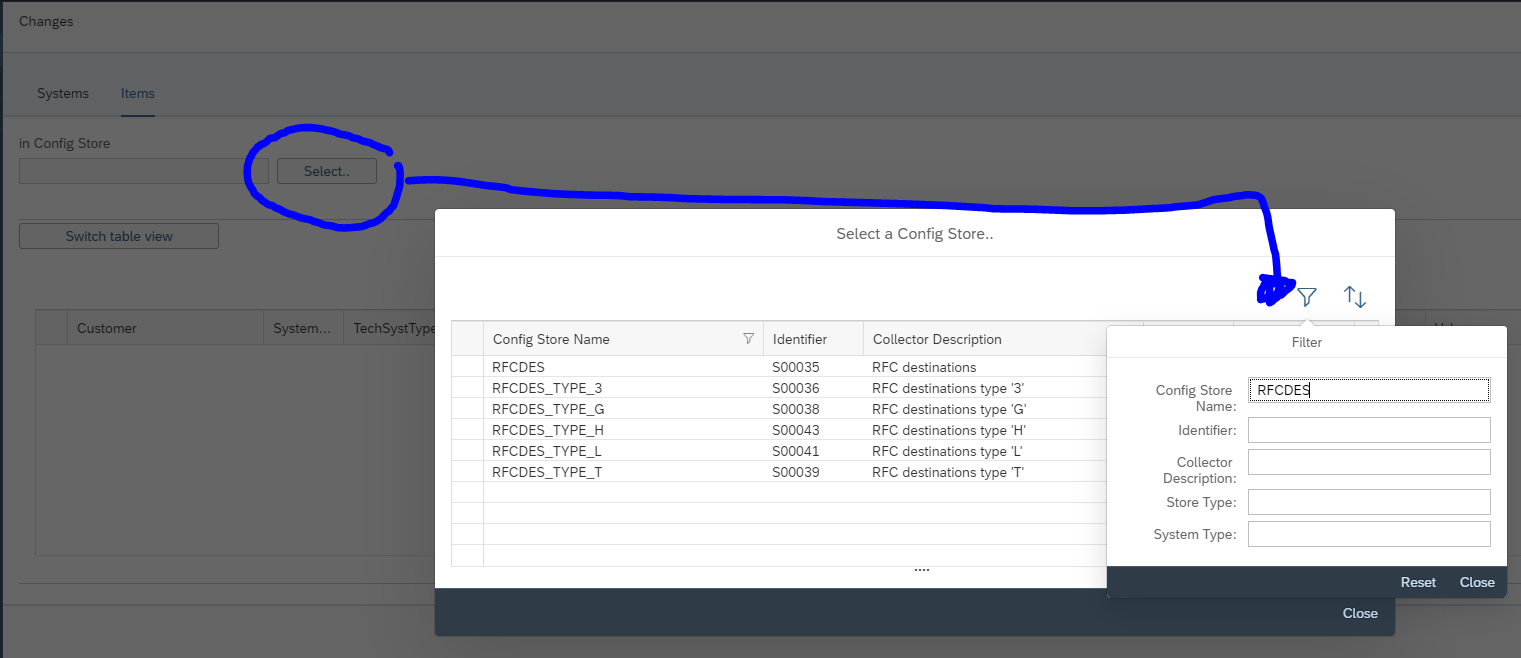
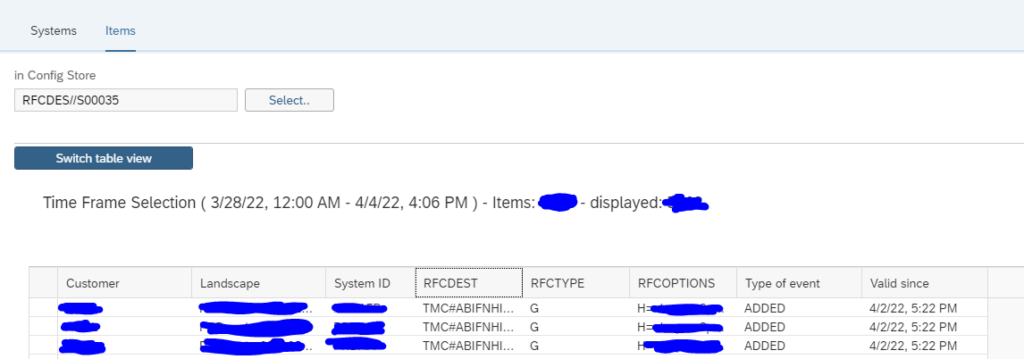
You can also search for specific configuration changes. Open the find tool and select the change store (in this example RFC destinations):
Now you get the detailed list of changes:
The easiest overview is the table view. This allows also for Excel download.
Remark: the time frame default 1 week. If you need search different period, change the time frame selection.
Monitoring based on configuration
The configuration and validation rules can also be used to trigger monitoring.
OSS note 3197989 – How to use Configuration and Security Analytics in System Monitoring Alerting – SAP Focused RUN contains a PDF document explaining in detail the steps to perform.
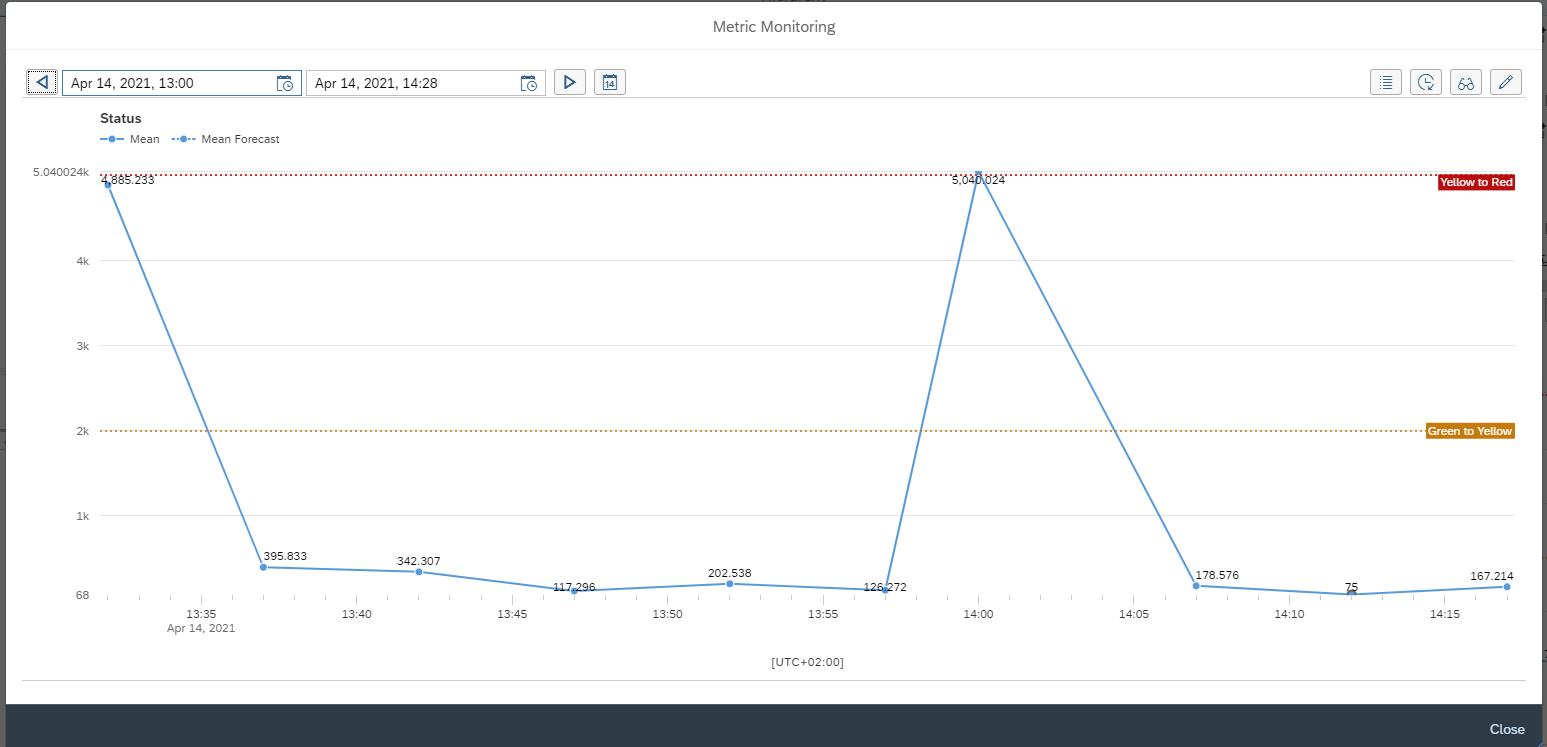
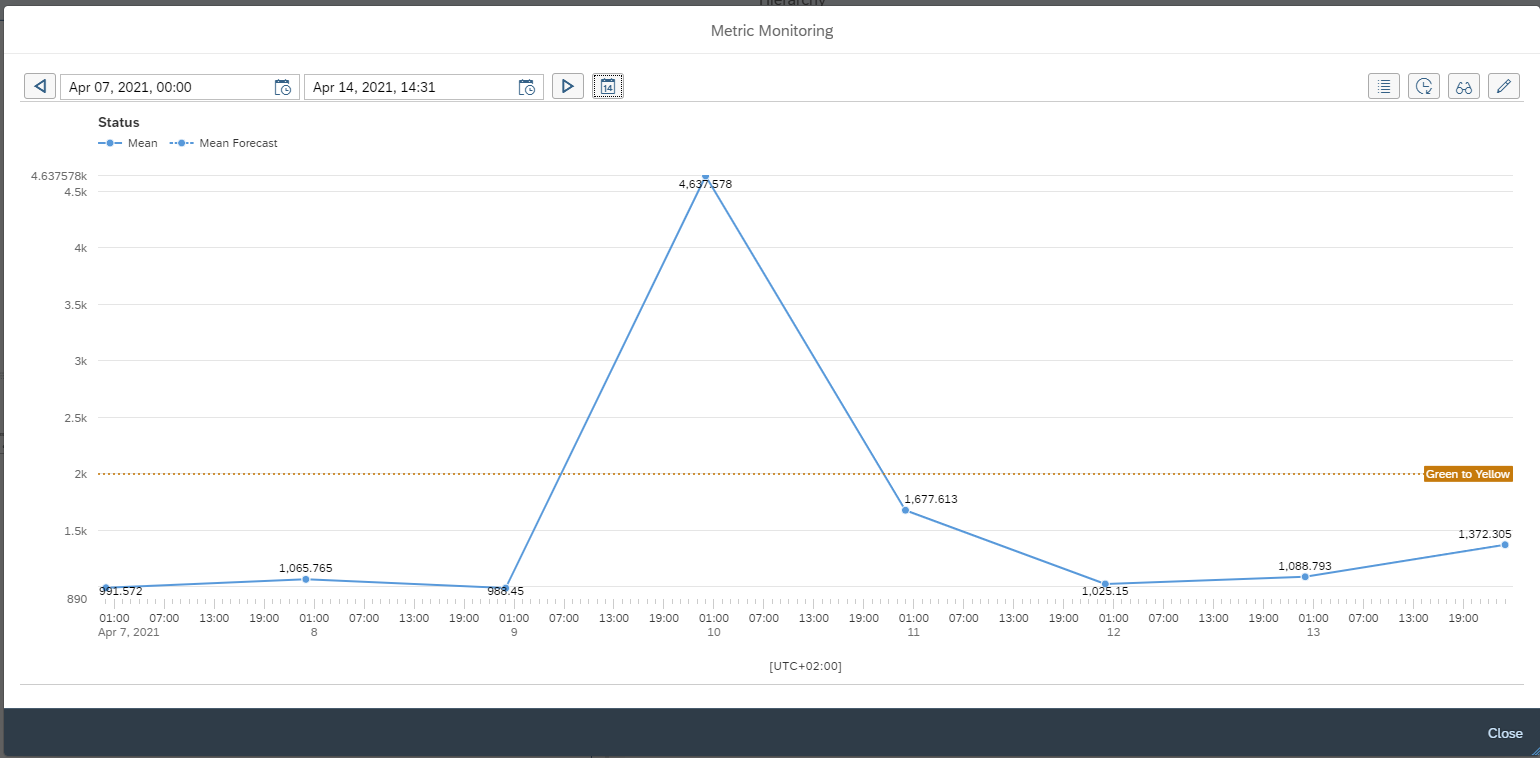
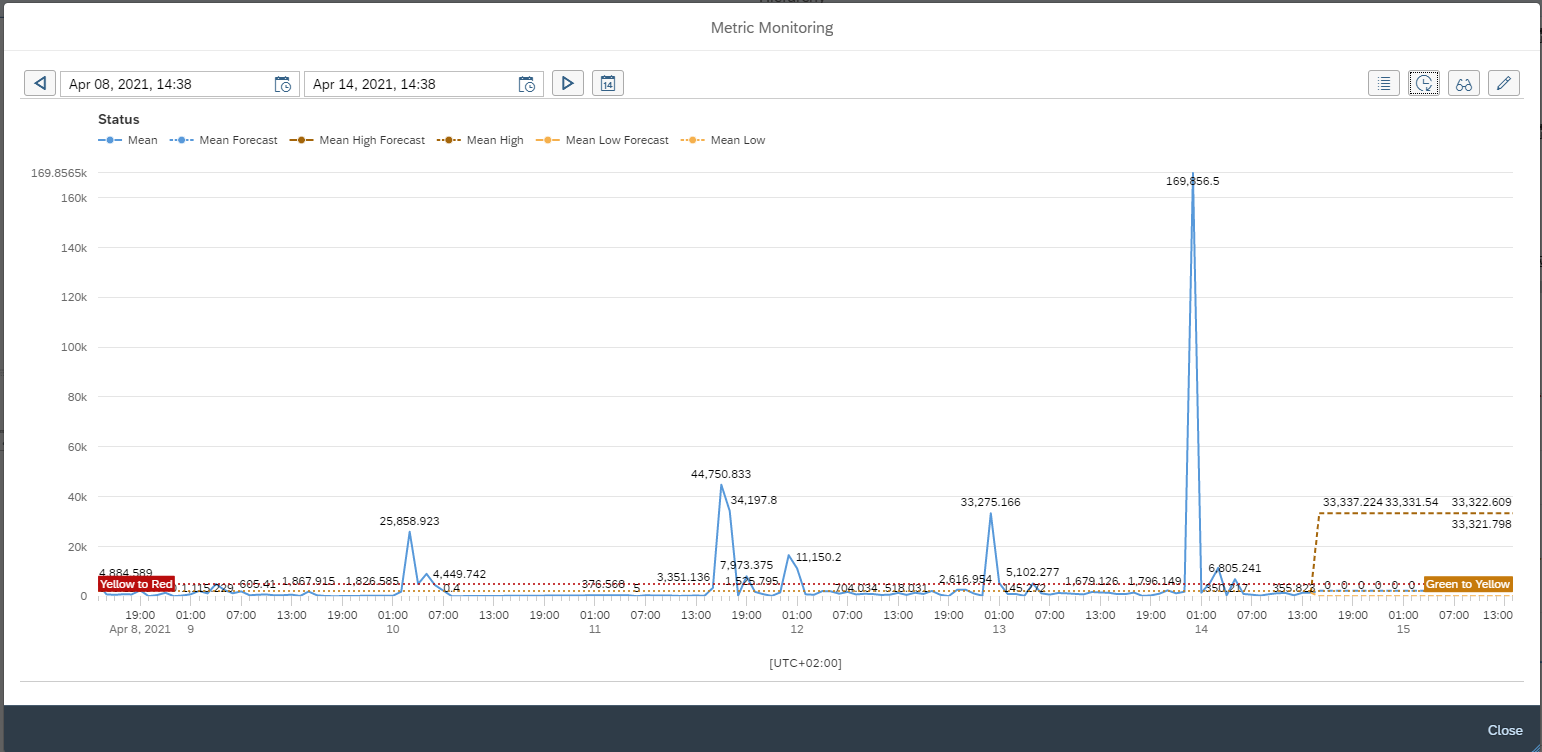
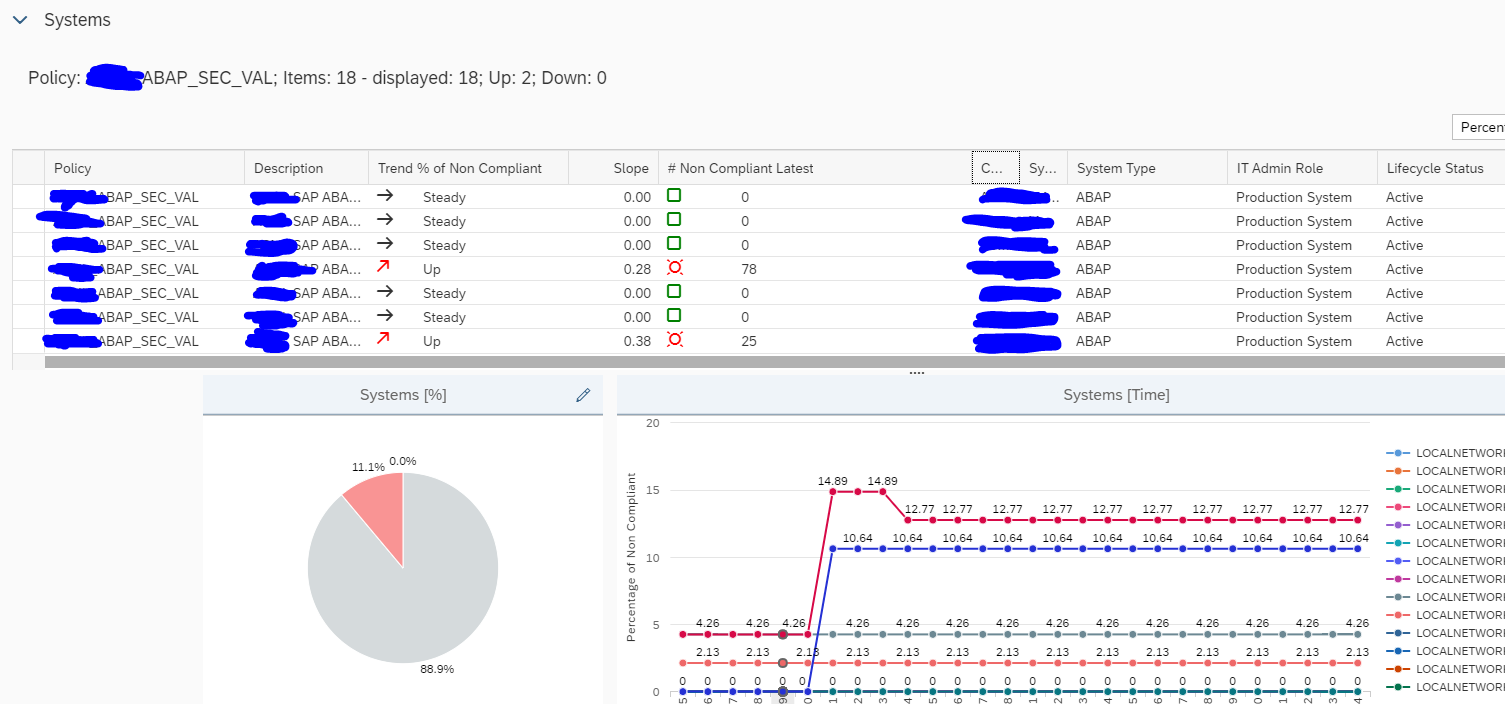
Trend analysis for configuration and security analytics
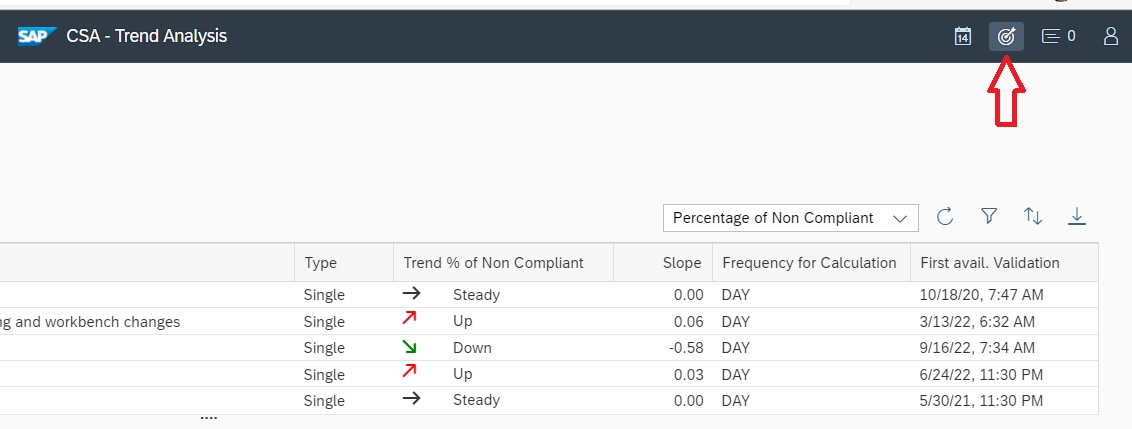
Since Focused Run 3.0 feature pack 2 a new FIORI tile is present: trend analysis for configuration and security analytics:
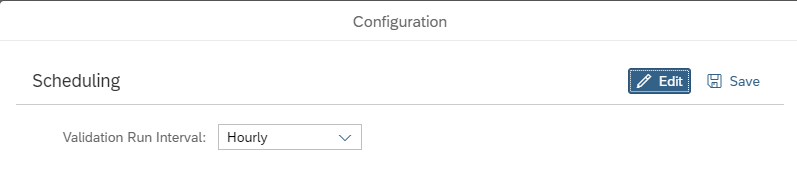
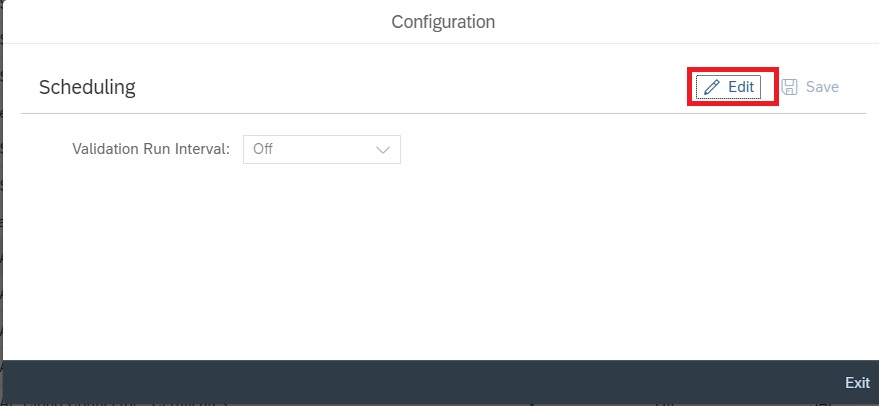
For the policy to work, you first need to schedule it in the policy management tile. Select the policy and press the Configure button:
On the popup screen press the Edit button:
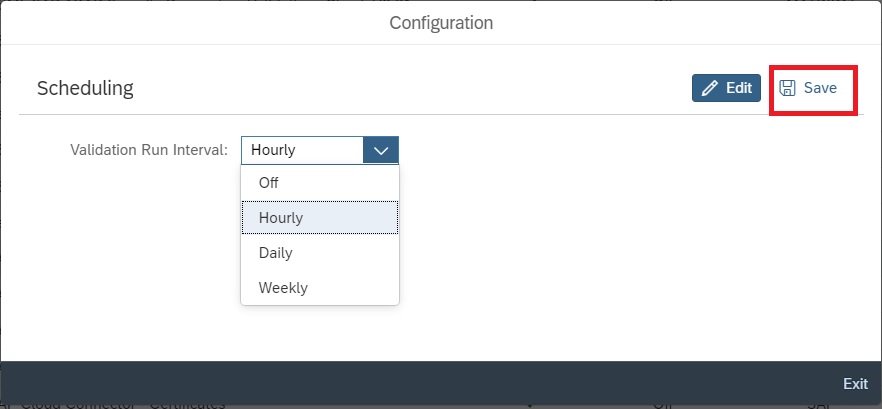
Set the scheduling frequency and save the data.
Use of the trend analysis
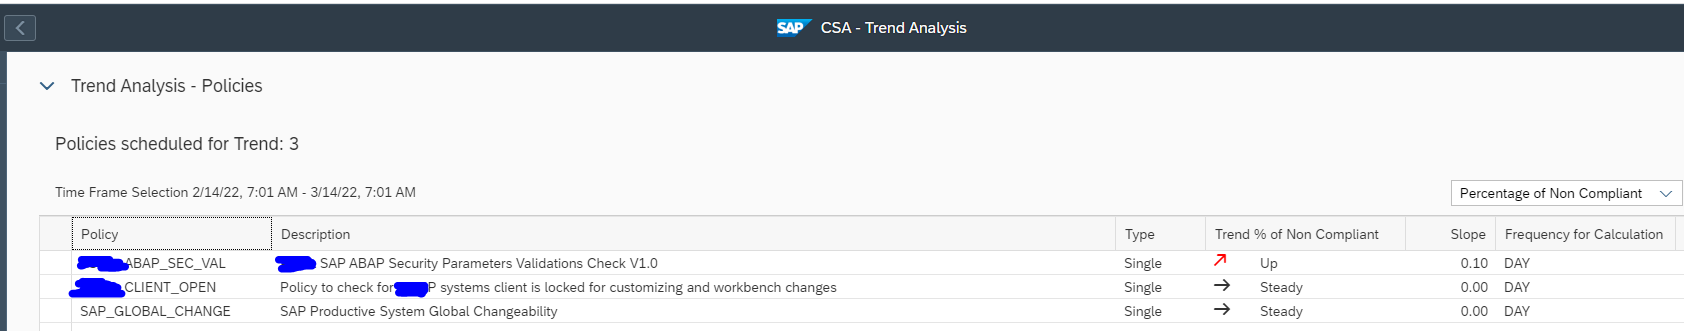
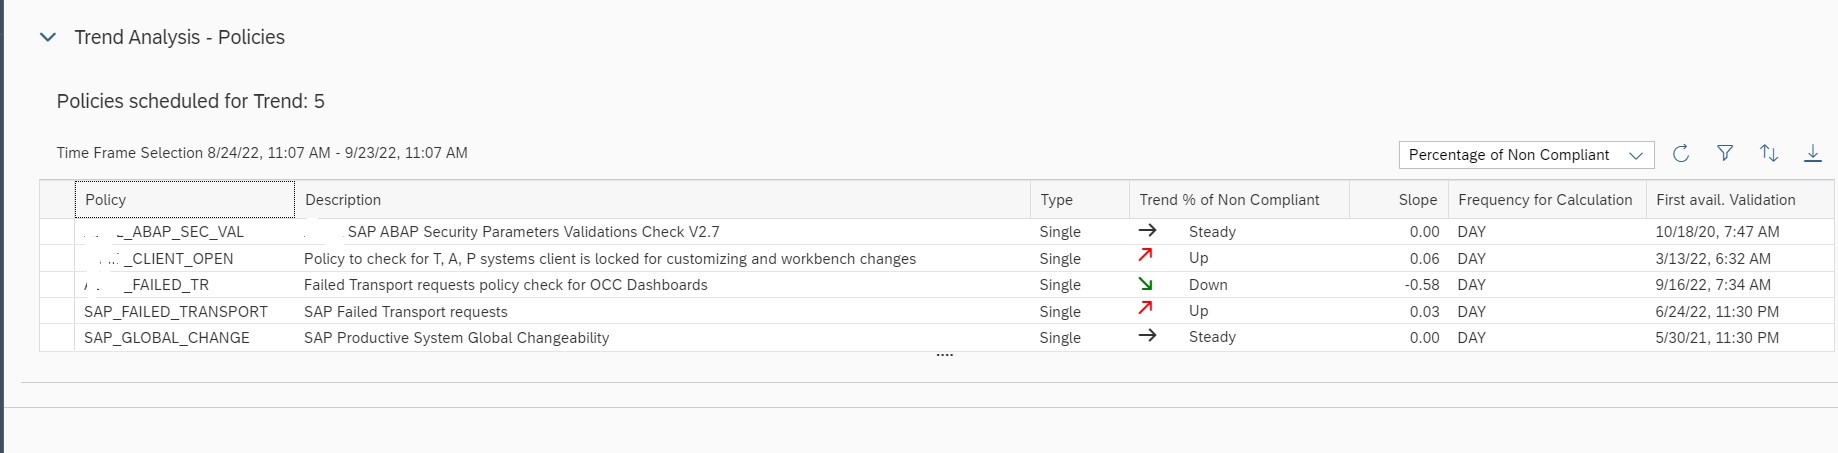
Opening the trend analysis tile starts with the overview screen:
You can change the timeframe of the analysis and scope with the normal icons top right.
Selecting a policy will open the trend graph below:
Below that graph are the details for the systems:
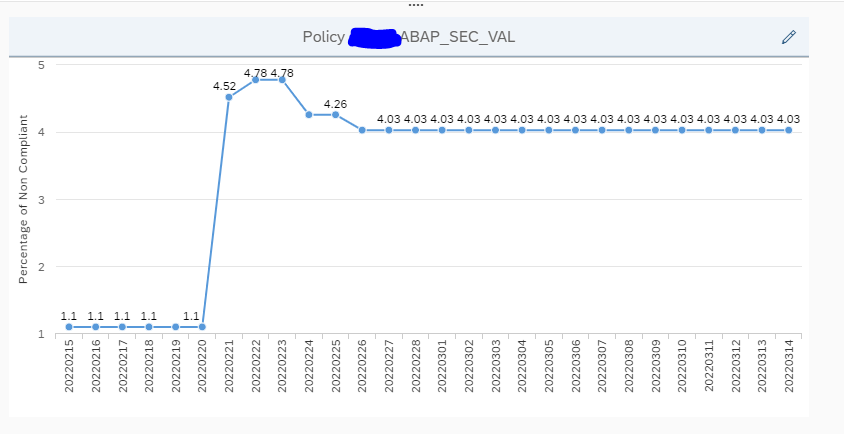
Organizational use of the trend analysis
The trend analysis can be used to quickly see for your important security policies how the situation is developing.
When strengthening the policies, you will see many non compliant systems initially. Often some sandboxes, or development systems are forgotten. The trend analytics will spot it, and you can act on it.
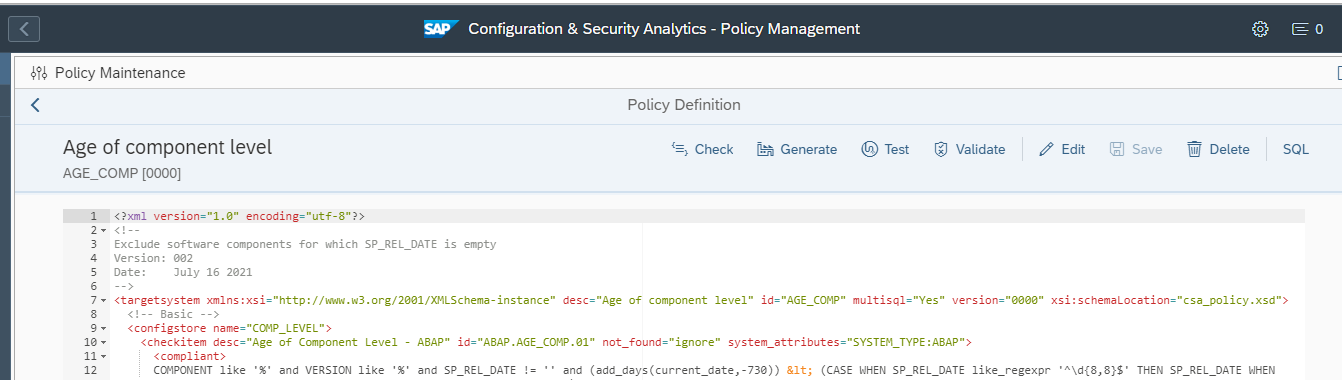
Age of system components
From the text below or from the github site of Focused Run you can download this policy:
COMPONENT like '%' and VERSION like '%' and SP_REL_DATE != '' and <?xml version="1.0" encoding="utf-8"?>
<!--
Exclude software components for which SP_REL_DATE is empty
Version: 002
Date: July 16 2021
-->
<targetsystem xmlns:xsi="http://www.w3.org/2001/XMLSchema-instance" desc="Age of component level" id="AGE_COMP" multisql="Yes" version="0000" xsi:schemaLocation="csa_policy.xsd">
<!-- Basic -->
<configstore name="COMP_LEVEL">
<checkitem desc="Age of Component Level - ABAP" id="ABAP.AGE_COMP.01" not_found="ignore" system_attributes="SYSTEM_TYPE:ABAP">
<compliant>
COMPONENT like '%' and VERSION like '%' and SP_REL_DATE != '' and (add_days(current_date,-730)) < (CASE WHEN SP_REL_DATE like_regexpr '^\d{8,8}$' THEN SP_REL_DATE WHEN SP_REL_DATE = 'NEWER' THEN CURRENT_DATE ELSE '00000000' END)
</compliant>
<noncompliant>
COMPONENT like '%' and VERSION like '%' and SP_REL_DATE != '' and not (add_days(current_date,-730)) < (CASE WHEN SP_REL_DATE like_regexpr '^\d{8,8}$' THEN SP_REL_DATE WHEN SP_REL_DATE = 'NEWER' THEN CURRENT_DATE ELSE '00000000' END)
</noncompliant>
</checkitem>
<checkitem desc="Age of Component Level - JAVA" id="JAVA.AGE_COMP.01" not_found="ignore" system_attributes="SYSTEM_TYPE:JAVA">
<compliant>
COMPONENT like '%' and VERSION like '%' and SP_REL_DATE != ''and (add_days(current_date,-730)) < (CASE WHEN SP_REL_DATE like_regexpr '^\d{8,8}$' THEN SP_REL_DATE WHEN SP_REL_DATE = 'NEWER' THEN CURRENT_DATE ELSE '00000000' END)
</compliant>
<noncompliant>
COMPONENT like '%' and VERSION like '%' and SP_REL_DATE != '' and not (add_days(current_date,-730)) < (CASE WHEN SP_REL_DATE like_regexpr '^\d{8,8}$' THEN SP_REL_DATE WHEN SP_REL_DATE = 'NEWER' THEN CURRENT_DATE ELSE '00000000' END)
</noncompliant>
</checkitem>
</configstore>
</targetsystem>Use this to set up a new policy called AGE_COMP:
By default the rule is taking 730 days. You can adjust the value as per your needs.
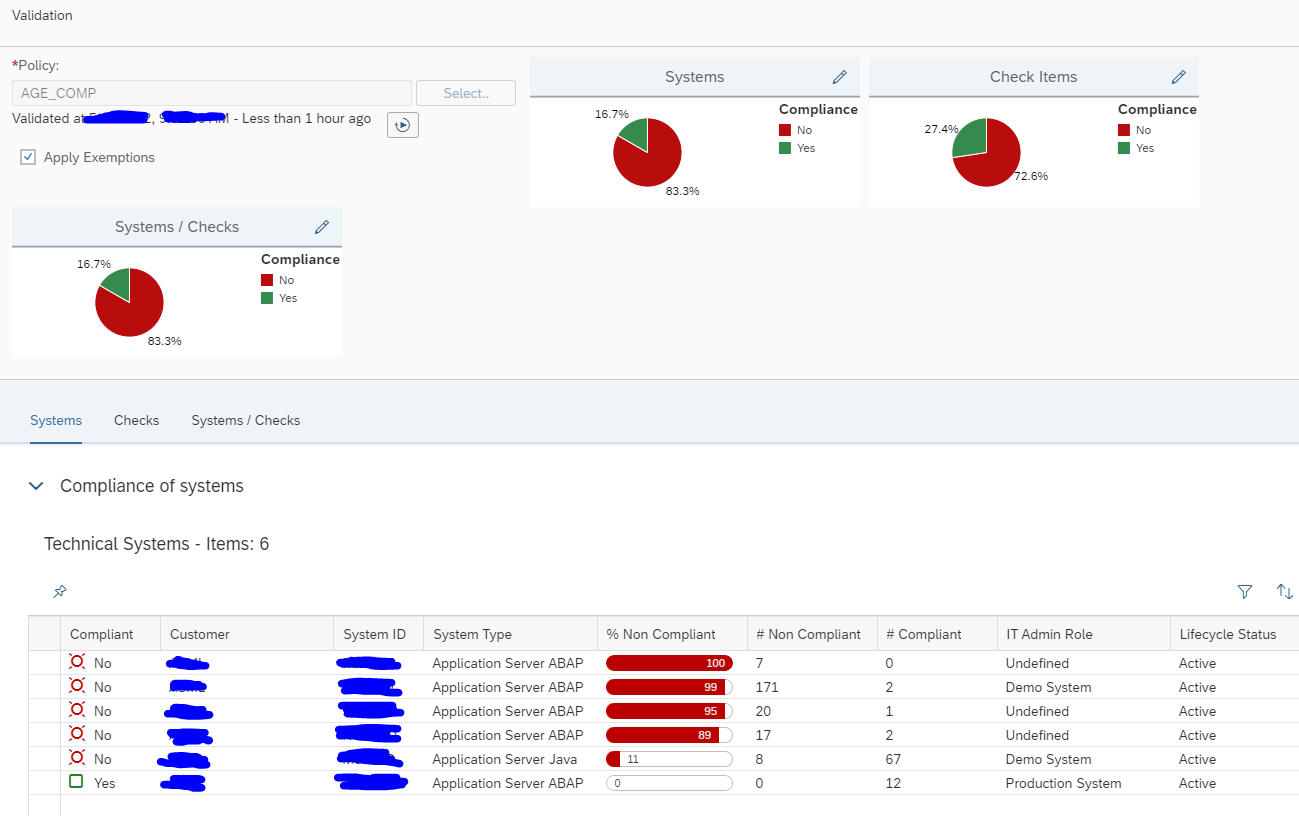
Now you can run the query to get an easy overview across the systems:
Don’t be afraid if you have high number in the beginning; most of the cases this is due to HR components being outdated.
Use configuration analytics to determine Cryptolib versions across your landscape
SAP Cryptolib is use for diverse security scenarios. In many cases it is simply installed and never updated. We will explain how to use the configuration validation tool to quickly list all Cryptolib versions across your landscape.
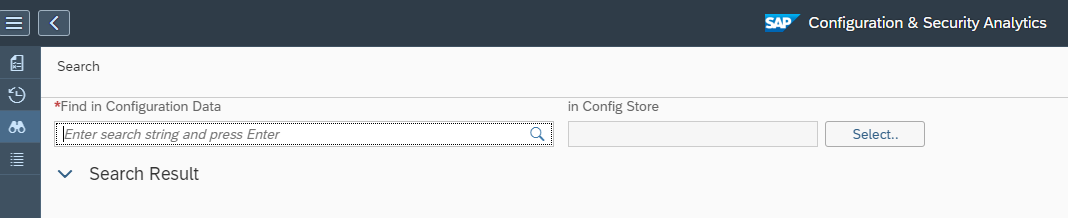
Open the configuration and security validation FIORI tile:
Top left choose the searching for configuration items icon:
The search screen opens:
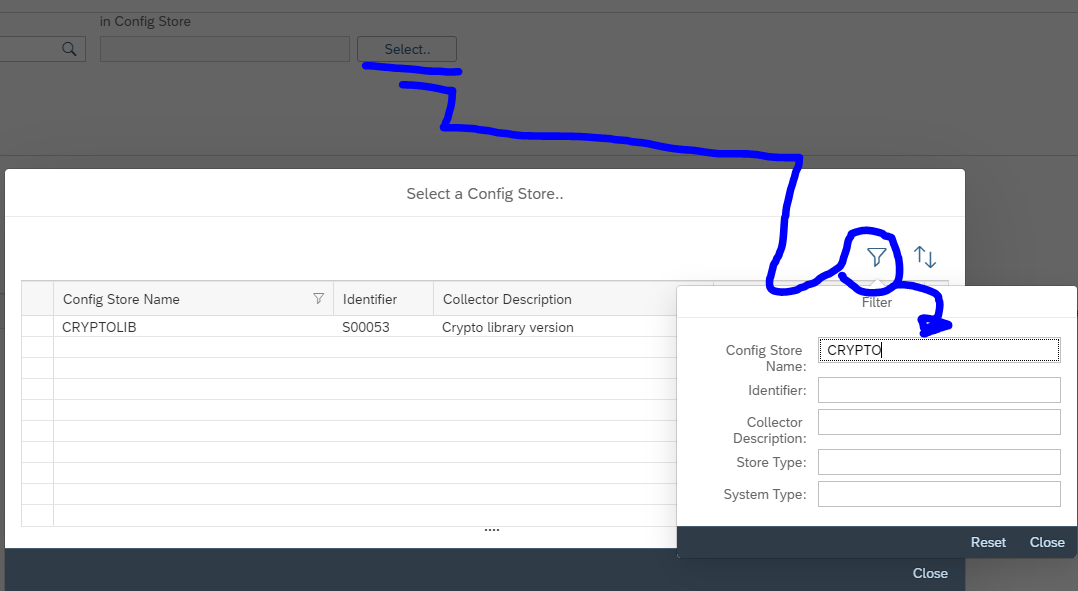
Now select the CRYPTOLIB store:
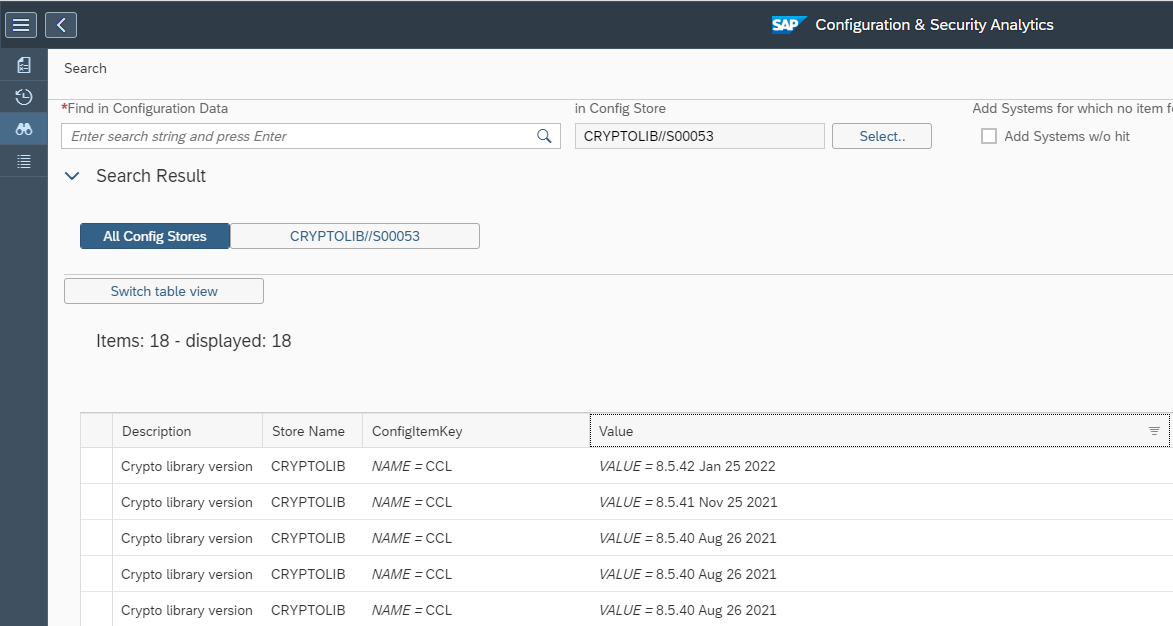
Now press the find button in the Find in configuration data field:
Results show:
Remark: the result is depending on your scope selected. Use the scope selection button to change the scope.
This method can be used for many different use-case as well!
Configuration validation to check for disablement of webadmin page
OSS note 2258786 – Potential information disclosure relating to SAP Web Administration Interface is describing the issue that the web administration interface is publicly available if you didn’t configure your system correctly. More background can be found in this blog. This item is misconfigured on a lot of systems. It is present in ABAP, JAVA and web dispatcher.
If you start to fix this item, you want to keep track of the progress, and also in the future you want to check if the setting is done correctly for new systems and after updates, upgrades, etc.
Setting up the configuration validation rule
Create a new policy with the following syntax for ABAP:
<configstore name="ABAP_INSTANCE_PAHI">
<checkitem desc="icm/HTTP/admin_0" id="ICM_HTTP_ADMIN">
  <compliant>NAME = 'icm/HTTP/admin_0' and VALUE  like '%ALLOWPUB=FALSE%' </compliant>
  <complianttext/>
  <noncompliant>NAME = 'icm/HTTP/admin_0' and not ( VALUE like '%ALLOWPUB=FALSE%' ) </noncompliant>
  <noncomplianttext/>
</checkitem>
</configstore>
For JAVA and webdispatcher:
<configstore name="DEFAULT.PFL">
<checkitem desc="icm/HTTP/admin_0" id="ICM_HTTP_ADMIN">
      <compliant>TEXT like '%admin_0%' and TEXT  like '%ALLOWPUB=FALSE%' </compliant>
      <complianttext/>
      <noncompliant>TEXT like '%admin_0%' and not ( TEXT like '%ALLOWPUB=FALSE%' ) </noncompliant>
      <noncomplianttext/>
</checkitem>
</configstore>
The rule says: if the subparameter ALLOWPUB is defined with value FALSE it is ok. In all other cases it is not ok.
Now you can run the rule and check if your systems are compliant:
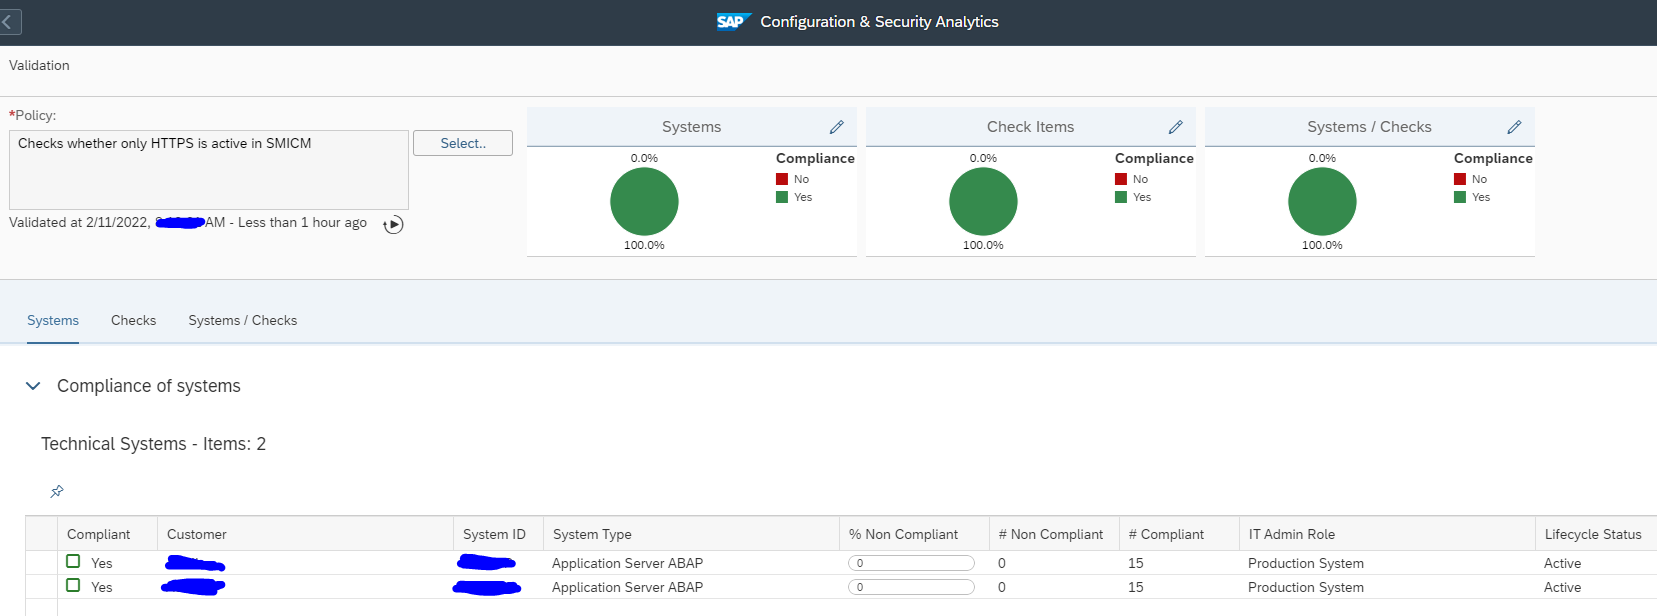
Setting up security and configuration validation rule to check if HTTP port is active
Security & configuration validation can be used to check if on any ABAP stack the HTTP port is activated. Depending on your security concept this might be forbidden (only HTTPs is allowed). Checking across all systems is a cumbersome job. Here the security and configuration check function of SAP Focused Run can help.
Create a new policy with the following syntax:
<?xml version="1.0" encoding="utf-8"?>
<targetsystem xmlns:xsi="http://www.w3.org/2001/XMLSchema-instance" desc="Checks whether only HTTPS is active in SMICM" id="SMICM_HTTPSONLY" multisql="Yes" version="0000" xsi:schemaLocation="csa_policy.xsd">
  <configstore name="ABAP_INSTANCE_PAHI">
    <checkitem desc="item description" id="1.0.0.0">
      <compliant>NAME like 'icm/server_port_%' and NOT (VALUE like '%HTTP,%' ) </compliant>
      <complianttext/>
      <noncompliant>NAME like 'icm/server_port_%' and VALUE like '%HTTP,%'   </noncompliant>
      <noncomplianttext/>
    </checkitem>
  </configstore>
</targetsystem>
Basically the rule says: no http found is ok and any http found is not ok.
Run the check will give you all systems in red where HTTP is active and green if only HTTPs is active, or nothing is active:
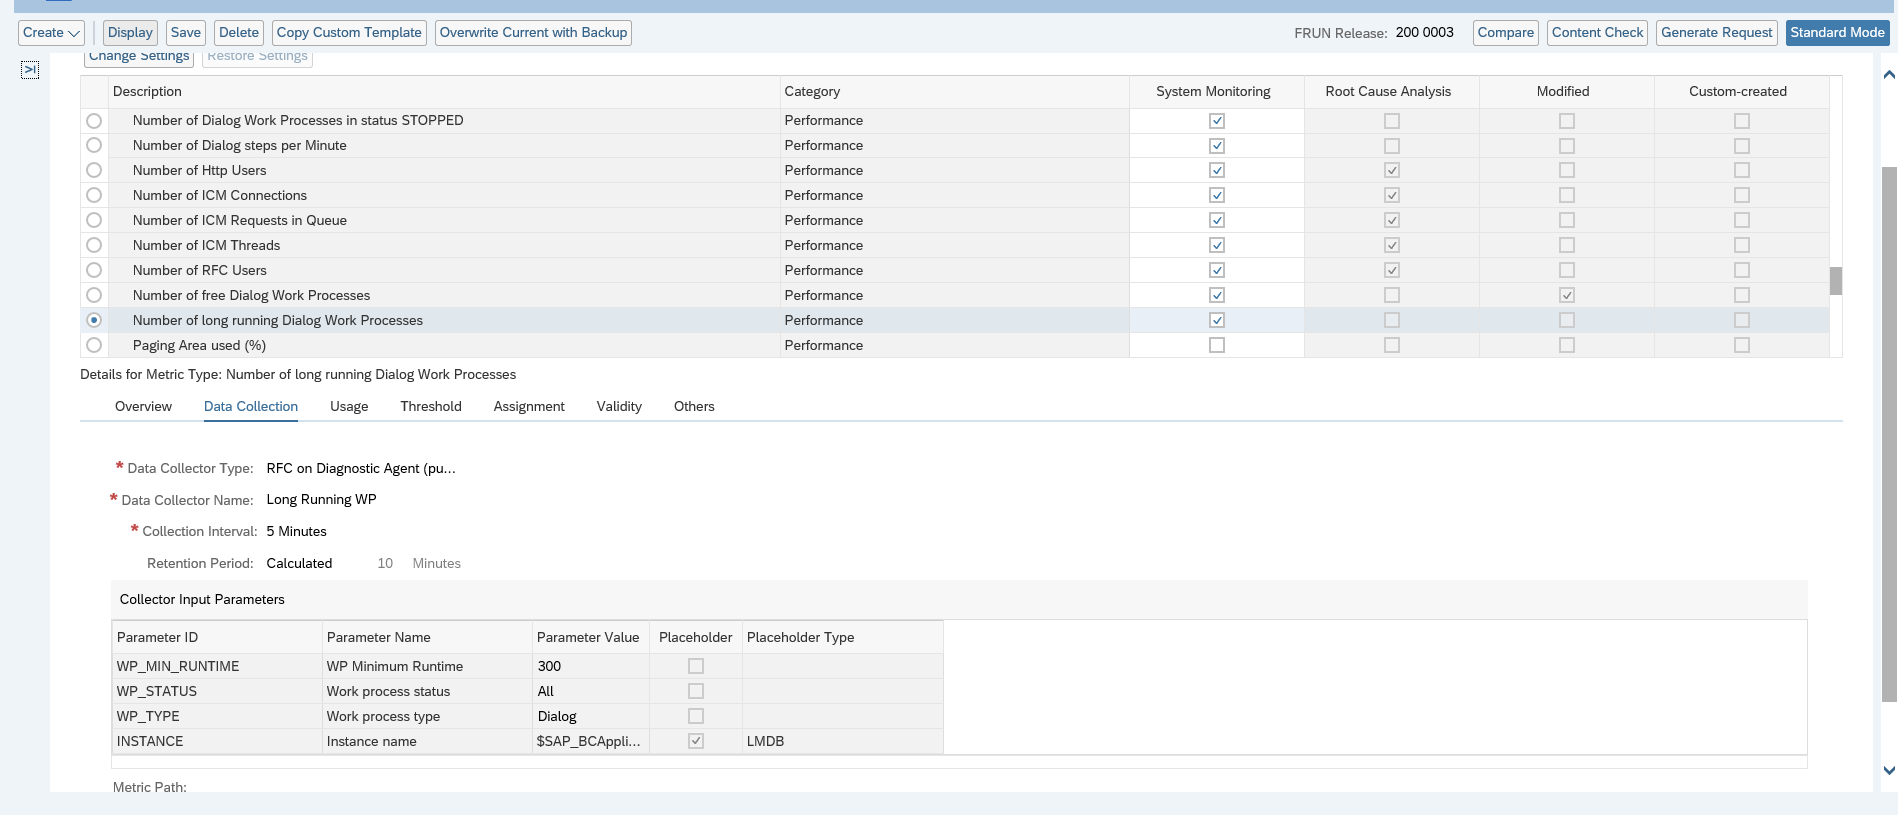
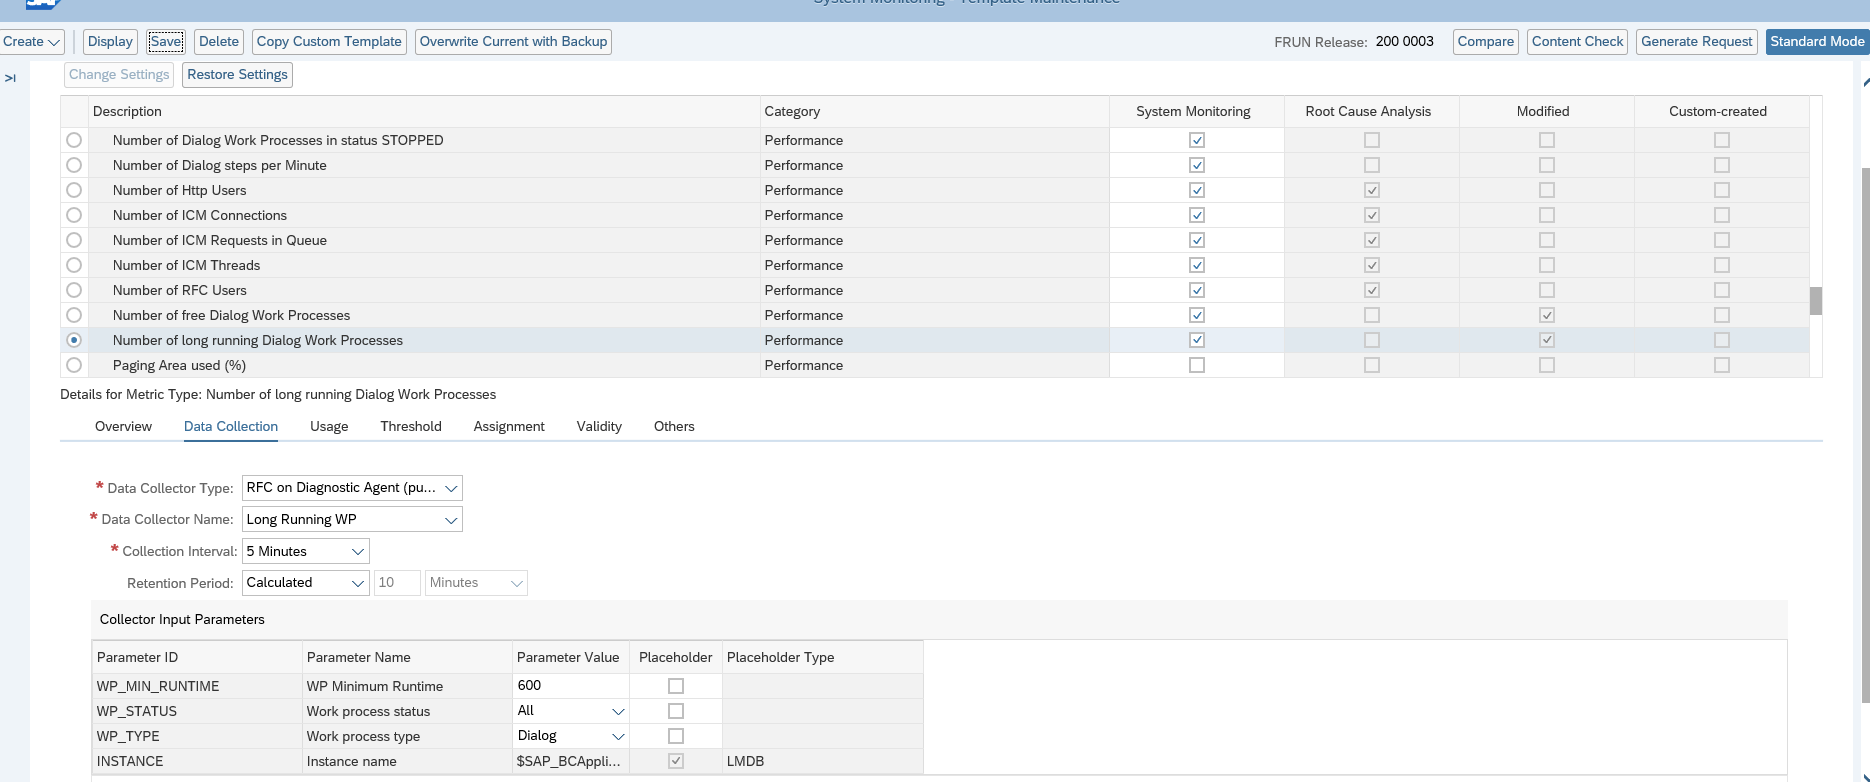
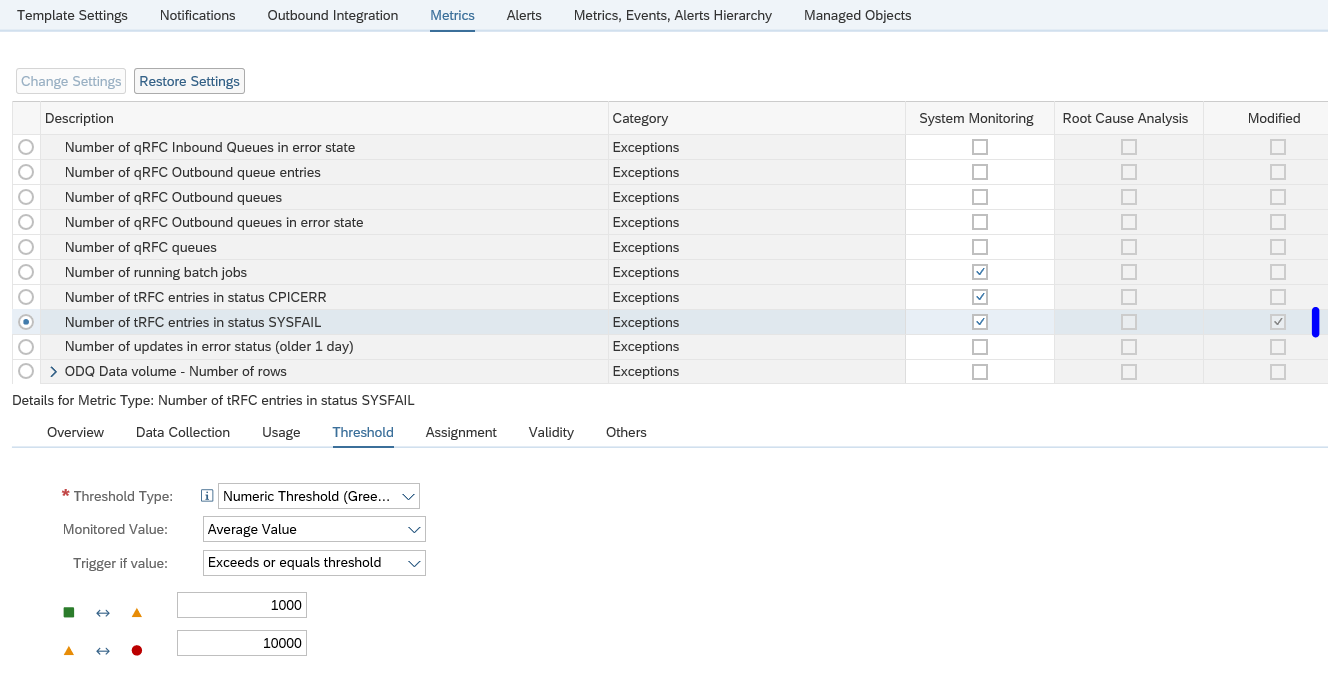
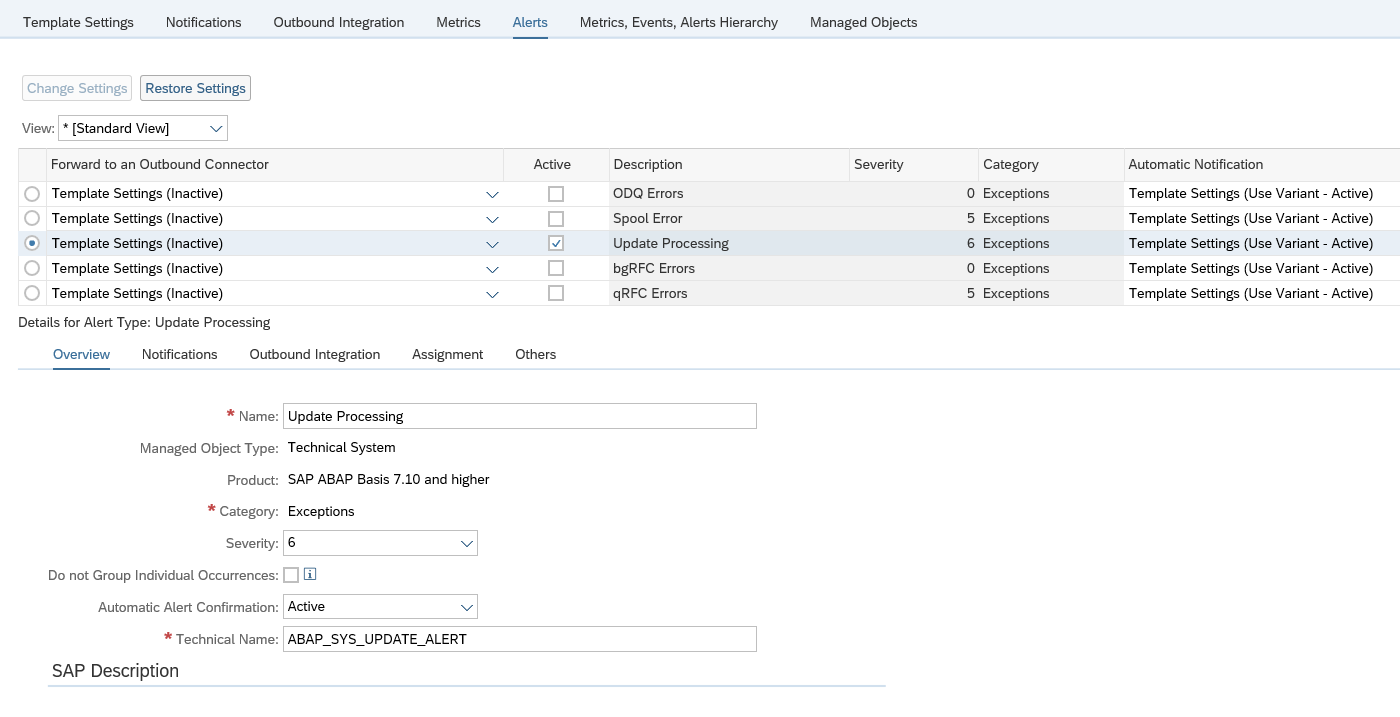
Monitoring changes in RFCs in ABAP systems
With SAP Focused Run 3.0 FP 2, its now possible to monitor changes in RFCs in SAP ABAP Systems.
In SAP Focused Run 3.0 FP 2, you can activate alerting and notification for any changes to the content of a CCDB config store. Using this functionality we can activate alerting and notification on the CCDB store that contains information about RFCs.
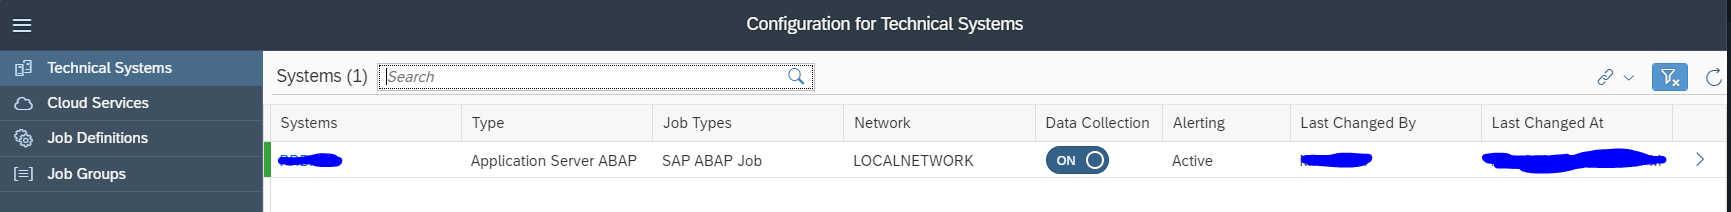
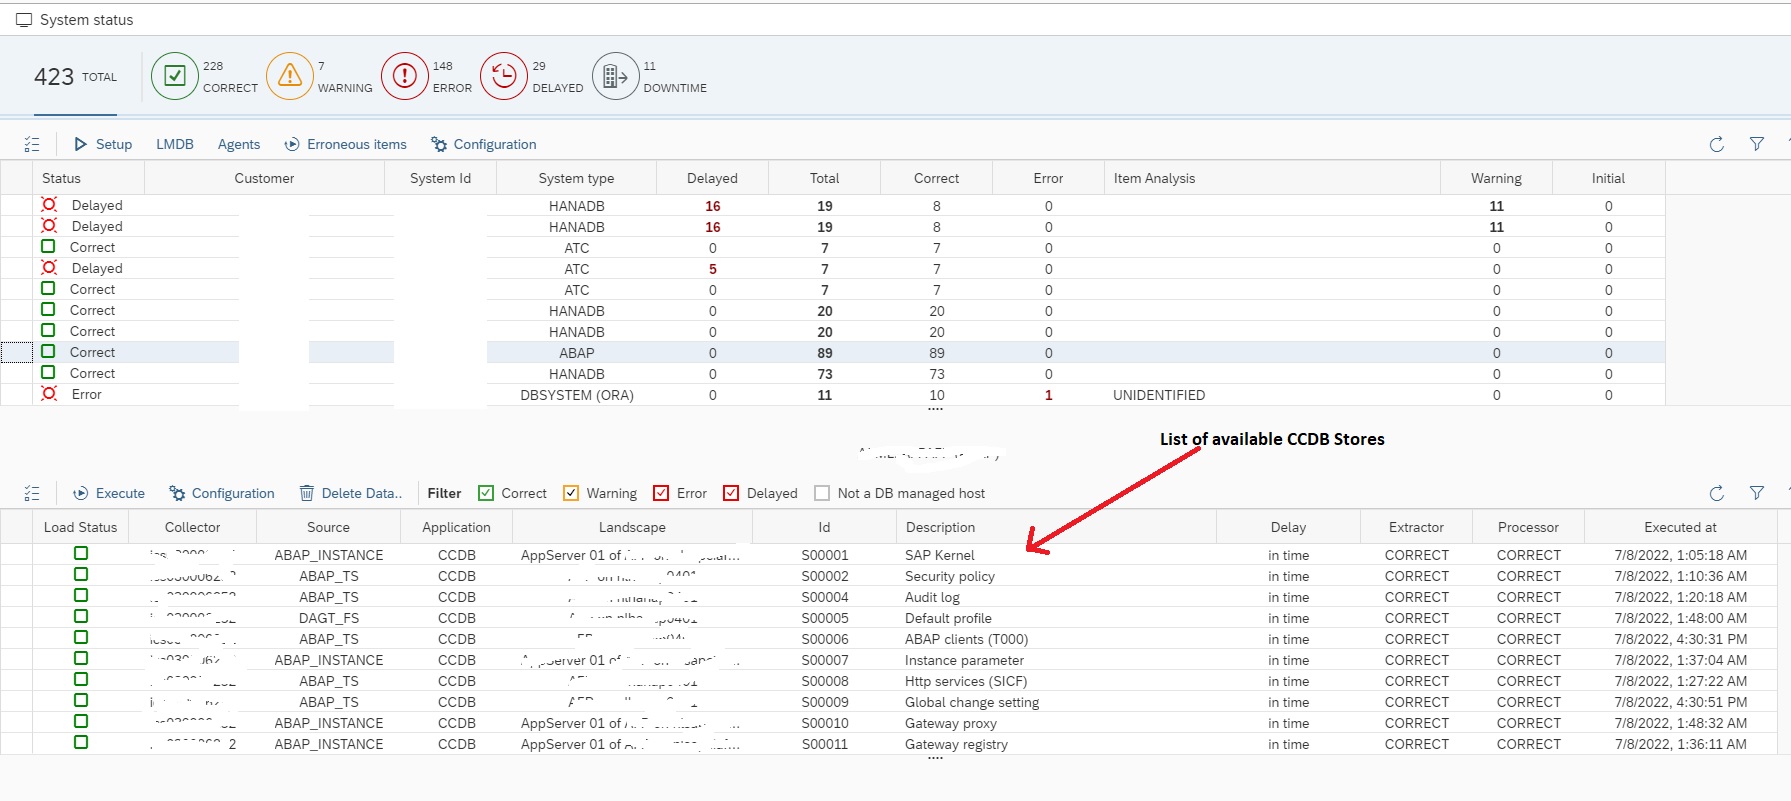
First we need to identify which CCDB store keeps the information on RFCs. For this you need to click on Configuration & Security Analytics – Administration app in the Advanced Configuration Monitoring section of SAP Focused Run Launchpad.
In the app select any of the SAP ABAP systems. Upon selecting a system you will see the list of available CCDB stores for the system.
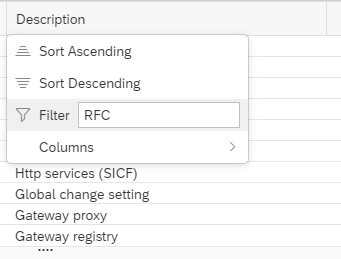
Now you can filter on Description for text “RFC” to see RFC related CCDB stores.
You will see the following CCDB Stores. To monitor changes to RFCs either you can use the generic CCDB store to monitor on all type of RFCs or you can use the specific RFC type CCDB store. In this example we will use the RFC destinations type ‘3’ CCDB store.
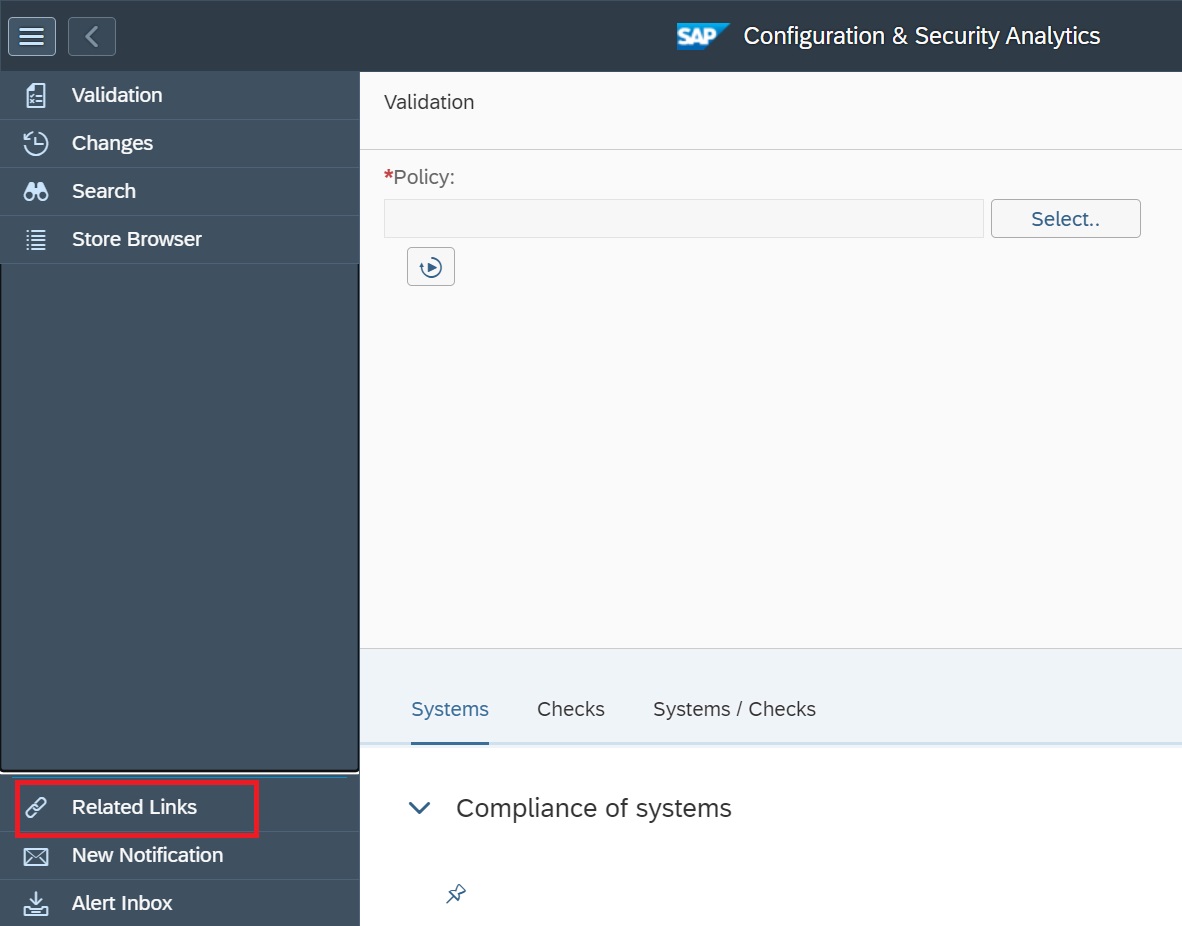
Next you need to go to the main Configuration and Security Analytics app.
In the app, in the navigation area click on Related Links.
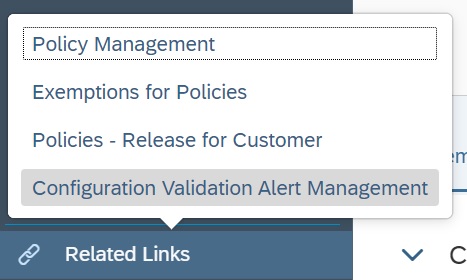
Select Configuration Validation Alert Management.
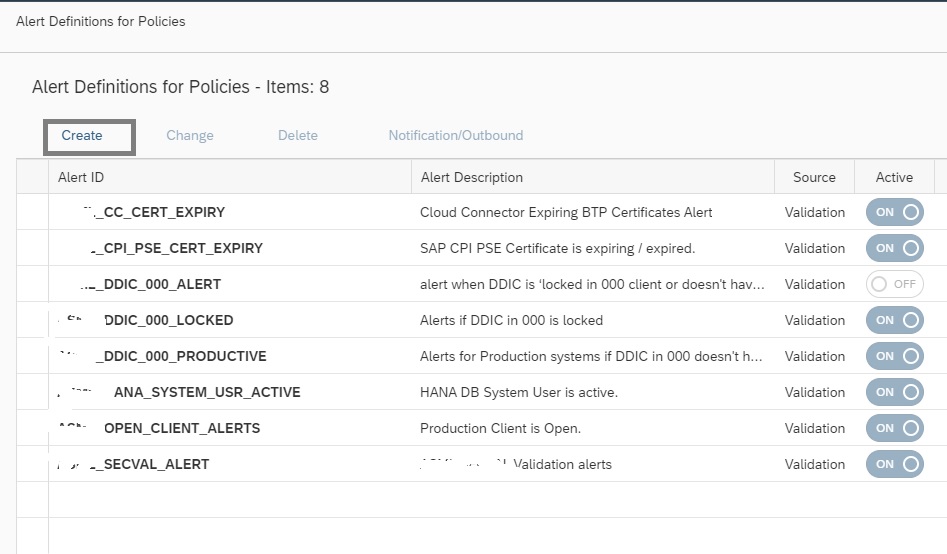
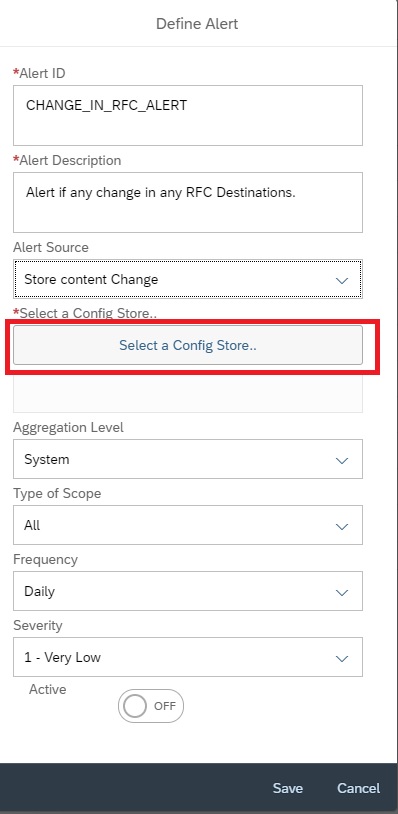
In the alert management app, click on create button.
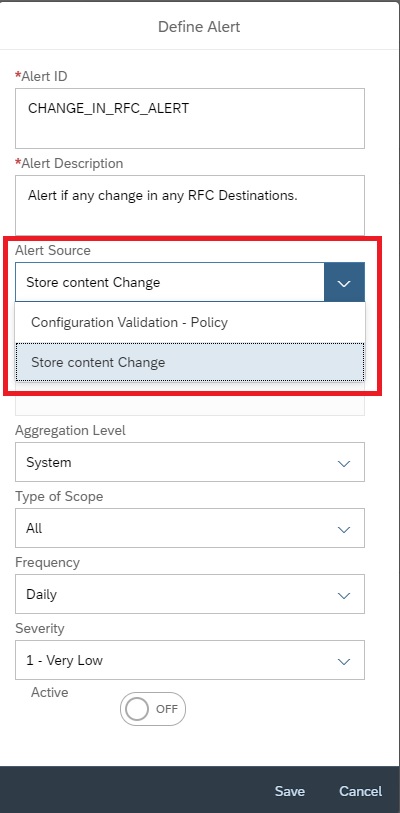
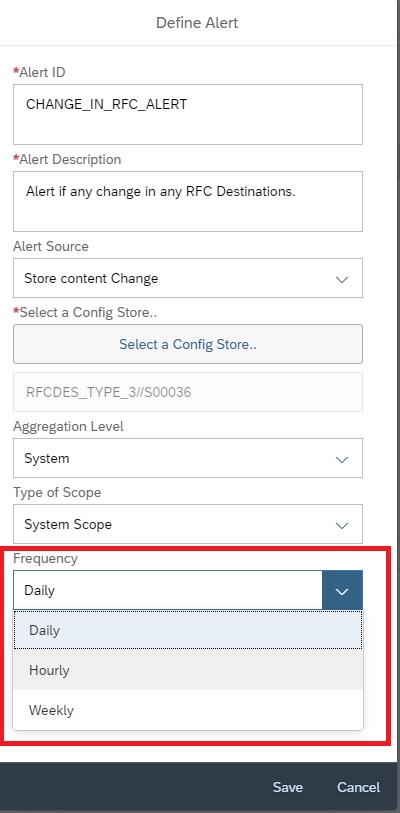
Enter Alert ID, Description and then select the Alert Source as Store content change.
Click on Select a Config Store
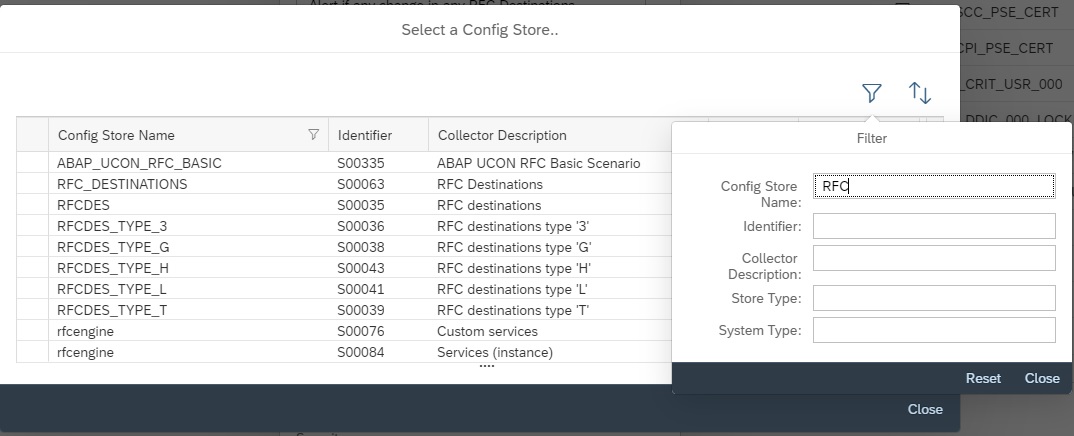
In the next pop-up to select the store, filter on description “RFC”.
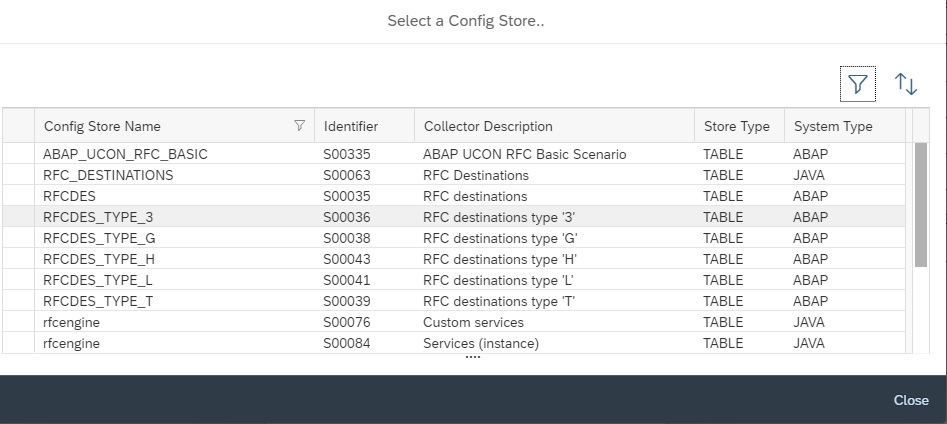
Then from the list select the specific RFC CDDB store you want to report on and then click on close.
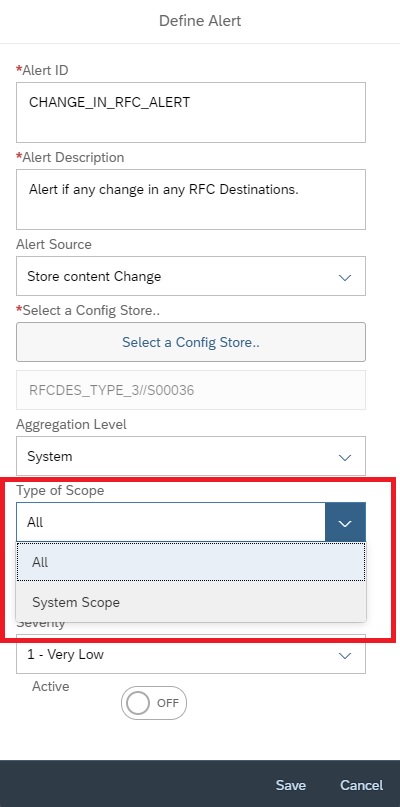
Then back in Alert creation screen, you can select the scope as ALL or for specific system. In this example we selected a specific managed system.
You can set the frequency between Hourly, Daily or Weekly.
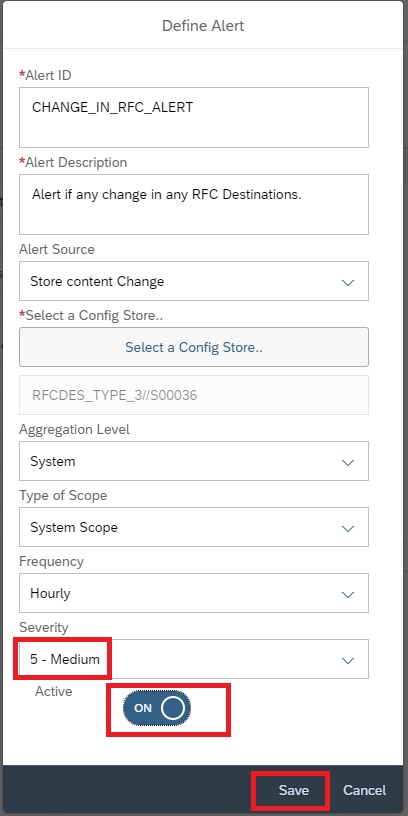
Then, set the Severity and click on Active button and then save.
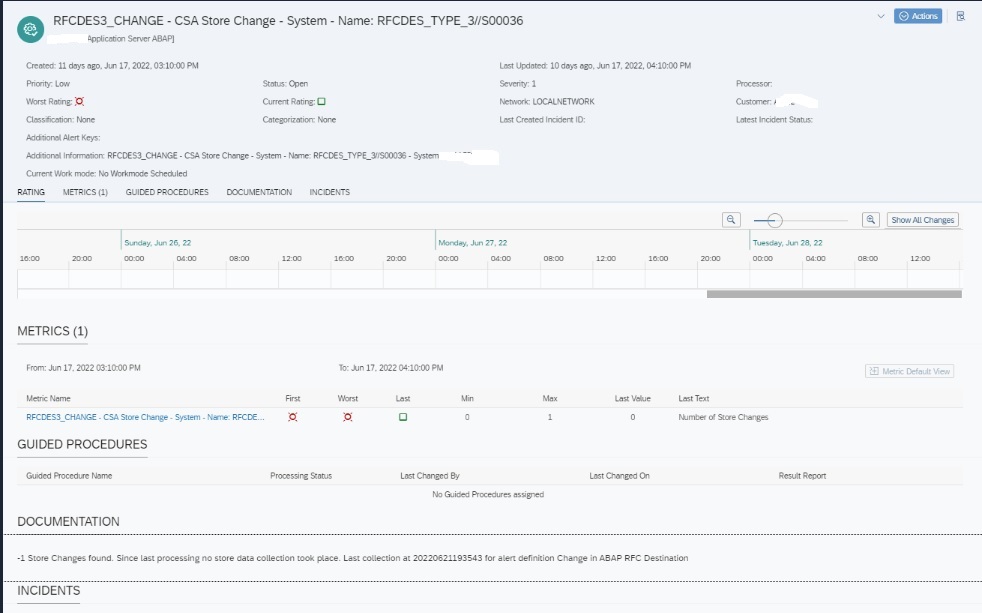
Upon activation it will start monitoring is there are any change is performed to the specific RFC store. Changes include Creation/Deletion/Update.
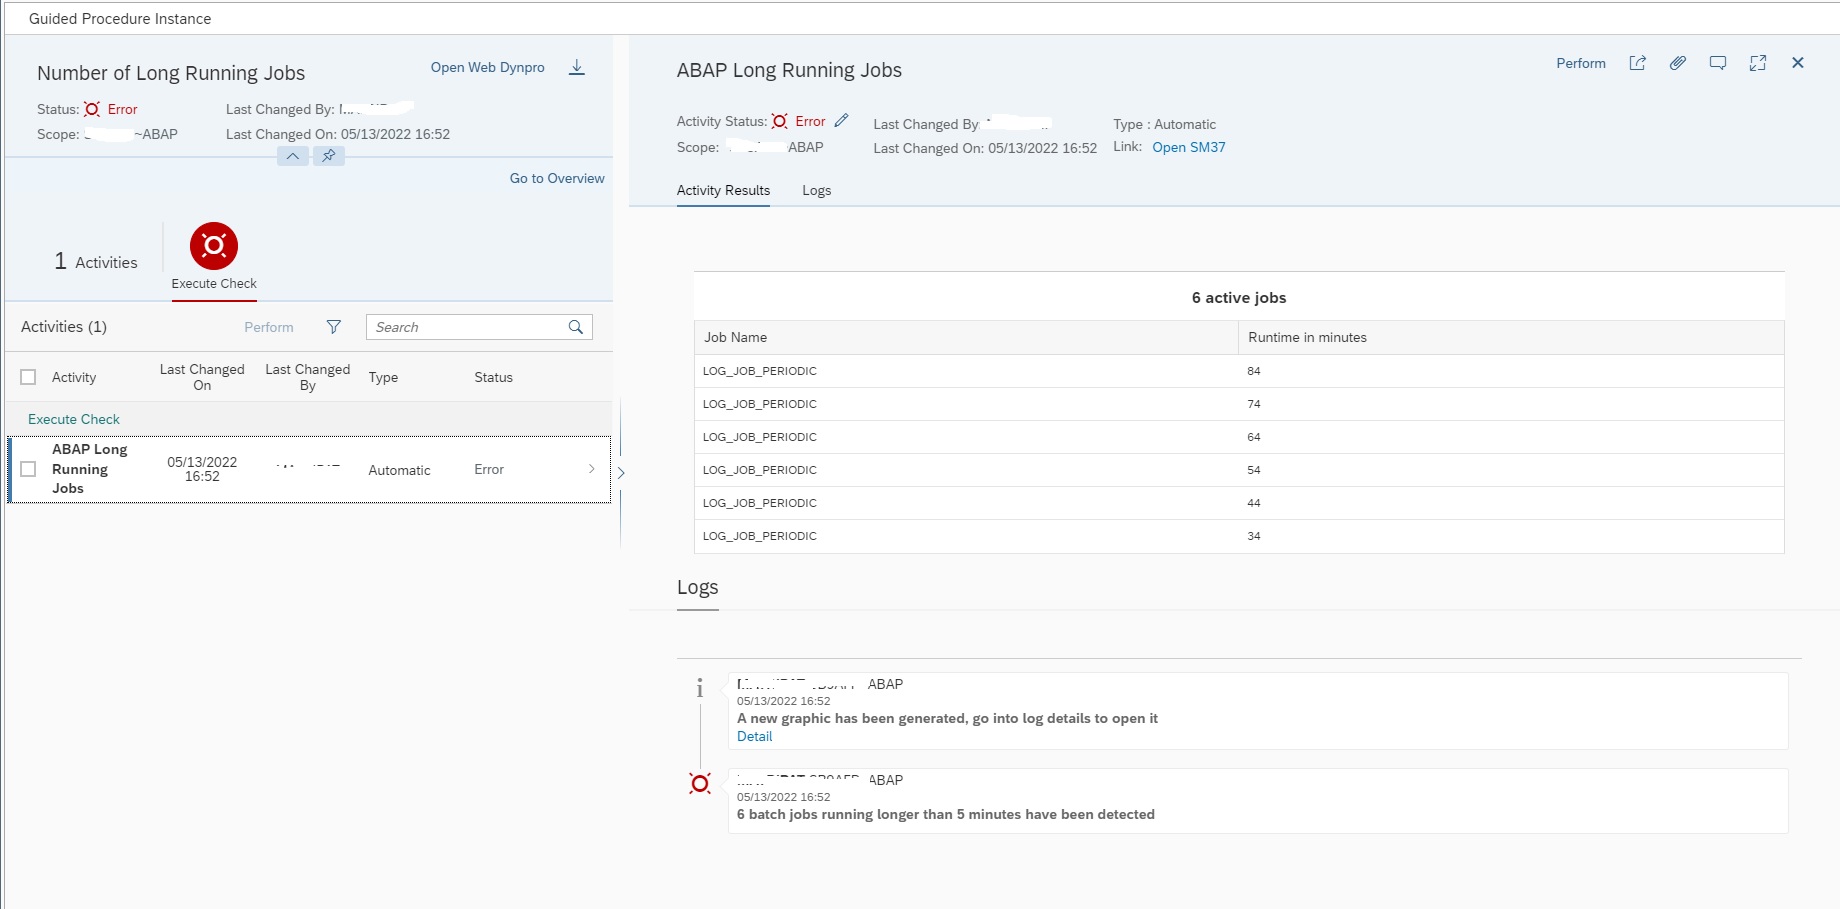
Upon any change detected an alert will be generated of the below format. This alert will be visible in the Alert Inbox.
Automatic email for Security Validation of SAP Systems
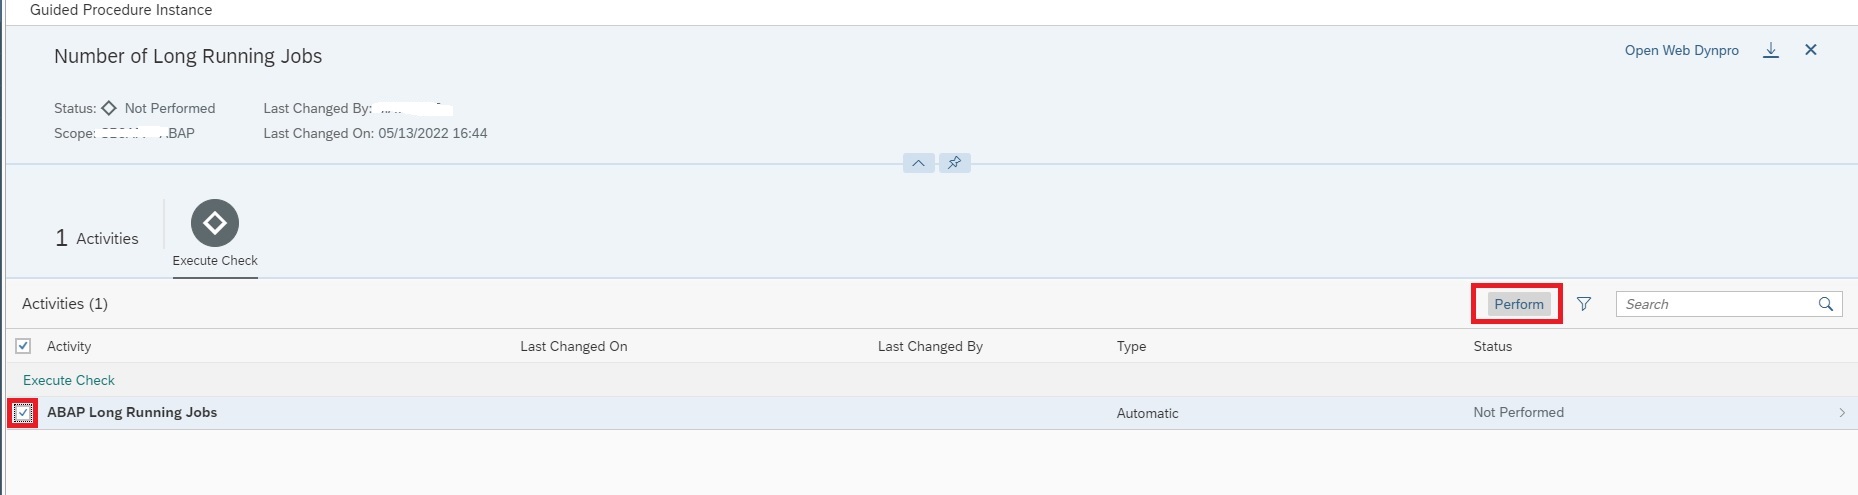
You can also setup Automatic eMail for Security Validation of SAP Systems. For this you need a guided procedure that can run a security validation policy instead of running the system health check.
Follow the following steps to create the guided procedure that can automatically execute the policy check on your SAP systems.
Creating Guided Procedure for Configuration and Security Analytics
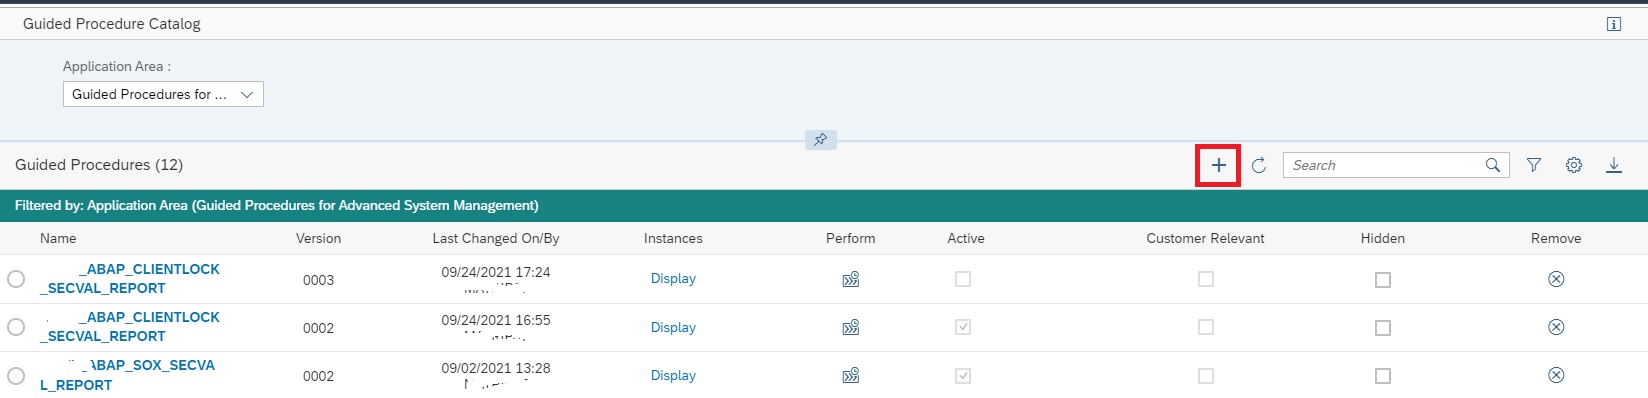
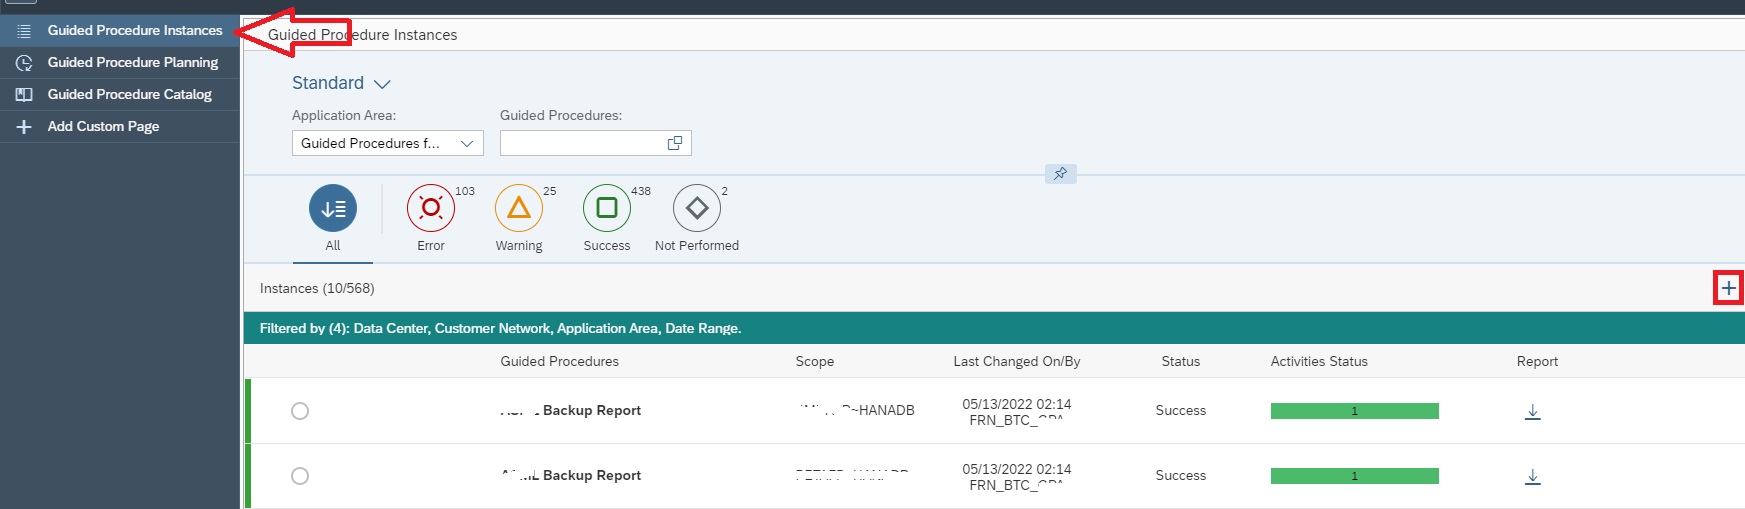
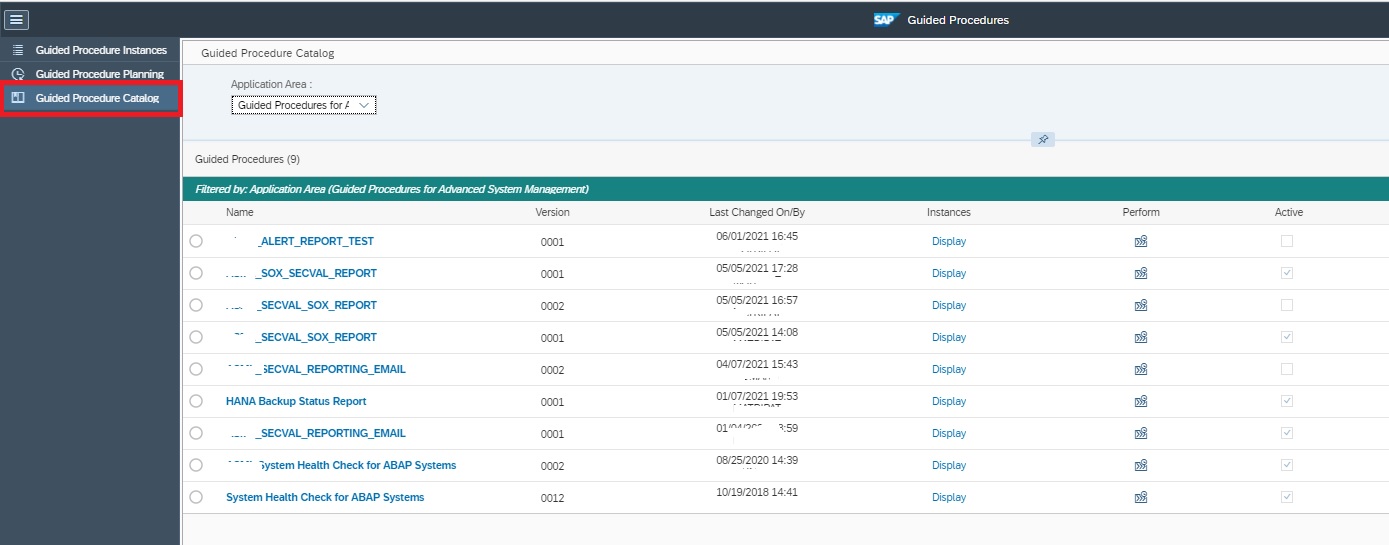
For creating the guided procedure navigate to the Guided Procedures app in the Focused Run launch pad.
In the Guided Procedures app navigate to the Catalog page and click on the + sign to create a new Guided Procedure.
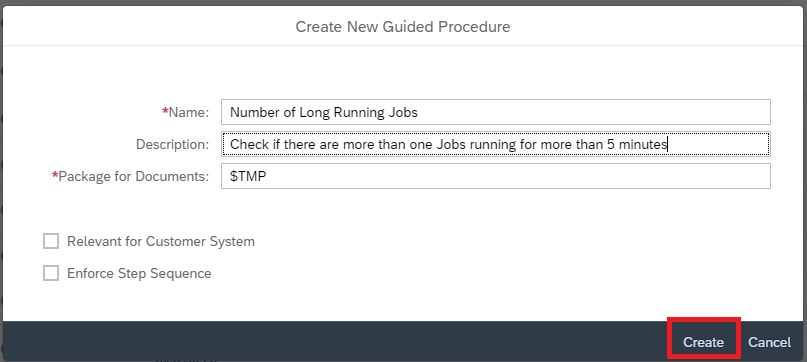
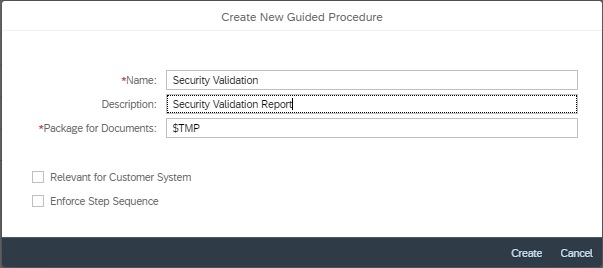
In the pop-up provide a name and description for the guided procedure and click on Create.
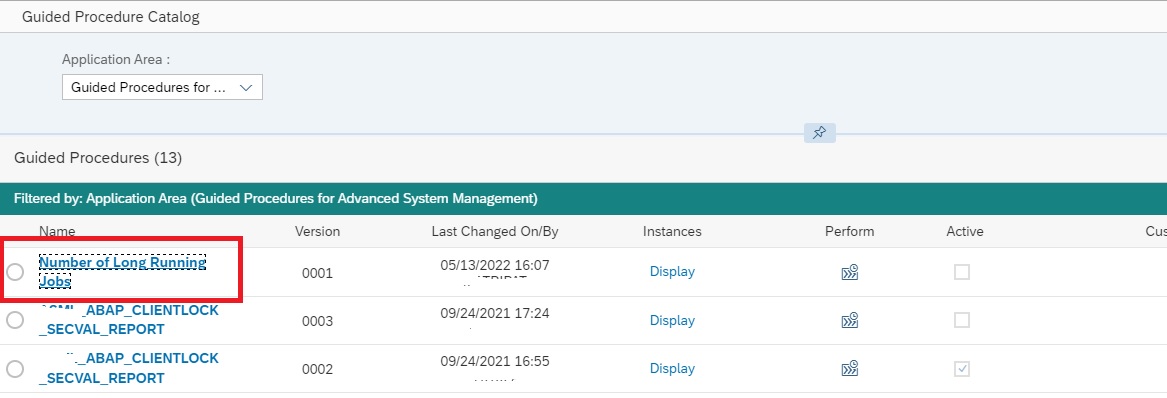
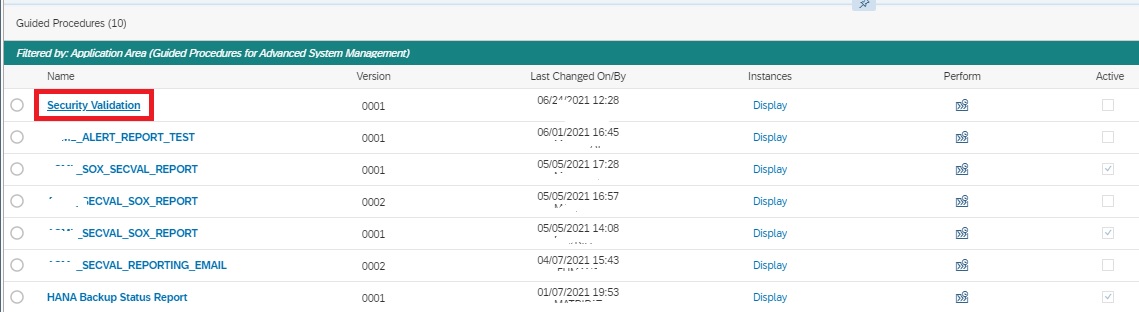
Back in the catalog page, click on the newly created guided procedure name to open it in edit mode.
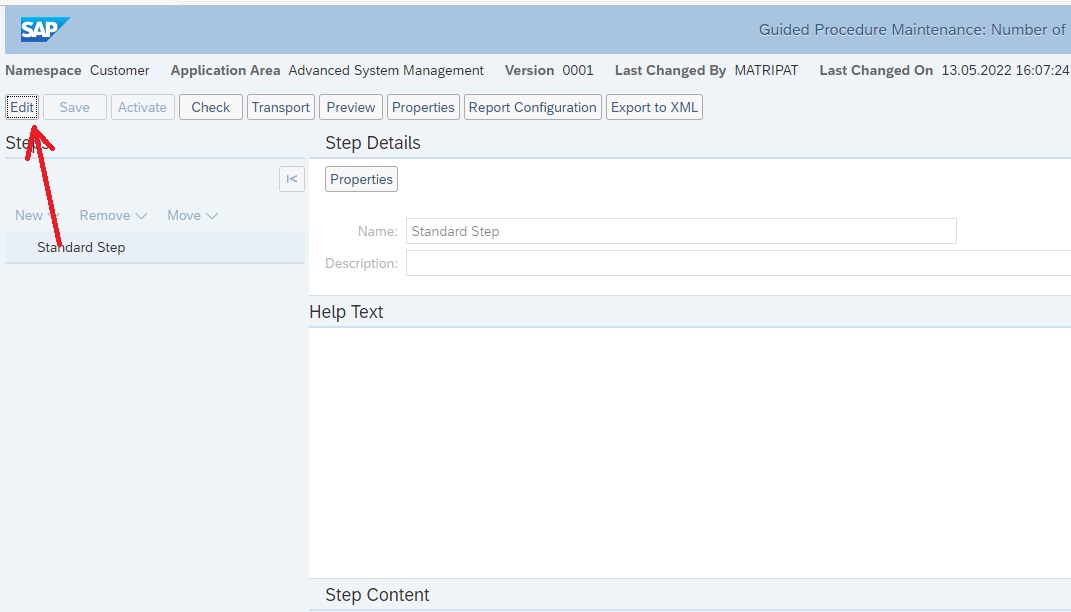
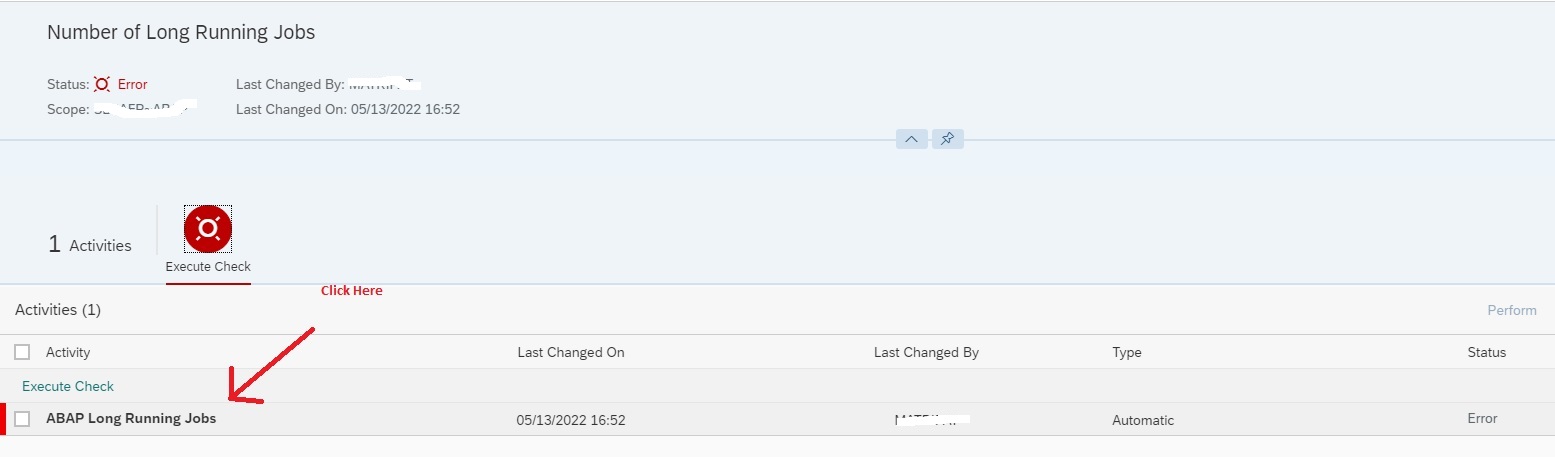
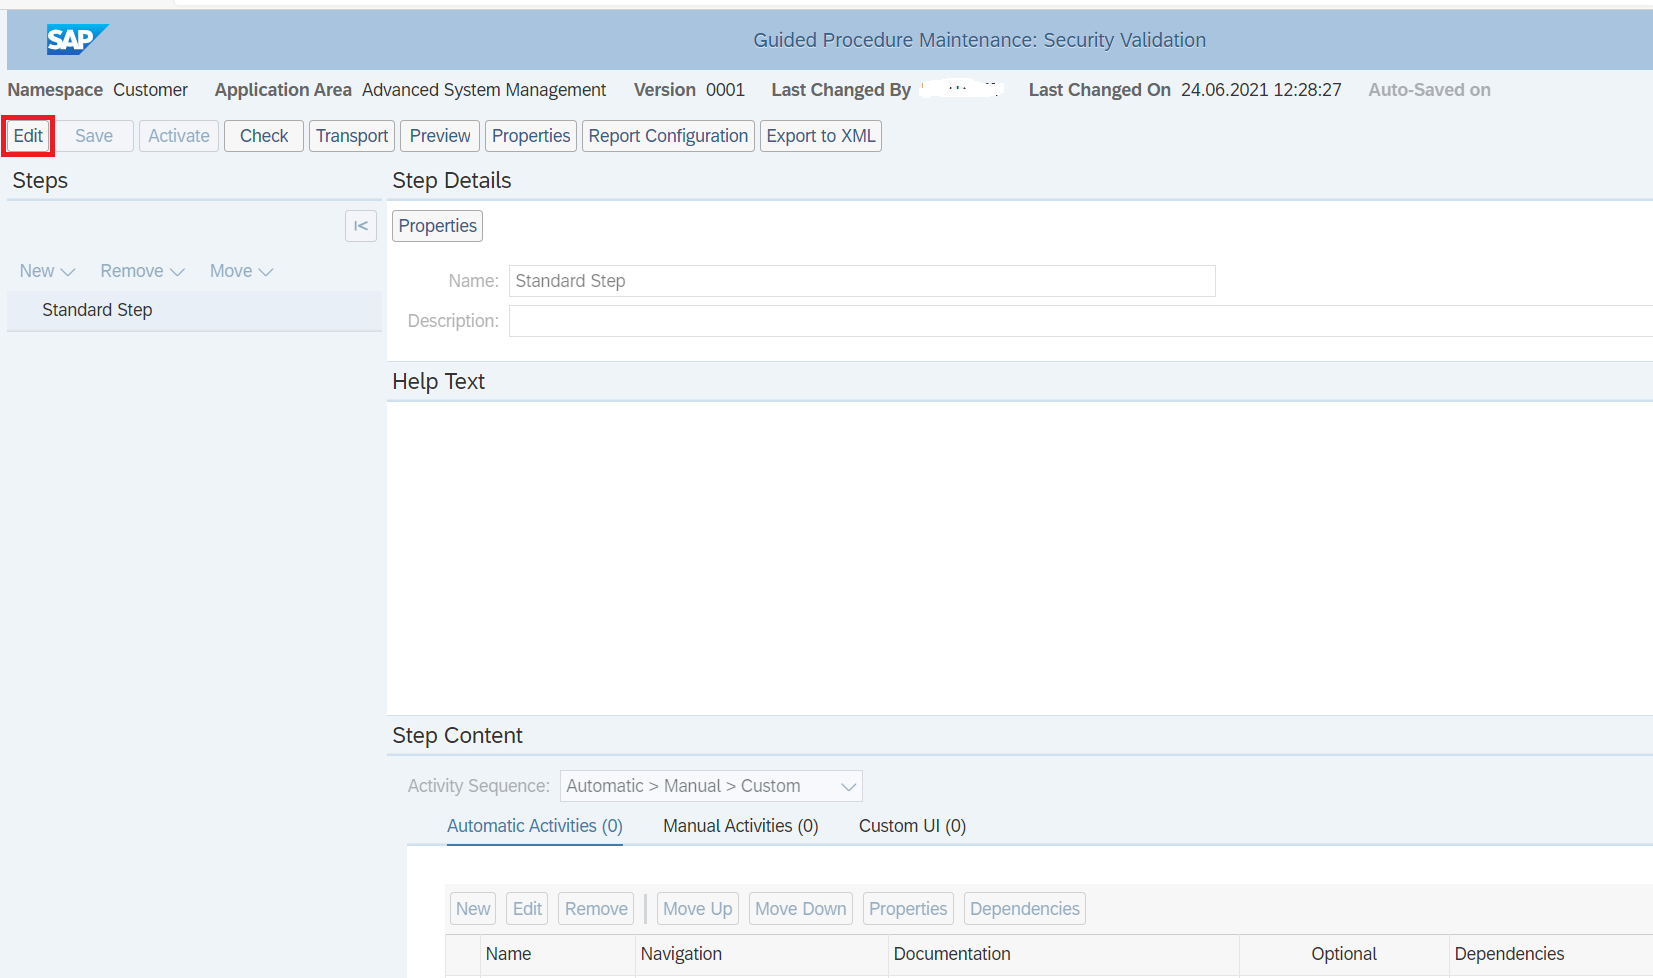
The guided procedure will now open in a new tab in the browser. Click on the edit button to start editing the guided procedure.
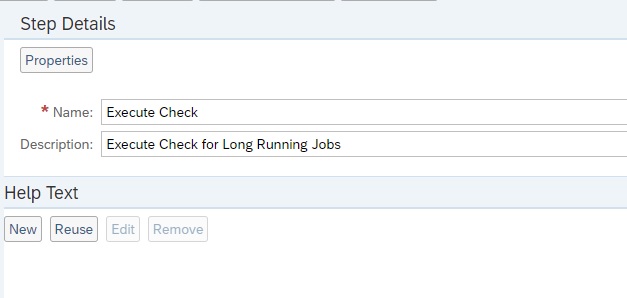
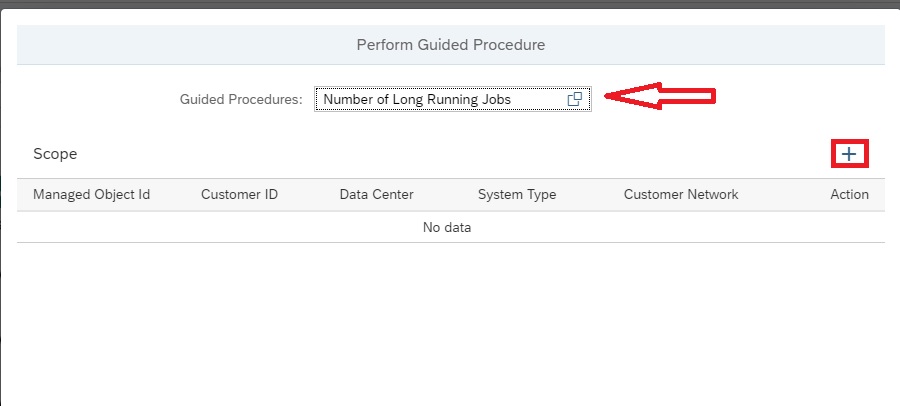
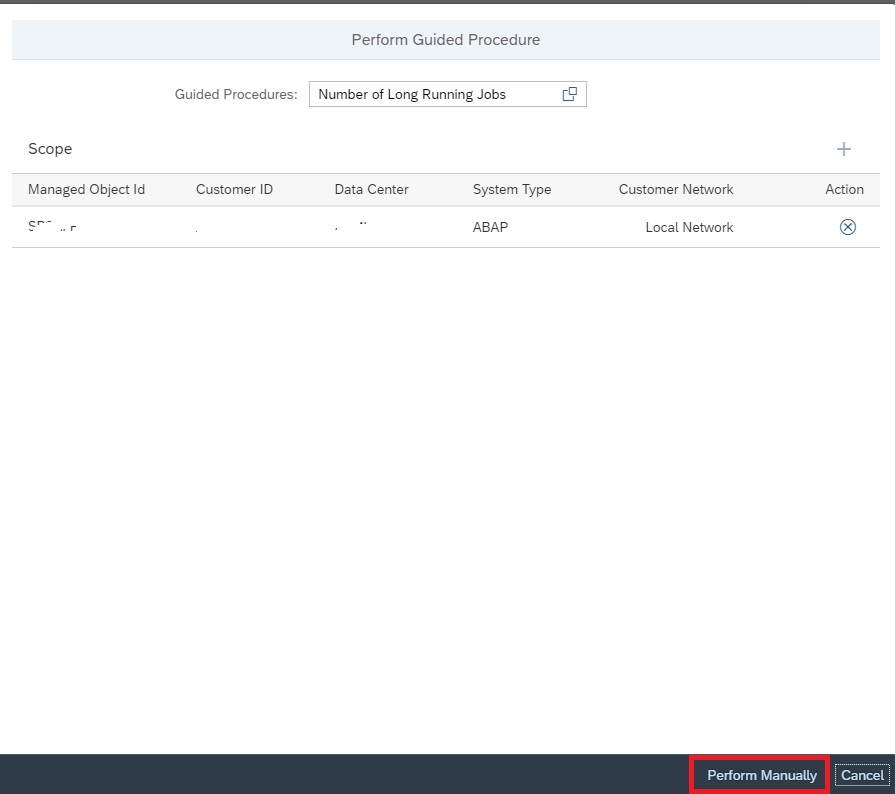
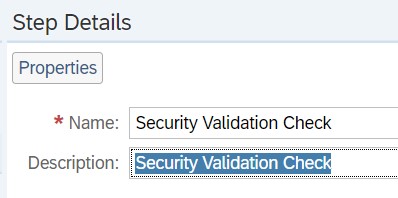
Now you need to add a automatic step to the guided procedure that will execute the security validation policy. For this, in the Step Details section, enter a step name and description.
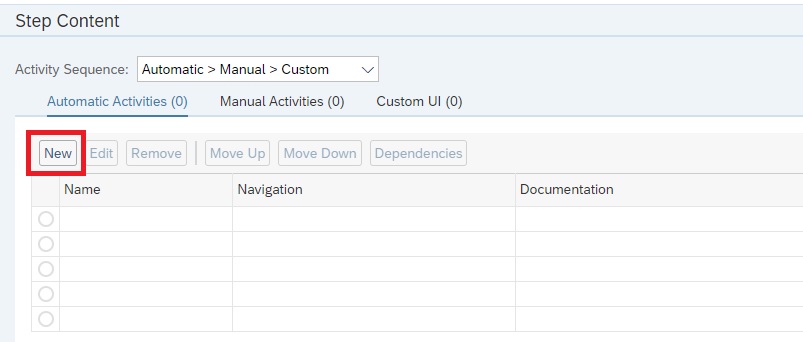
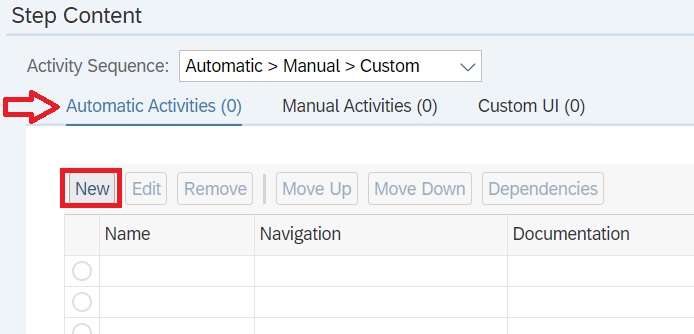
Navigate to Step Content block. In the Automatic Activities tab and click on New.
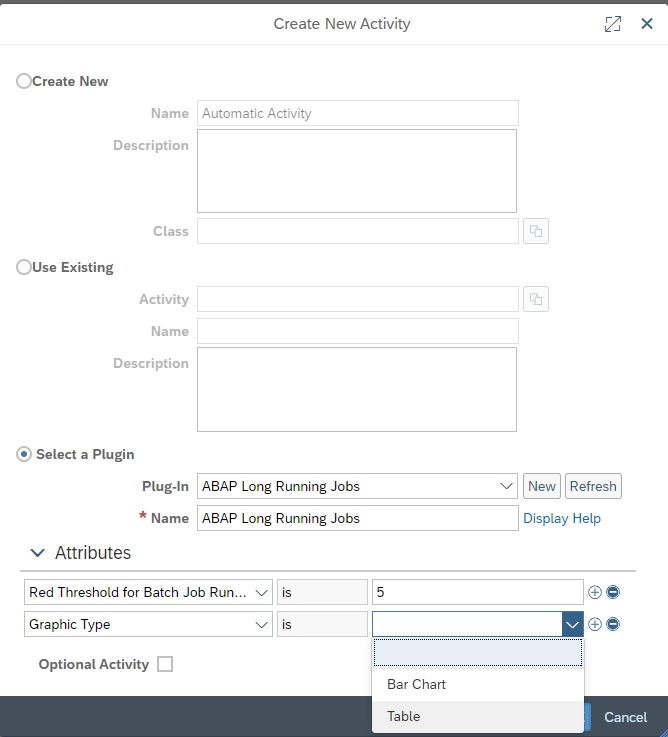
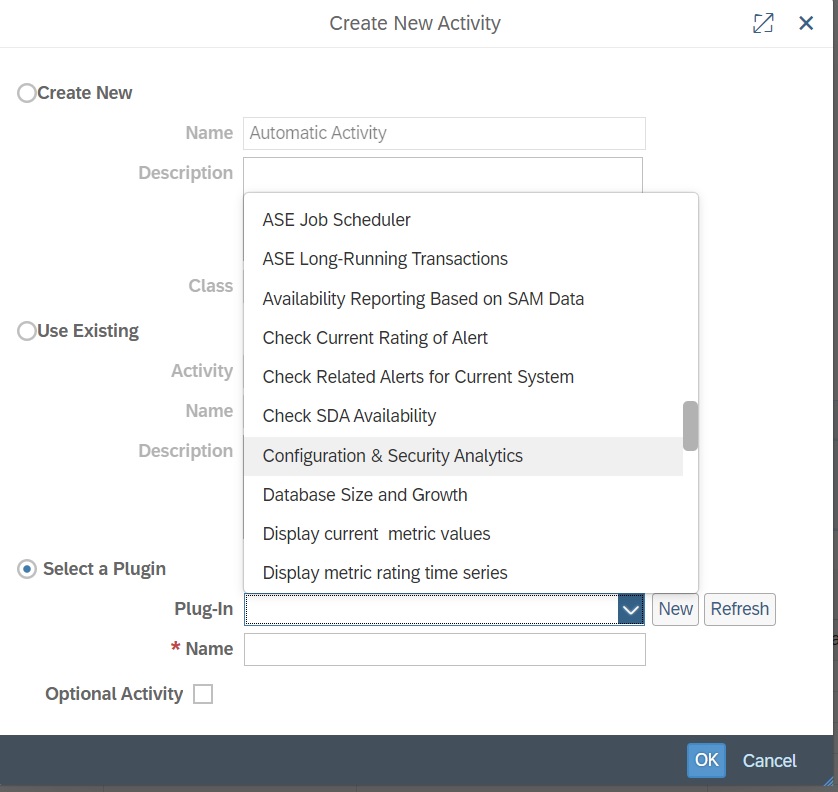
In the pop-up, select the option “Select a Plugin” and select the plugin Configuration & Security Analytics:
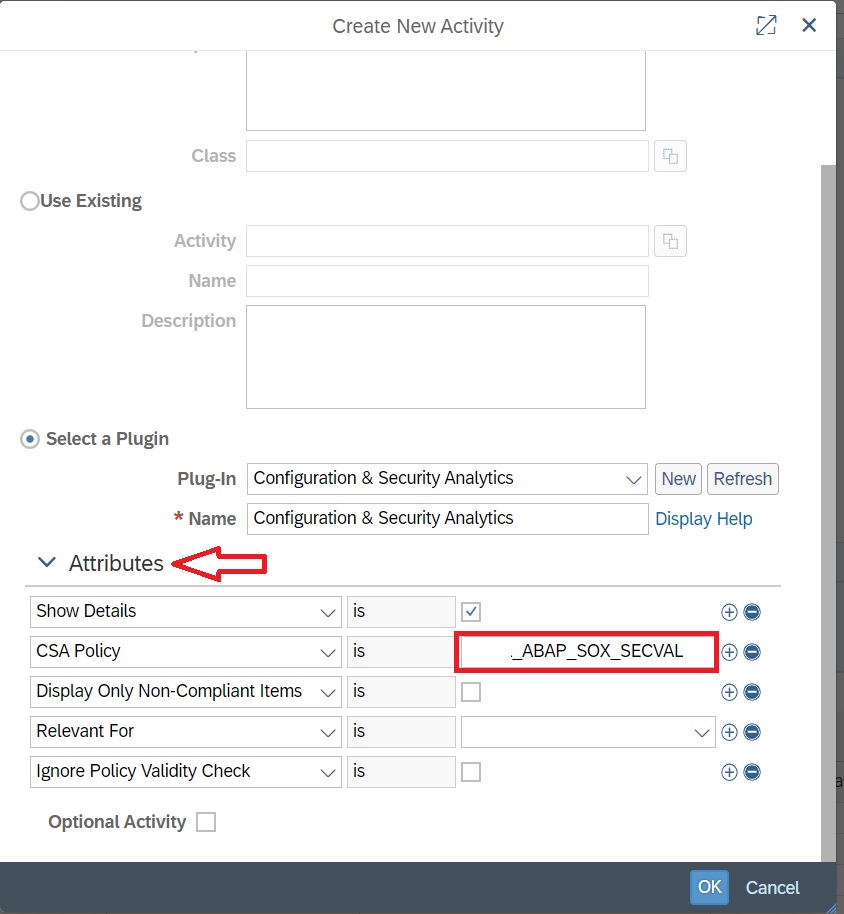
After selecting the plugin, expand the attribute section and provide the CSA policy name and click on OK.
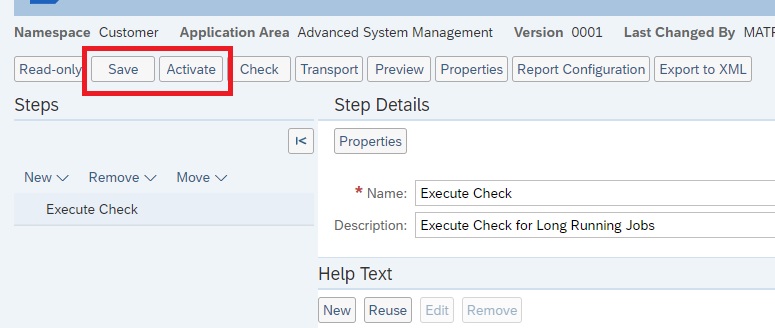
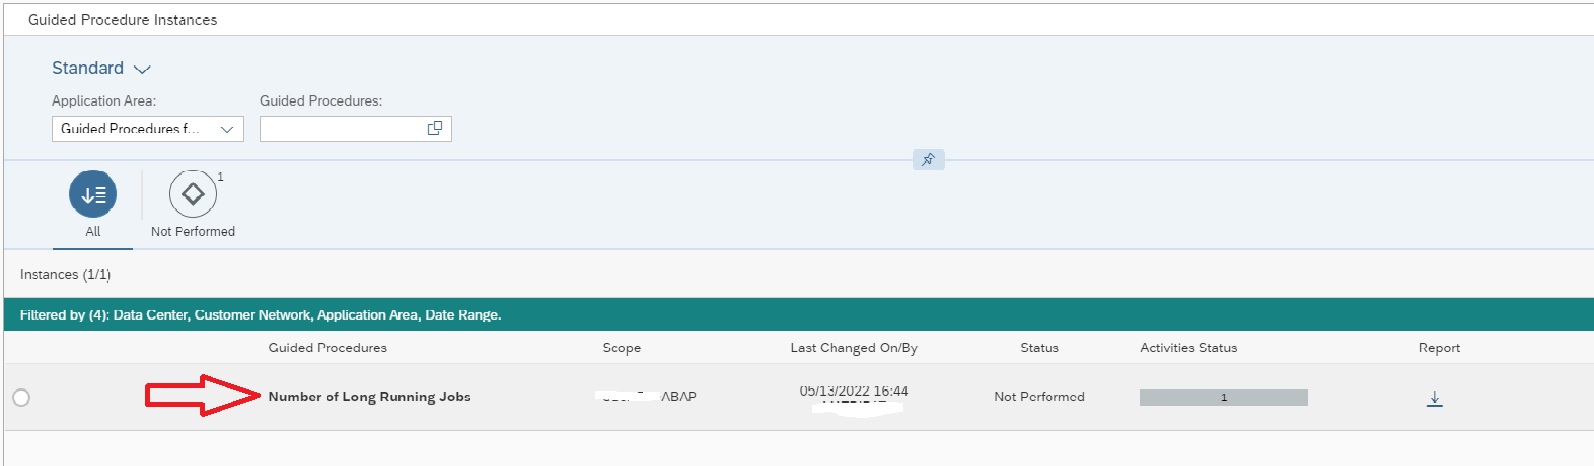
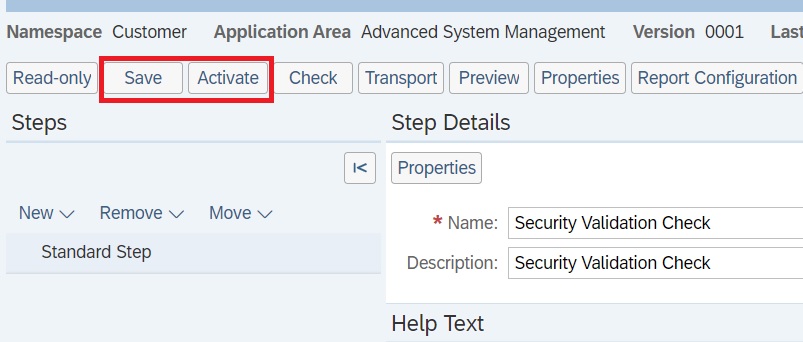
Back in the main screen save and activate the Guided procedure.
Now you can use this guided procedure to schedule an automatic execution to send an email report. You can do it in a similar fashion to sending email for System Health check report as explained here.
For more details on what all you can do with guided procedures, refer to the SAP Focused Run Expert Portal.
Transport tracking using SAP Focused Run configuration validation
For an SAP Application Management team in any IT landscape , doing a timewise tracking of transport movement across SAP System Landscapes is a very important monitoring requirement.
In this blog I’ll explain how you can do transport tracking, using Configuration Validation Trend Analysis application. With this you can track how many transports got imported verses how many got failed.
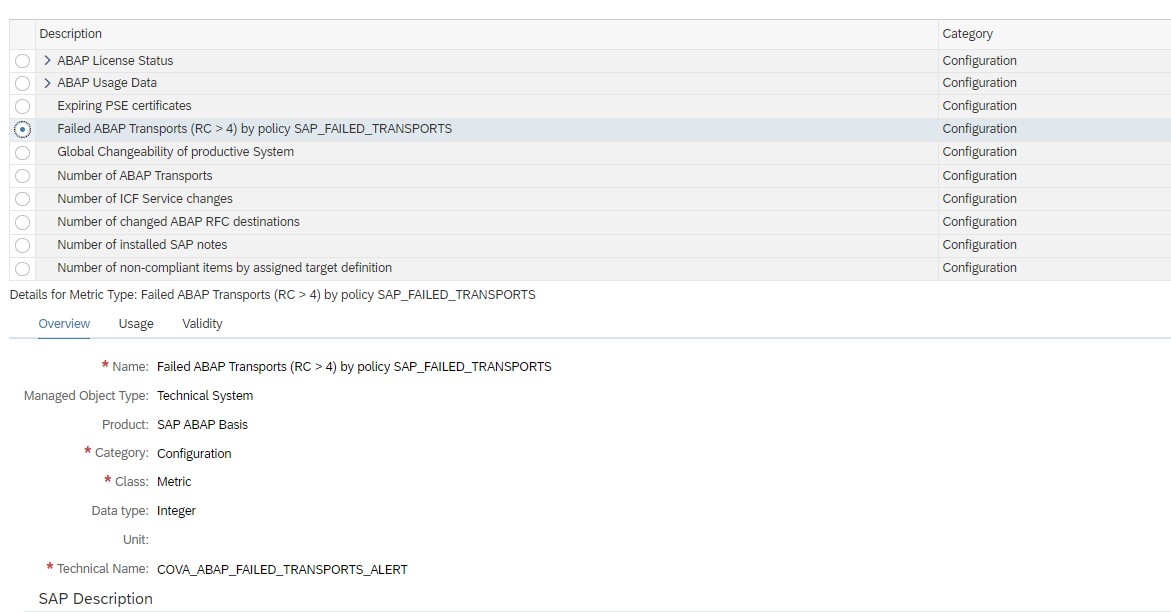
SAP provides a standard configuration validation policy called SAP_FAILED_TRANSPOTS that collects last 7 days data from config store ABAP_TRANSPORTS of SAP ABAP managed systems. SAP uses this policy result for the system monitoring metric for failed transport.
To be able to see a day wise trend for transports you will have to first copy this standard policy to a custom policy and change the time period of compliance rule in the policy from last seven days to last 1 day.
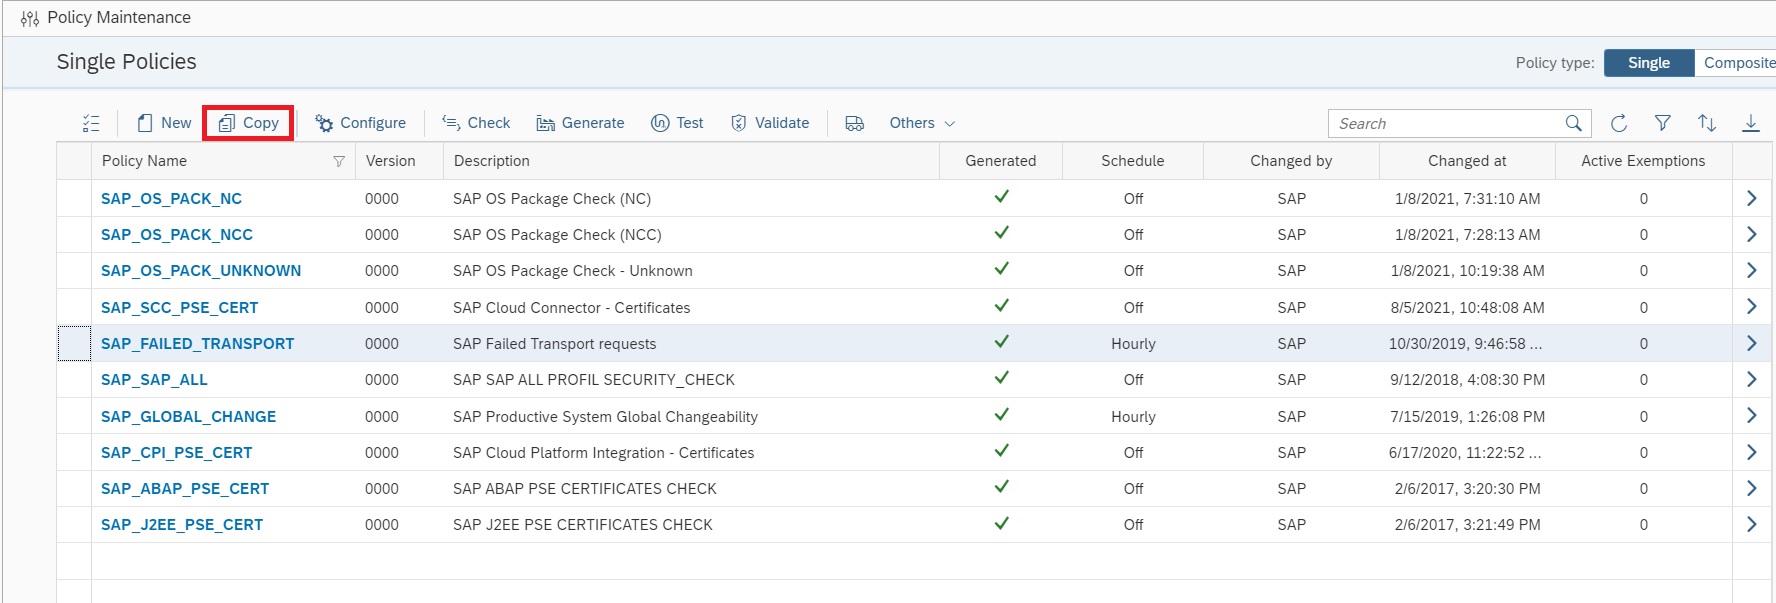
For this first you navigate to Policy Management app in Advanced Configuration Monitoring area in SAP Focused Run Launchpad.
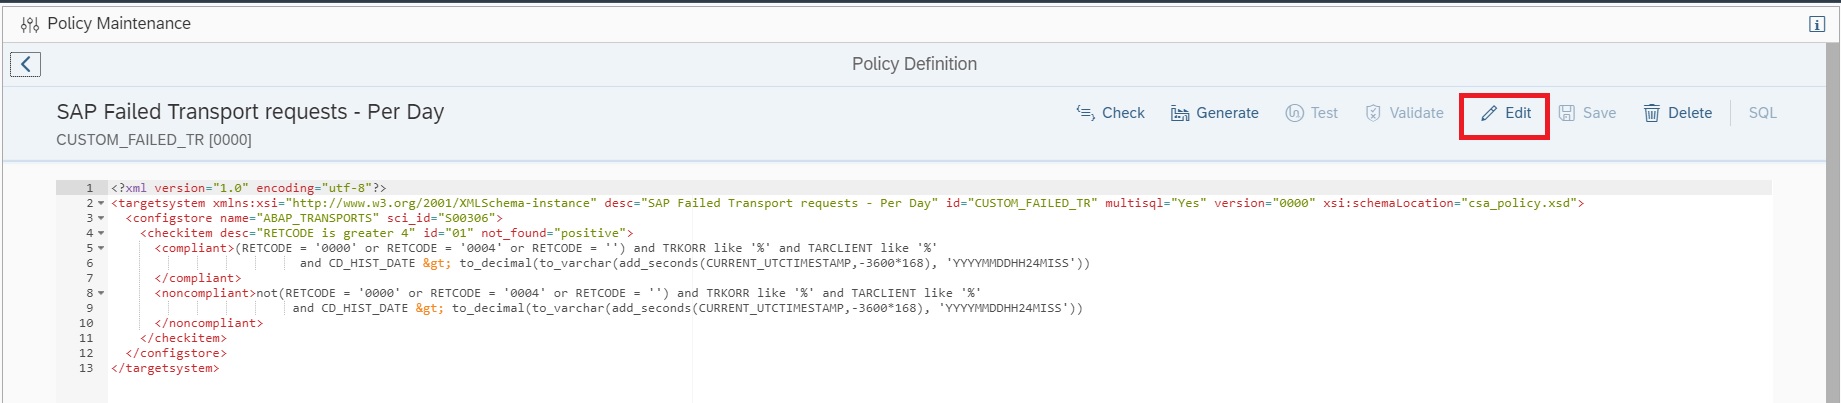
In the Policy Management App select the policy SAP_FAILED_TRANSPORTS and copy.
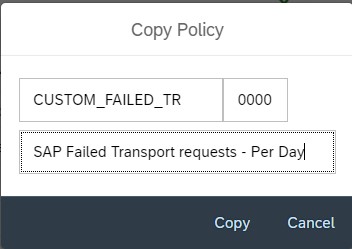
Provide a custom policy name and description and copy.
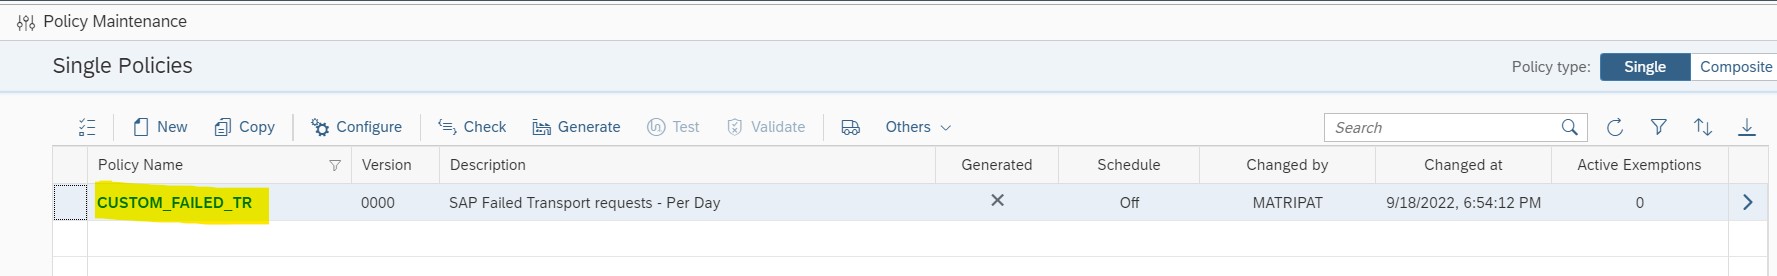
Now you will be back in the main screen, click on the custom policy name you just created.
In the policy editor screen click on Edit button to start editing your policy.
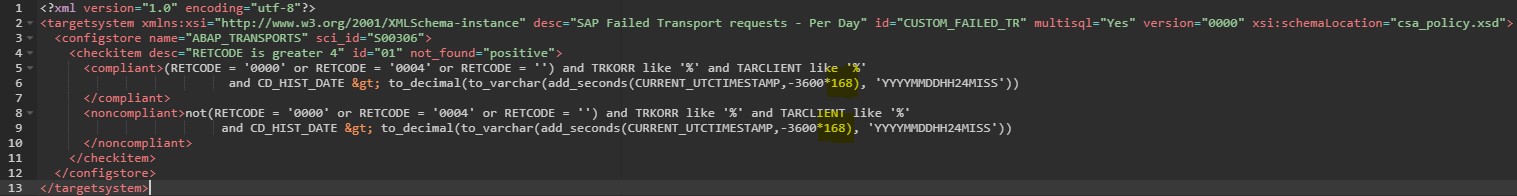
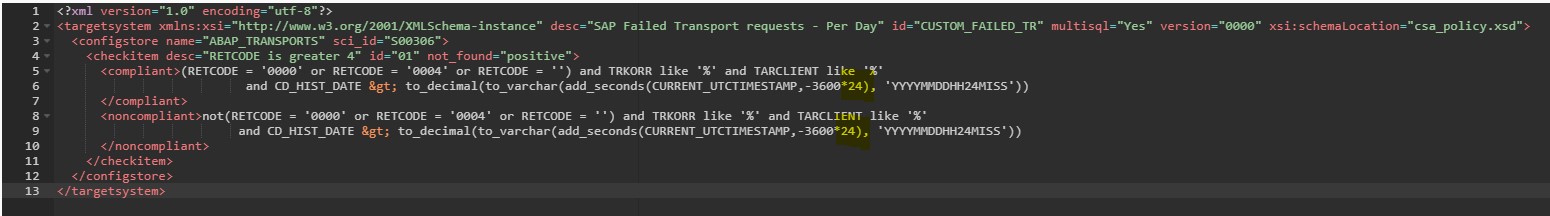
In the compliance rule change the hour value in CURRENT_UTCTIMESTAMP,-3600*168 from 168 to 24 CURRENT_UTCTIMESTAMP,-3600*24
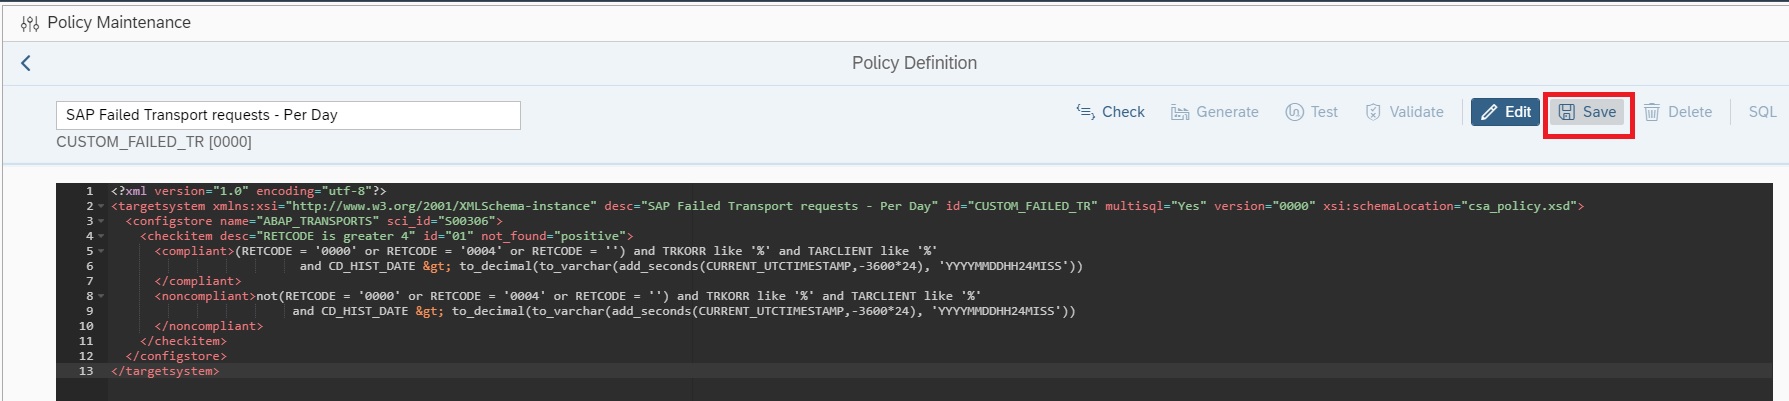
Save the policy by clicking on Save button.
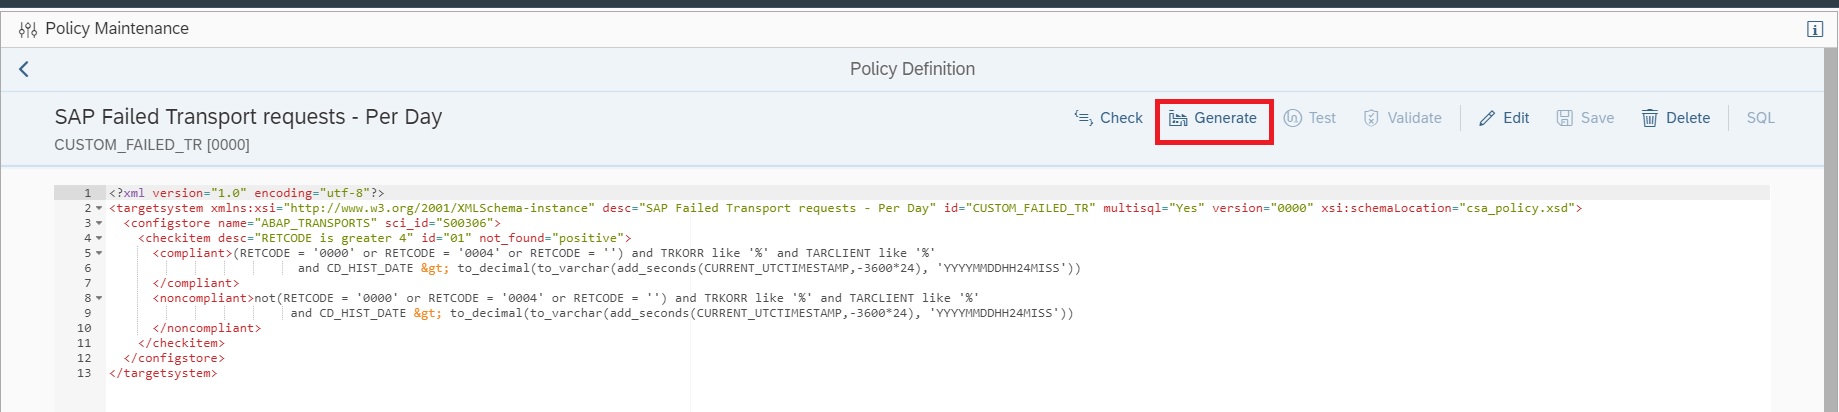
Now generate the policy by clicking on Generate button.
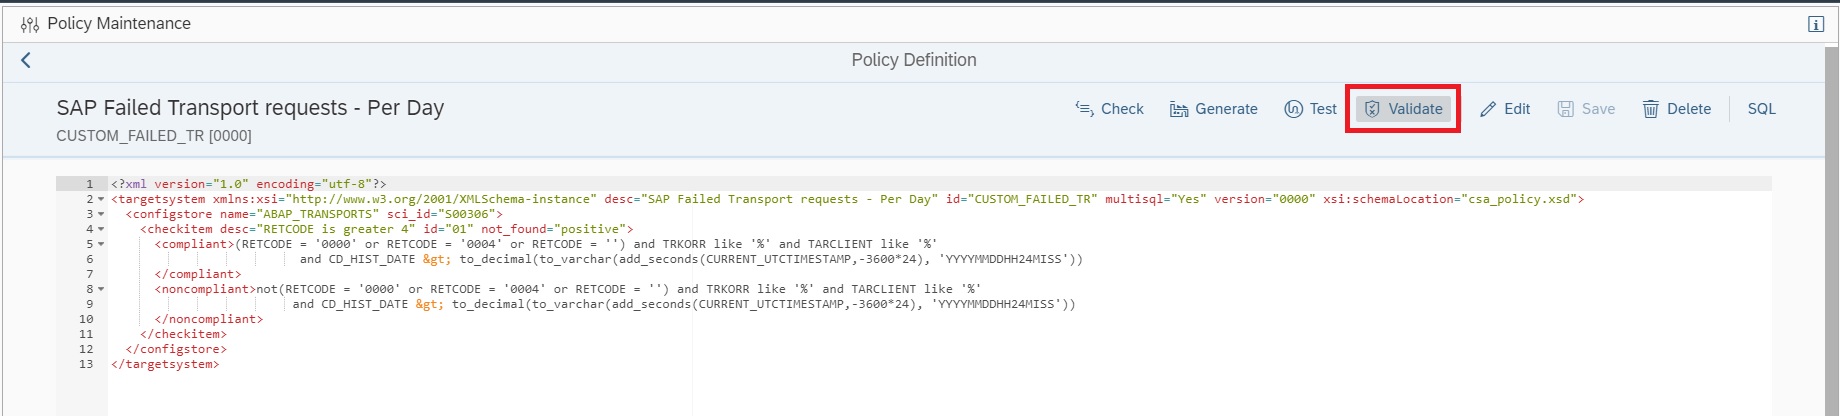
Now you can validate if the policy is working fine by clicking on the Validate button.
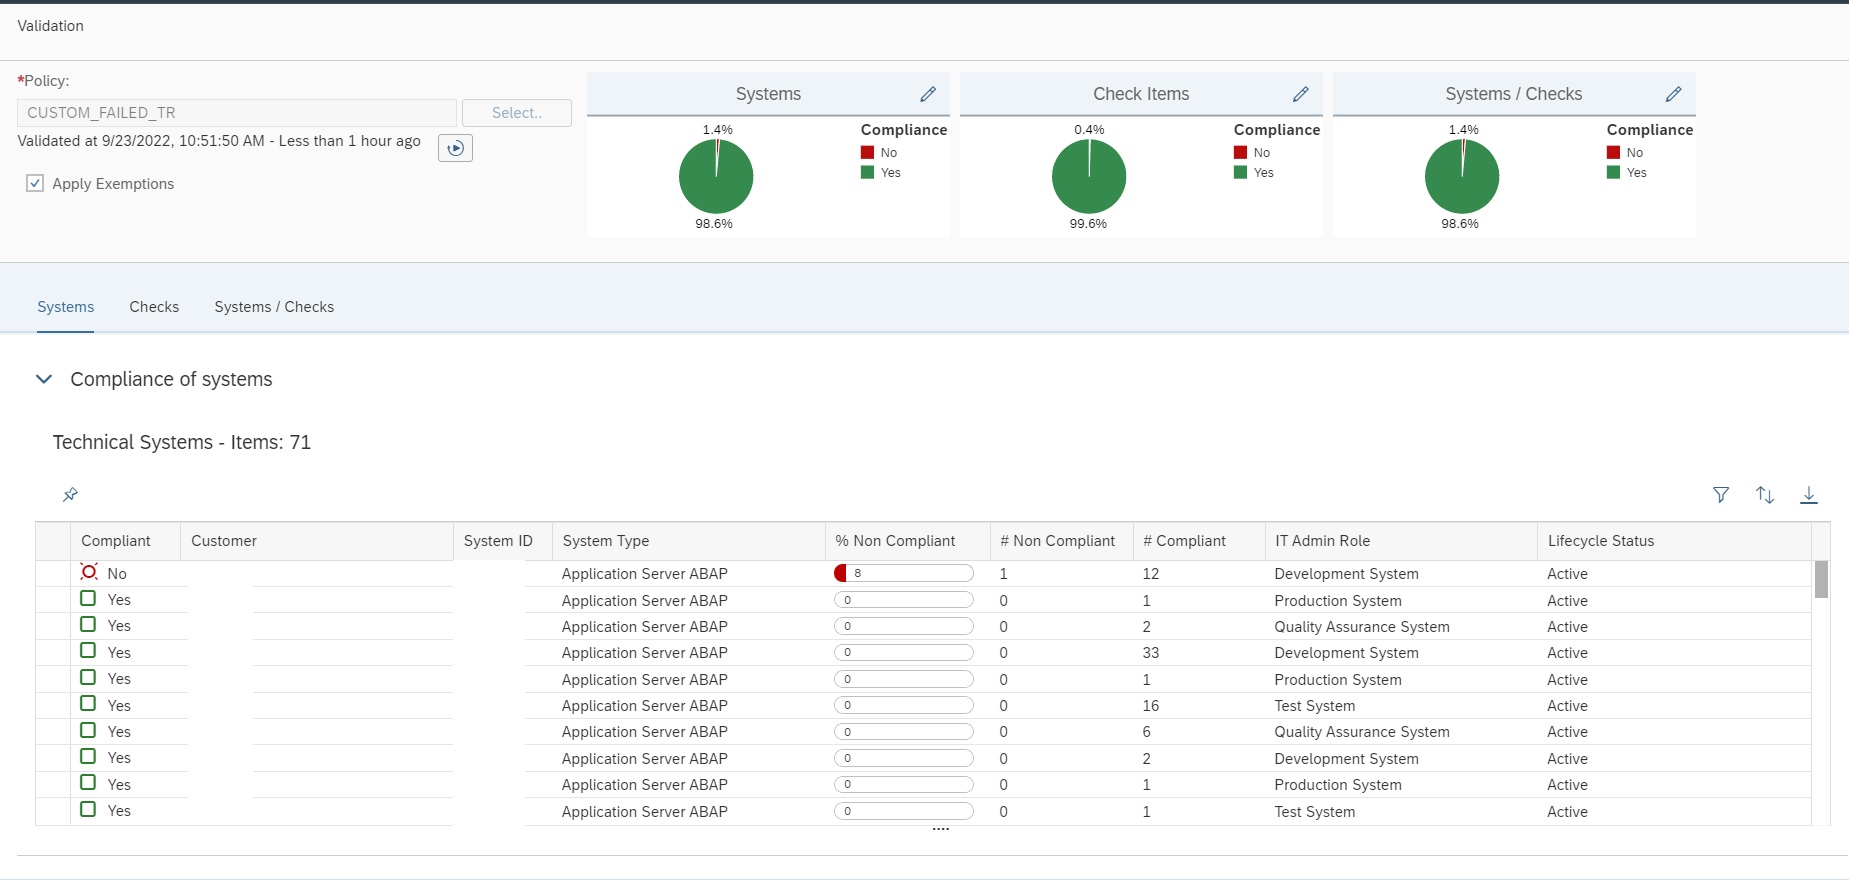
If no error is there, in a new window you will see the validation results as shown below.
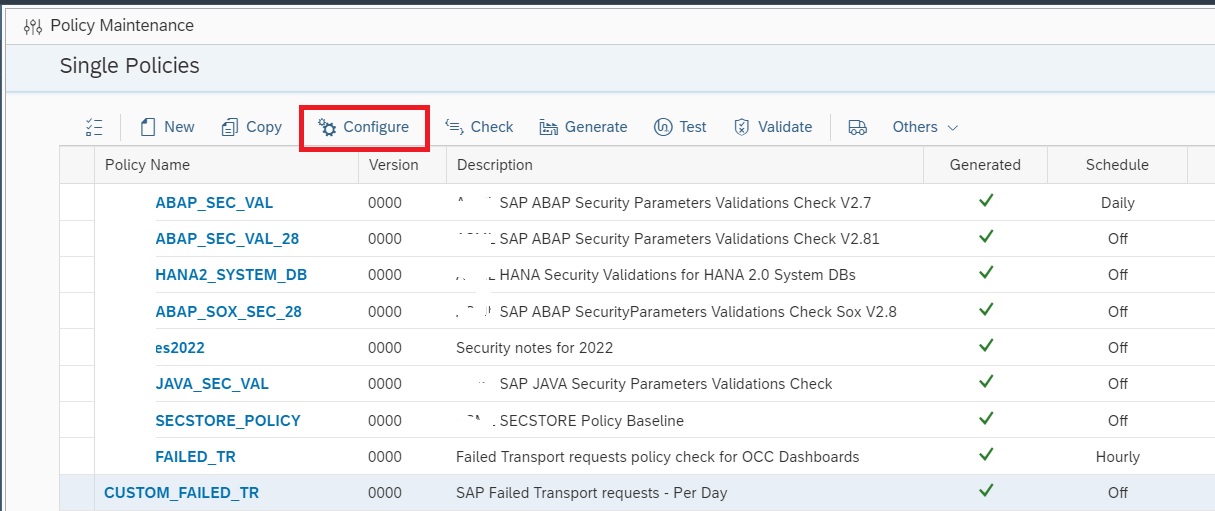
Now your custom policy is ready, but before you can use this policy for Trend Analysis you need to activate periodic data collection for this policy. For this navigate back to the main screen of Policy Management app.
In the main screen select the custom policy and click on Configure.
In the next pop-up window click on Edit button to continue.
You can now set the Validation run interval to Hourly or Daily and then save and exit.
After you schedule the validation wait for at least one week to see the data in the trend analysis app. Data will be available only from the time you activated the validation run schedule.
Now you can run Trend Analysis on this custom policy to do transport tracking. For this navigate to the Configuration & Security Analytics Trend Analysis App in the Advanced Configuration Monitoring area of Focused Run launchpad.
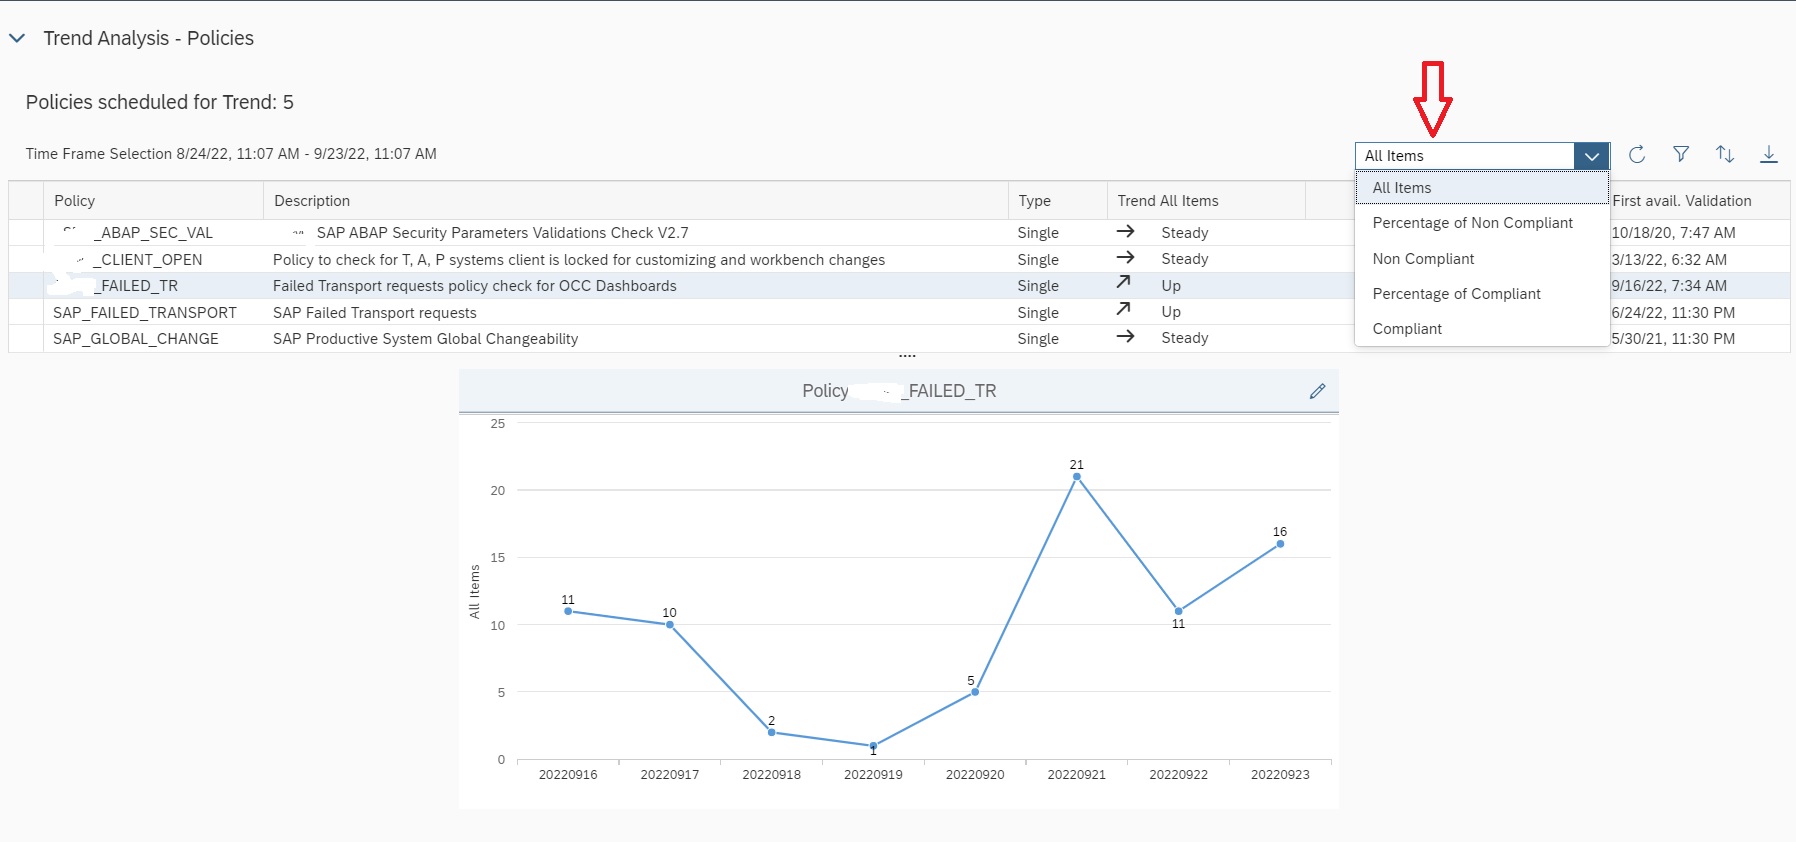
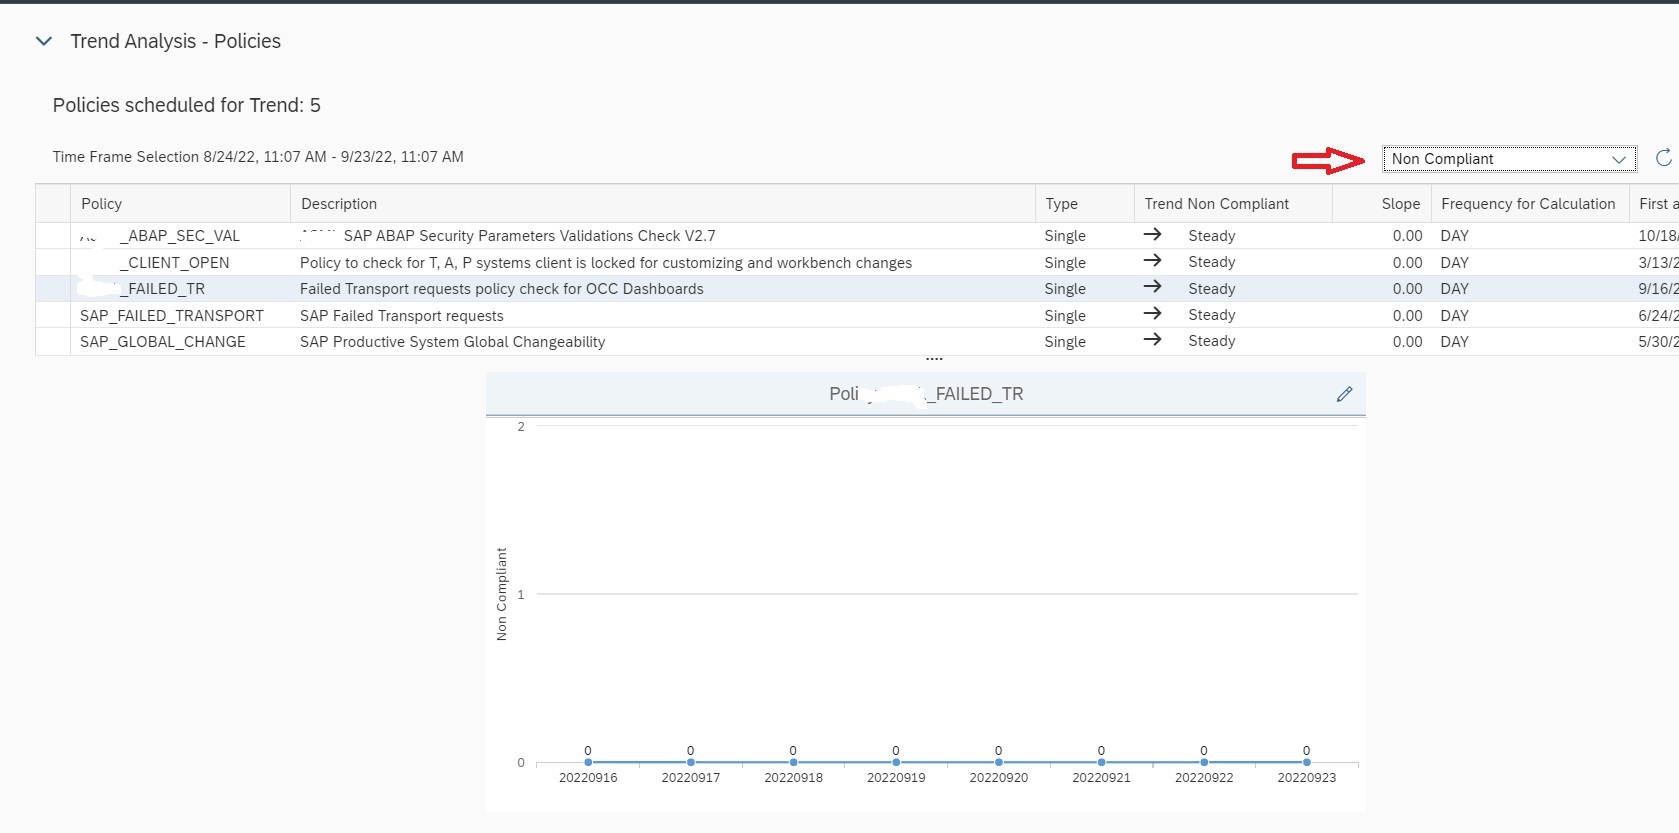
In the home screen app you will see the trend overview of the policies which are scheduled for validation run and for which data is available.
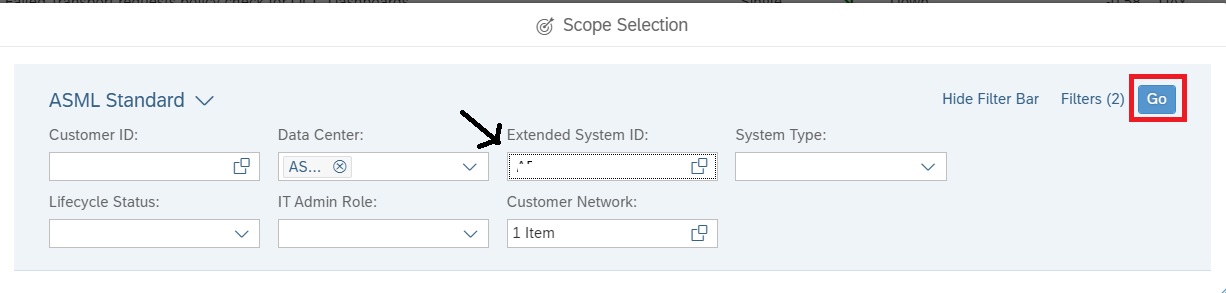
To do transport tracking on the custom policy you created and scheduled for validation, first select the managed system for which you want to do tracking in the scope selection.
After selecting scope, select the policy and in the the Key Figure dropdown select All items to see Number of transports imported to the managed system. If you select key figure Non Compliant it will show you the numbers for failed imports.
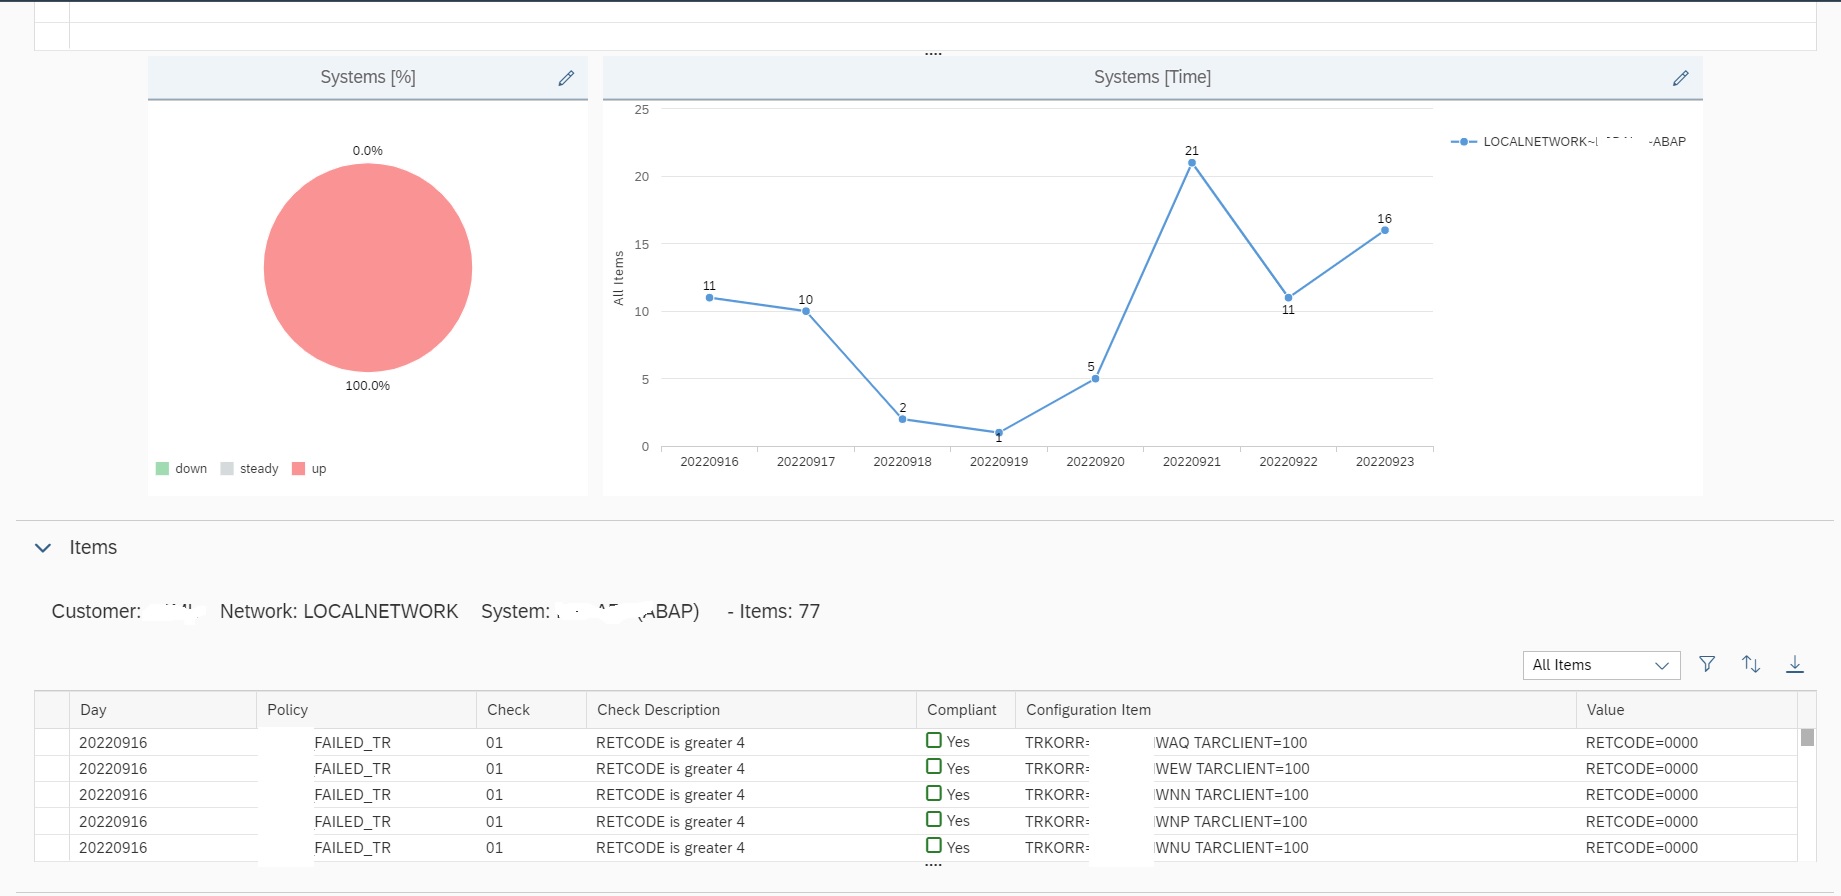
If you scroll down, you can also find details of each transport that were imported in the managed system in the specific time frame shown in the graph.
<< This blog was originally posted on SAP Focused Run Guru by Frank Umans and Manas Tripathy (SIMAC). Repost done with permission. >>