Performance issue solving is an important job for ABAP and basis consultant. One of the helpful tools is ST05 SQL performance trace tool.
Questions that will be answered in this blog are:
- How to switch on ST05 SQL trace?
- How to read the results from the ST05 SQL trace?
- How to use the ST05 SQL trace with multiple application servers?
The test program
First we create a small test program for our performance analysis.
REPORT zperftest.

DATA: zlt_vbak TYPE TABLE OF vbak.
DATA: zls_vbak TYPE vbak.
DATA: zlt_vbap TYPE TABLE OF vbap.
DATA: zls_vbap TYPE vbap.

SELECT * FROM vbak INTO TABLE zlt_vbak UP TO 1000 ROWS.

LOOP AT zlt_vbak INTO zls_vbak.
  SELECT * FROM vbap INTO zls_vbap.
    DO 10 TIMES.
      CALL FUNCTION 'BAPI_MATERIAL_EXISTENCECHECK'
        EXPORTING
          material = zls_vbap-matnr+0(18).
    ENDDO.
  ENDSELECT.
ENDLOOP.
Off course this program is written very badly to be really slow and making performance issues.
ST05 SQL trace
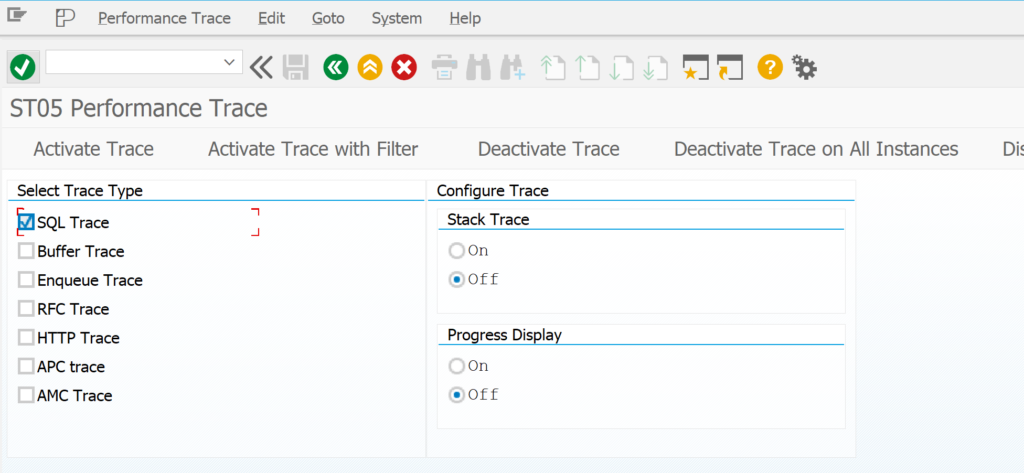
Start the ST05 SQL trace tool with transaction code ST05.
You can activate the trace for all users with the button Activate trace. But this is usually not needed and will only give you a long trace to analyze.
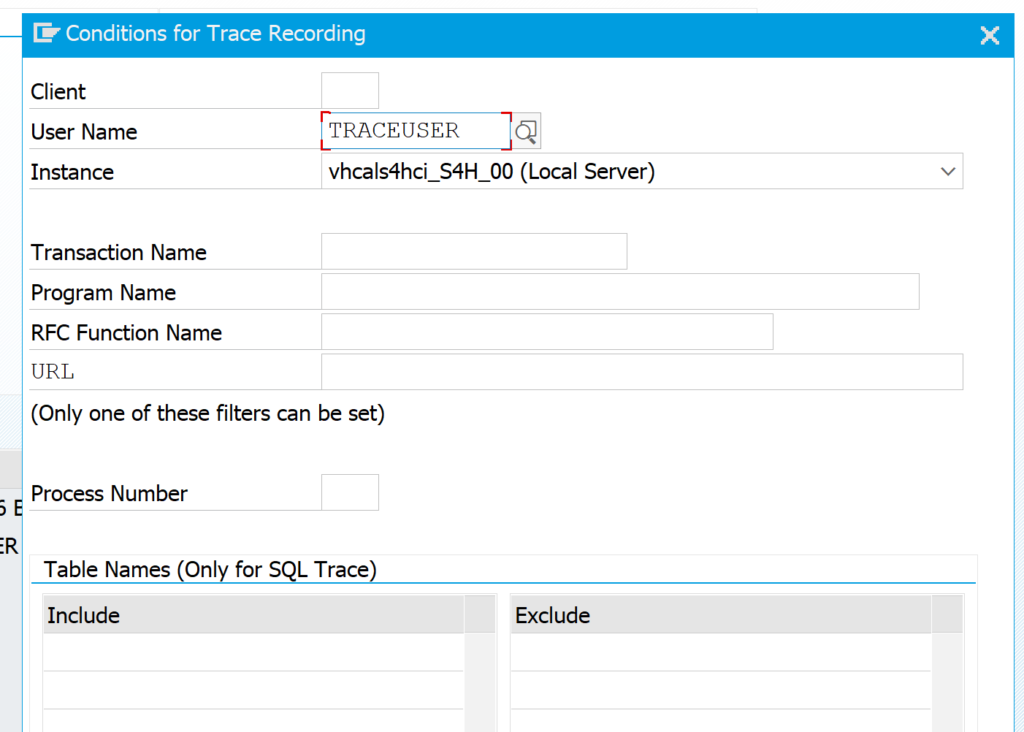
The usual method is to activate the trace with a filter, mostly on user name to trace a specific user action:
If the authorization team already started on ST01 authorization trace, you cannot start the SQL trace. First stop the ST01 trace.
Now you can start the performance test program in a different session. Just wait until it is finished. It is important the user you are tracing is only doing this action and does not perform any other action, since these other actions are also recorded and will make the analysis harder to read.
When completed go back to the ST05 and click Deactivate trace.
Trace analysis based on duration
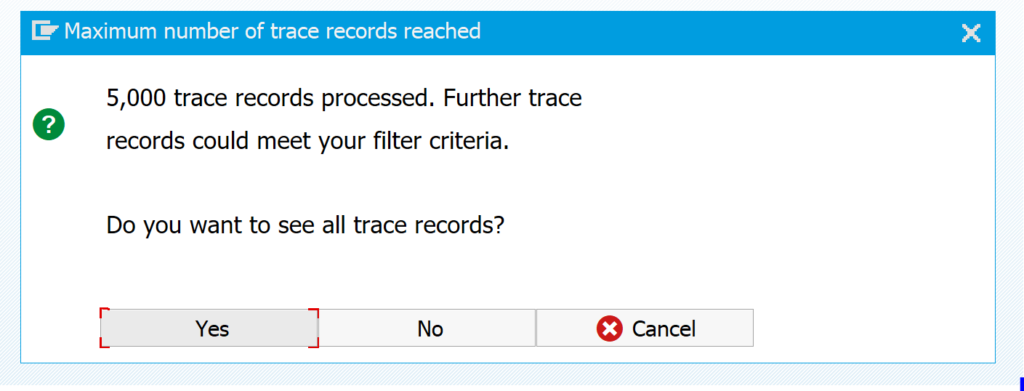
Now press the Display trace to see the results. If your trace is large you will get this screen:
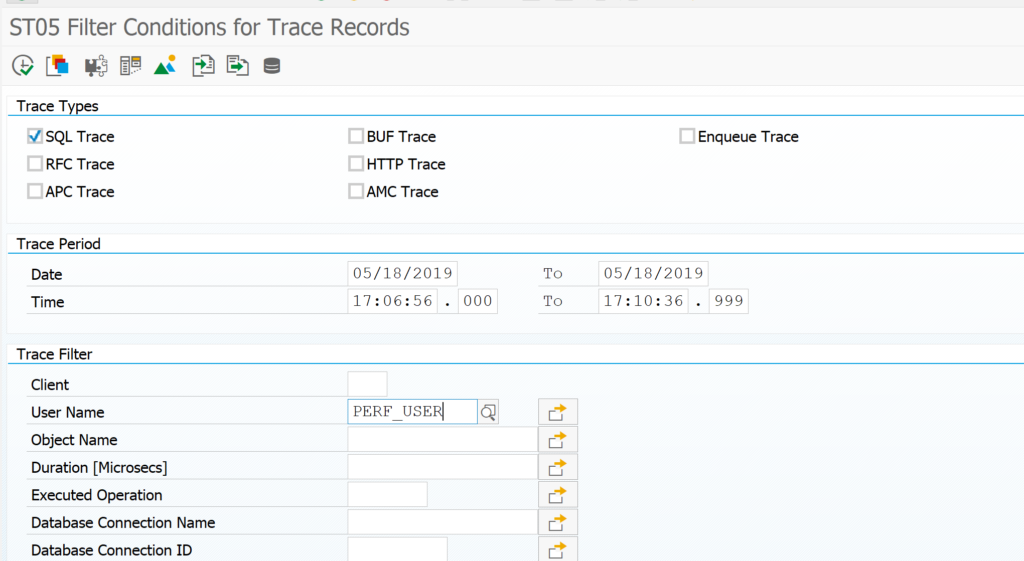
This is quite common and click yes. If your result is really too big, change the 5000 on the first screen in to a good maximum, or try to record a smaller time frame.
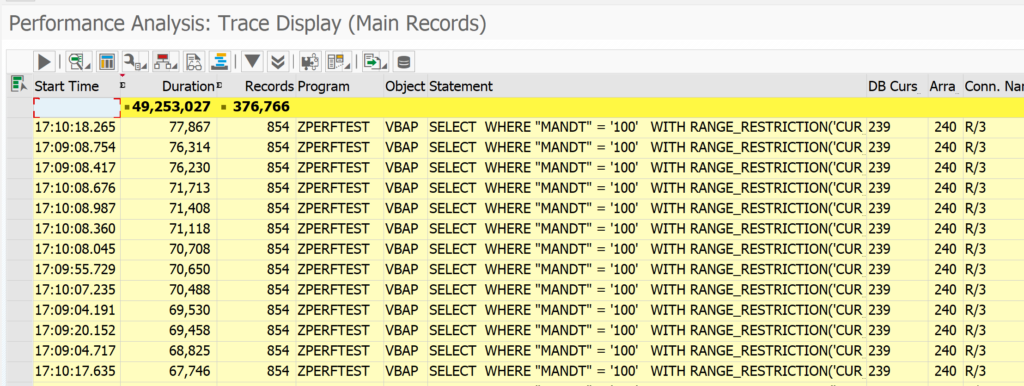
Result now looks like this after sorting on the column duration:
You can see that the total SQL commands took 48 seconds in total. The longest SQL single command took 78 milliseconds (which is very fast, so long running SQL’s are not the issue in this example).
In your case you might find very large single SQL commands. By selecting the line and pressing the button Display ABAP call location, you can jump to the place in the coding that fired the SQL command.
Summarized trace analysis
Since we have many records and many small ones, we need to use the summary tools. In the trace analysis select menu path Trace and then Structure Identical statements. This will give the following surprisingly short overview:
In the third column you can see that there are 100 identical calls, and also a high number of redundant calls.
If you now click on the second line to the ABAP call position you jump to our badly performing program and see that the majority of the delay is coming from the do 100 times loop. The first line is coming from standard SAP in the BAPI call.
This happens in real live as well that not all calls will point you into the right program. You might have to check multiple lines to find the right program causing the issue.
Multiple application servers
Development systems normally have only 1 application server. Productive servers can have more. If you have to analyze a performance issue directly on production with ST05, you have to be aware that the performance trace is per application server. If needed, you can select in ST05 as specific server, or you can select all. The trace display is still per server.
Relevant OSS notes
Notes to check or to apply:
- 2524975 – Performance tracing overview: SAT, ST05 & ST12 traces
- 2752370 – ST05: Trace Comparison Complains About Wrong Number of Traces
- 2910929 – ST05: Improve Navigation from OTHER Records
- 3019869 – ST05: Back-Navigation to Value Identical Statements
- 3263782 – SQL Trace (ST05) is not collected
- 3297424 – ST05: Prevent Calls to PlanViz for CALL SYS.TREXviaDBSL Statements
- 3569343 – ST05: Prevent ABAP Dump when Double-Clicking on OTHERS Entry in Aggregated Trace Lists

