Security teams might request to you as basis administrator: which RFC calls are being made to and from your ABAP system? And you need to know which users and applications are calling on RFC.
Questions that will be answered in this blog are:
Which users and systems are calling my ABAP system using RFC?
Which programs and processes are using RFC?
How much data is transferred using RFC?
If you need to check HTTP usage in your ABAP system: read this blog.
RFC statistics in ST03
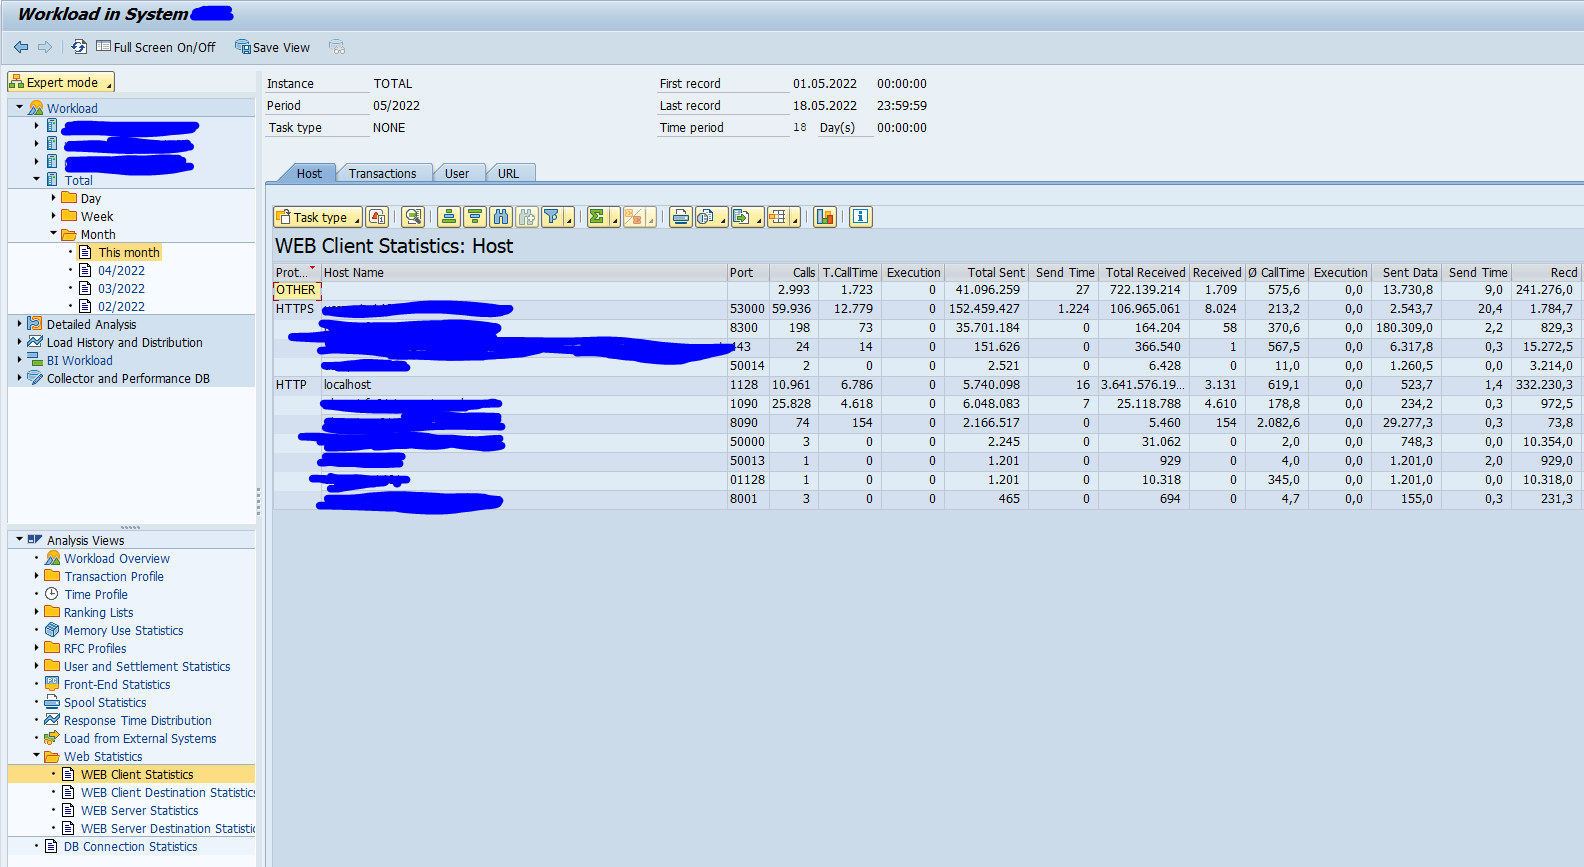
Go to transaction ST03N or ST03, and open the total for this month. Then open the analysis view for RFC statistics. First check the WEB Client Statistics:
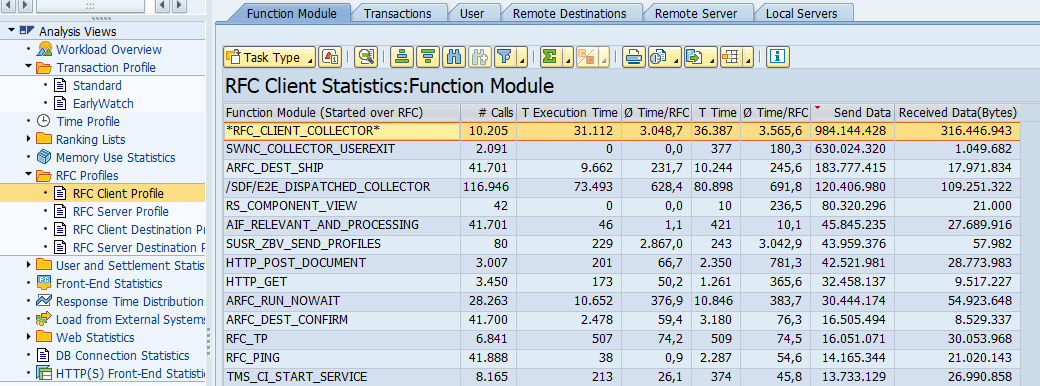
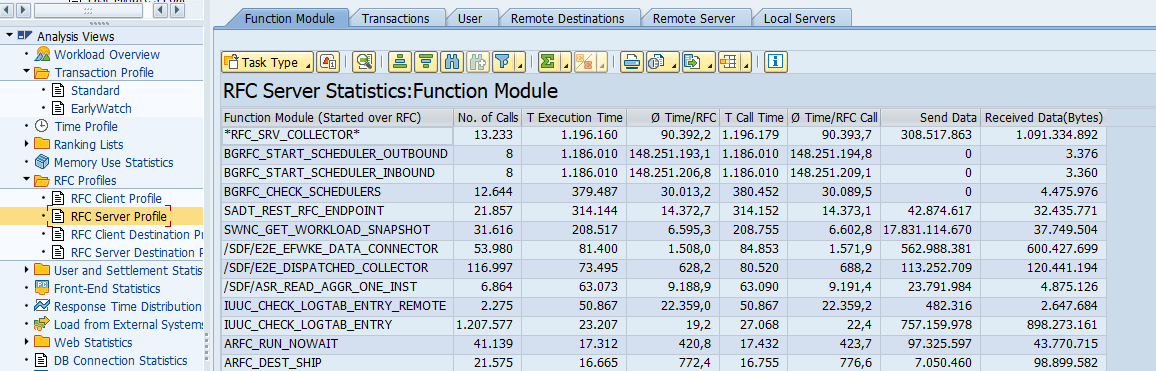
This already gives a lot of information: function modules and amount of data. On the tabs for Transaction, User and Remote destinations, Remote servers and Local servers you can get even more details you need for RFC transaction source.
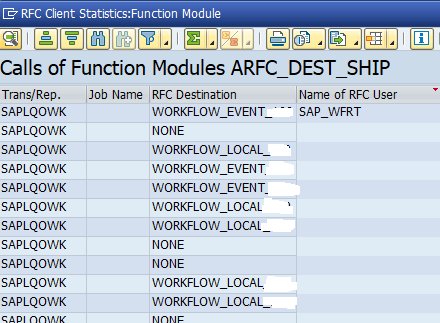
On all 6 tabs on all 4 reports you can double click to get more details:
Tab Page
Meaning
Function ModuleTransactionUser
What workload is caused by the function modules, transactions, or users (depending on the selected RFC profile, as the RFC client or the RFC server)?
Security teams might request to you as basis administrator: which HTTP calls are being made to and from your ABAP system? Or you might be requested to switch off HTTP (allowing only HTTPs) and you need to know which users and applications are still calling on HTTP.
Questions that will be answered in this blog are:
Which users and systems are calling my ABAP system on HTTP?
Which systems does my ABAP system call using HTTP?
Which programs and processes are using HTTP?
If you need to check RFC usage in your system: read this blog.
Web statistics in ST03
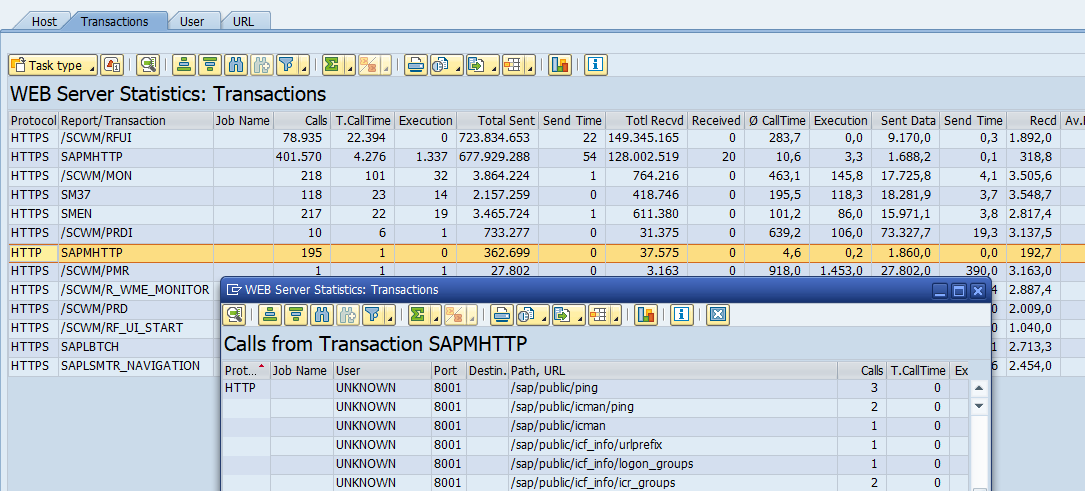
Go to transaction ST03N or ST03, and open the total for this month. Then open the analysis view for web statistics. First check the WEB Client Statistics:
This already gives a lot of information: host and port information, amount of calls. On the tabs for Transaction, User and URL you can get even more details you need for transaction source, user and URL’s on HTTP.
On all 4 tabs on all 4 reports you can double click to get more details. After double-click both HTTPs and HTTP are show. Be sure to filter on HTTP:
Statistics
Description
WEB Client Statistics
Workload due to requests for which the system acts as a Web client
WEB Client Dest. Statistics
Workload due to requests for which the system acts as a Web client, broken down by different client destinations
WEB Server Statistics
Workload due to requests for which the system acts as a Web server
WEB Server Dest. Statistics
Workload due to requests for which the system acts as a Web server, broken down by different server destinations
Common cases
Common cases you might want to check for HTTP use:
RZ70 data supplier to SLD
Content server calls (check in OAC0 if you use the SSL port number or a port number on HTTP)
Most of the calls will work on HTTPs as well as HTTP. The most common problem is that end users will have bookmarked the HTTP version in their browser. They will need to be informed the HTTPs version (with a different port number). If you switch off HTTP in this case when a lot of people are still using HTTP you will get a lot of tickets and complaints. Use the web client statistics as explained above to see which entry URL’s they are using. Then mail them to use the new HTTPs entry URL’s with the appropriate port and ask them to switch. Repeat this a few times until the amount of stubborn users is low enough to disable HTTP.
Disabling HTTP check
In transaction SMICM go to the Services icon and then check there is nothing running with an HTTP port.
If you are using SAP Focused Run, read this blog to set up a Security and Configuration validation rule to execute a landscape wide scan on use of HTTP port.
If you are running a global system you want to see the usage of the system round the clock. Unfortunately the standard delivery of SAP is summing up the early morning and night hours in the ST03N time profiling.
This blog will explain you how to change this to 24 hours statistics recording.
Questions that will be answered in this blog are:
How to switch to 24 hour time profiling?
How does the result look like?
General information on ST03N can be found in this blog.
Switching to 24 hour time profiling
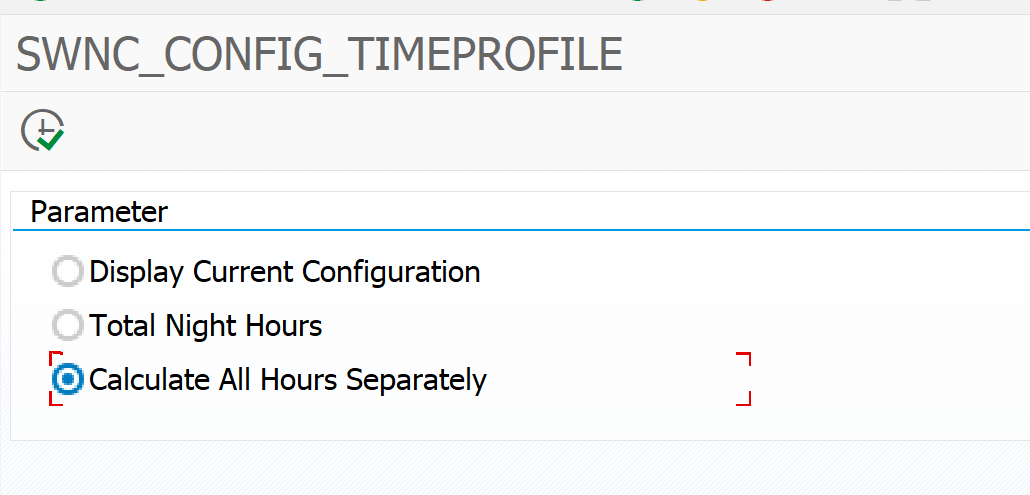
To switch to 24 hour time profiling start program SWNC_CONFIG_TIMEPROFILE:
Select the Calculate All Hours Separately option and hit the execute button. Done.
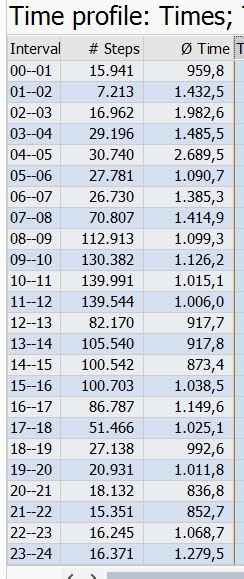
The end result
Before you can see the end result you best wait one week for the changed statistics to record.
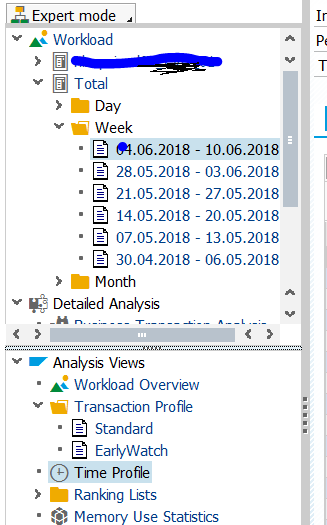
After 1 week go to transaction ST03N and select the Time Profile option in the expert section: