Custom program for checking webservice availability

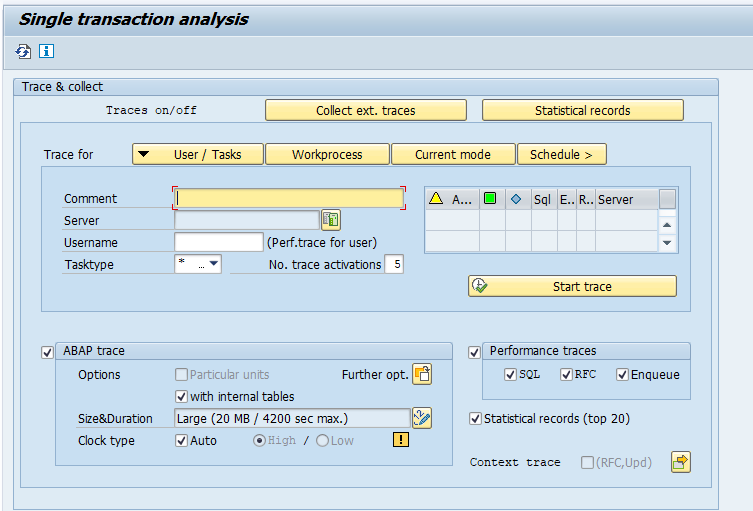
In SOAMANAGER you can test if a web service can be reached by pressing the test connection button. Unfortunately there is no standard SAP program that performs this test in the background. So how to monitor the availability of a web service?

Solution: custom Z program that can be run online or in background.

In this case we have chosen to put the alert into SM21 system log. But you can also replace this part of the code with sending an email.

Preparation

In SE92 (see this blog) create a new message for the system log.

Z program for monitoring web service

Now create a new Z program:

REPORT z_bc_ws_check.

CONSTANTS zmesid TYPE char3 VALUE 'ZZ1'. "system log message ID defined in SE92
DATA: zif_soap_ping TYPE REF TO cl_soap_ws_ping.
DATA: zlv_ok TYPE boolean.

PARAMETERS zservice TYPE seoclsname. "webservice name
PARAMETERS zlp TYPE prx_logical_port_name. "logical port name


START-OF-SELECTION.

  AUTHORITY-CHECK OBJECT 'S_SRT_CF_C' "check soap runtime auhtorizations.
      ID 'ACTVT' FIELD '03'.

  IF sy-subrc EQ 0.

* create object for soap ping test
    CREATE OBJECT zif_soap_ping TYPE cl_soap_ws_ping.

* initialize ok code
    zlv_ok = 'X'.

* try the ping test
    TRY.
        CALL METHOD zif_soap_ping->if_soap_ws_ping~ping_ws
          EXPORTING
            service = zservice
            lp_name = zlp.
      CATCH cx_soap_ping.
* any error, clear the ok flag
        zlv_ok = ' '. "not ok
    ENDTRY.

    IF zlv_ok EQ ' '. "not ok
* write to SM21 system log
      WRITE: / TEXT-004. "ping not ok
      CALL FUNCTION 'RSLG_WRITE_SYSLOG_ENTRY'
        EXPORTING
          sl_message_area  = zmesid(2)
          sl_message_subid = zmesid+2
          data_word1       = zservice ##NO_TEXT.

      IF sy-subrc EQ 0.
        WRITE: / TEXT-001. "succes to write to SM21
      ELSE.
        WRITE: / TEXT-002. "fail to write to SM21
      ENDIF.
    ELSE.
      WRITE: / TEXT-003. "ping ok
    ENDIF.
  ELSE.
    WRITE: / TEXT-005. "not authorized
  ENDIF.

Create the text elements accordingly.

You can change the authorization check and in stead of writing system log message in SM21 do some other alerting like sending a mail, or pick up the entry in SAP Focused Run monitoring.

Running the program

Run the program:

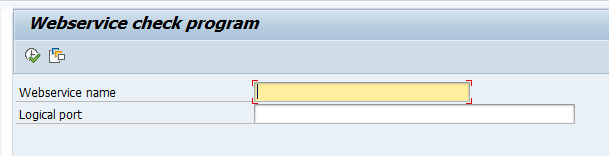
Enter the webservice name and logical port. Hit execute.

You can also run the program in background mode. For example every 15 minutes. Create multiple steps for multiple web services to test.

Explanation

The program simply creates the object of type CL_SOAP_WS_PING to perform the web service ping. The ping test is then performed. Based on the result the text ok or an entry to SM21 is written.

ST07 Application monitor

The ST07 application monitor tool can help you in analysis of your system for performance and usability. It gives an overview of how many users are using which functional part of your SAP system.

Questions that will be answered in this blog are:

  • How to run the ST07 application monitor?

Application monitor

If you start ST07 you reach the application monitor start screen:

Here you can see how many users are defined and actually logging on across the modules. Basis is very high usually since this includes SMEN which is the start menu. The Other category is for Z transaction codes and/or addon software.

By double clicking on any line you can inspect the lower application levels.

DB access analysis

From the main screen, you can hit the button DB accesses to view which application parts are responsible for the majority of the database accesses:

Reporting performance issues to SAP

Questions that will be answered in this blog are:

  • Which information should I provide when reporting a performance issue to SAP?
  • What should I have already checked before submitting performance issue to SAP?

When to report a performance issue to SAP?

You can report a performance issue to SAP when you are sure it is caused by standard SAP.

There are 2 cases:

  1. Overall system performance
  2. Specific transaction performance

Validations to be done upfront:

What information to provide in a performance issue to SAP?

In case of specific performance issues, add as much specific information as possible. Try to have a case in a development, test or acceptance system as well. In these systems SAP can replay the performance issue without running the risk of hampering the end users performance. Add trace files (ANST, ST12) to speed up the analysis for SAP. It also makes debugging and running large trace files easier for SAP.

SAP checklists

Good checklists are present in OSS notes:

ST12 performance tracing

The ST12 performance tracing tool allows you to collect performance data for solving a performance issue for a single transaction.

Questions that will be answered in this blog are:

  • Which data is collected in a ST12 performance trace?
  • How do I execute a ST12 performance trace?
  • How do I analyse a ST12 performance trace?
  • How can I export a ST12 performance trace?

Performance trace collection

Start transaction ST12:

Select the user ID that you want to trace (can be your own user) and leave the ST12 session open. In a second session execute your actions. When you are done, return to the ST12 session and press the End traces & collect button:

Confirm the traces to collect.

Evaluation of traces

On the Collected trace analysis screen section hit the Full screen button:

This will open the easier to use full screen mode for analysis:

Now you can expand the traces and use the ABAP trace, performance trace, SQL trace buttons to launch the required performance analysis tools.

For more background on the tools read the blogs about:

Downloading the trace file

You can download the generated trace file to export to different system or to send to SAP. For example you have recorded the trace in production and want to do the further analysis on the development system.

To export goto transaction ST13 and use tool ANALYSISBROWSER:

Then select menu option Download / Text Download / Export to frontend to download the trace to your desktop or laptop.

Background

OSS background notes on ST12 performance tracing: