The ST12 performance tracing tool allows you to collect performance data for solving a performance issue for a single transaction.
Questions that will be answered in this blog are:
- Which data is collected in a ST12 performance trace?
- How do I execute a ST12 performance trace?
- How do I analyse a ST12 performance trace?
- How can I export a ST12 performance trace?
Performance trace collection
Start transaction ST12:
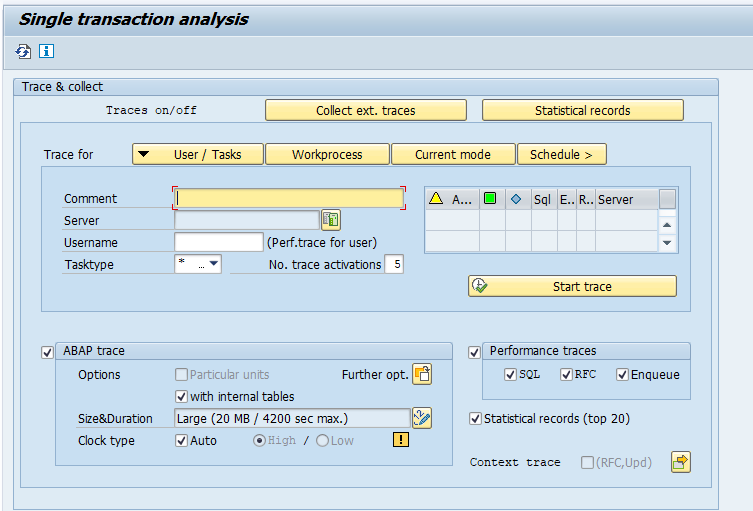
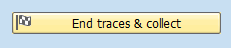
Select the user ID that you want to trace (can be your own user) and leave the ST12 session open. In a second session execute your actions. When you are done, return to the ST12 session and press the End traces & collect button:
Confirm the traces to collect.
Evaluation of traces
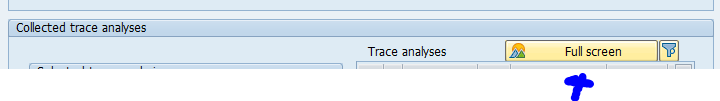
On the Collected trace analysis screen section hit the Full screen button:
This will open the easier to use full screen mode for analysis:
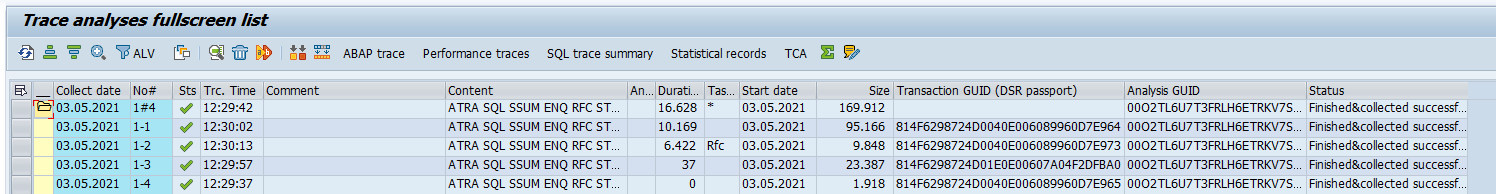
Now you can expand the traces and use the ABAP trace, performance trace, SQL trace buttons to launch the required performance analysis tools.
For more background on the tools read the blogs about:
Downloading the trace file
You can download the generated trace file to export to different system or to send to SAP. For example you have recorded the trace in production and want to do the further analysis on the development system.
To export goto transaction ST13 and use tool ANALYSISBROWSER:
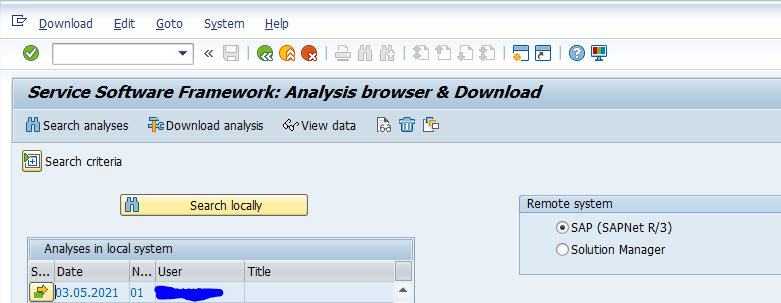
Then select menu option Download / Text Download / Export to frontend to download the trace to your desktop or laptop.
Background
OSS background notes on ST12 performance tracing:
- 2169881 – How to trace background job using ST12
- 2436955 – How to collect and analyze traces using ST12 (single transaction analysis)
- 2524975 – Performance tracing overview: SAT, ST05 & ST12 traces
- 2535415 – ST12 tracing pitfalls – no traces collected
- 2543882 – Sending ST12 trace to SAP for analyses
- 2771272 – Exporting an ST12 trace for analysis
- 2977673 – ST12 trace size is not sufficient
- 3328414 – ST12 trace remains in “Trace collection running…” status and throws dump TSV_TNEW_PAGE_ALLOC_FAILED