System usage: SCMON ABAP call monitor

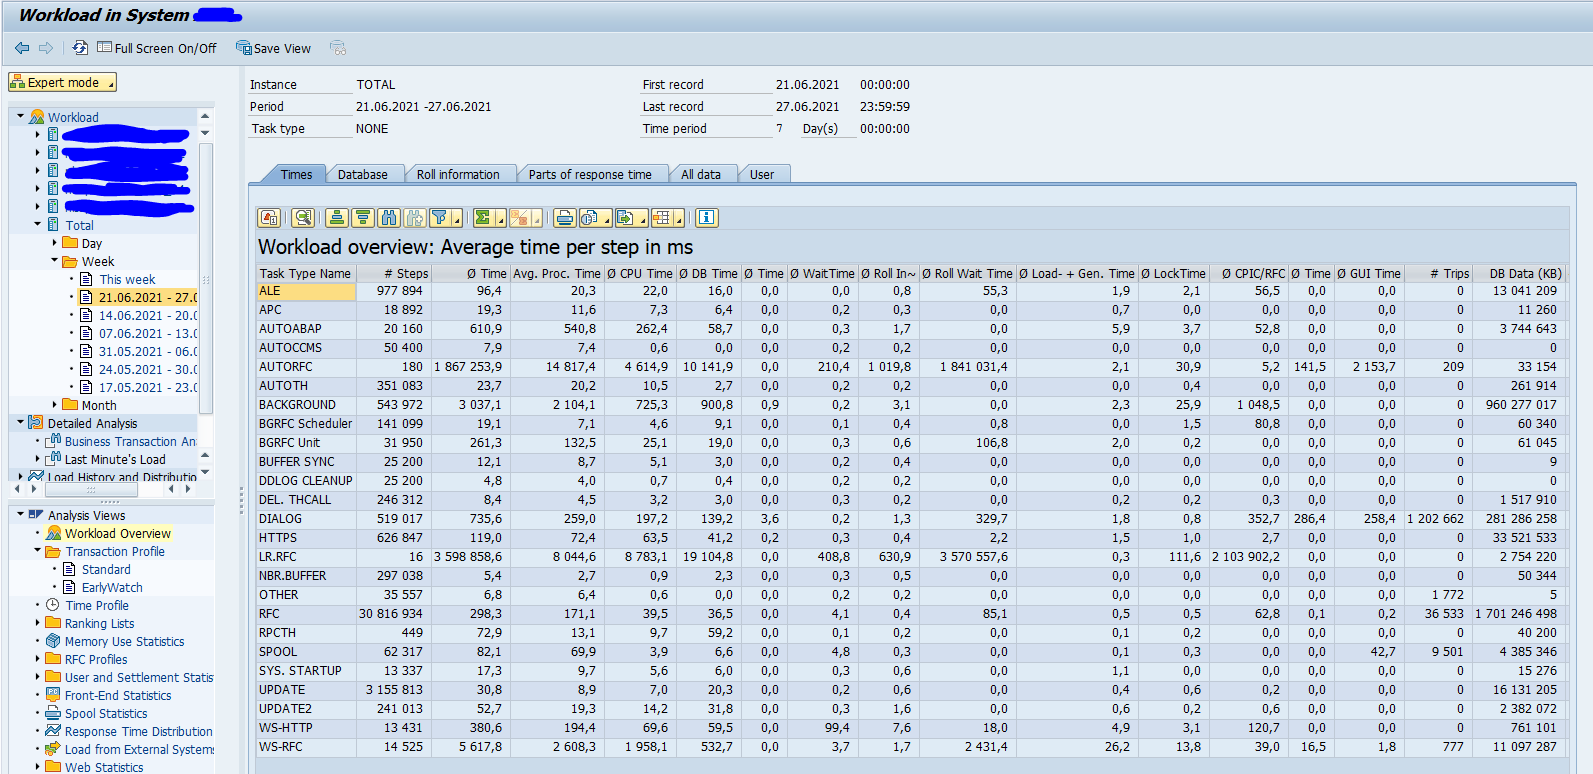
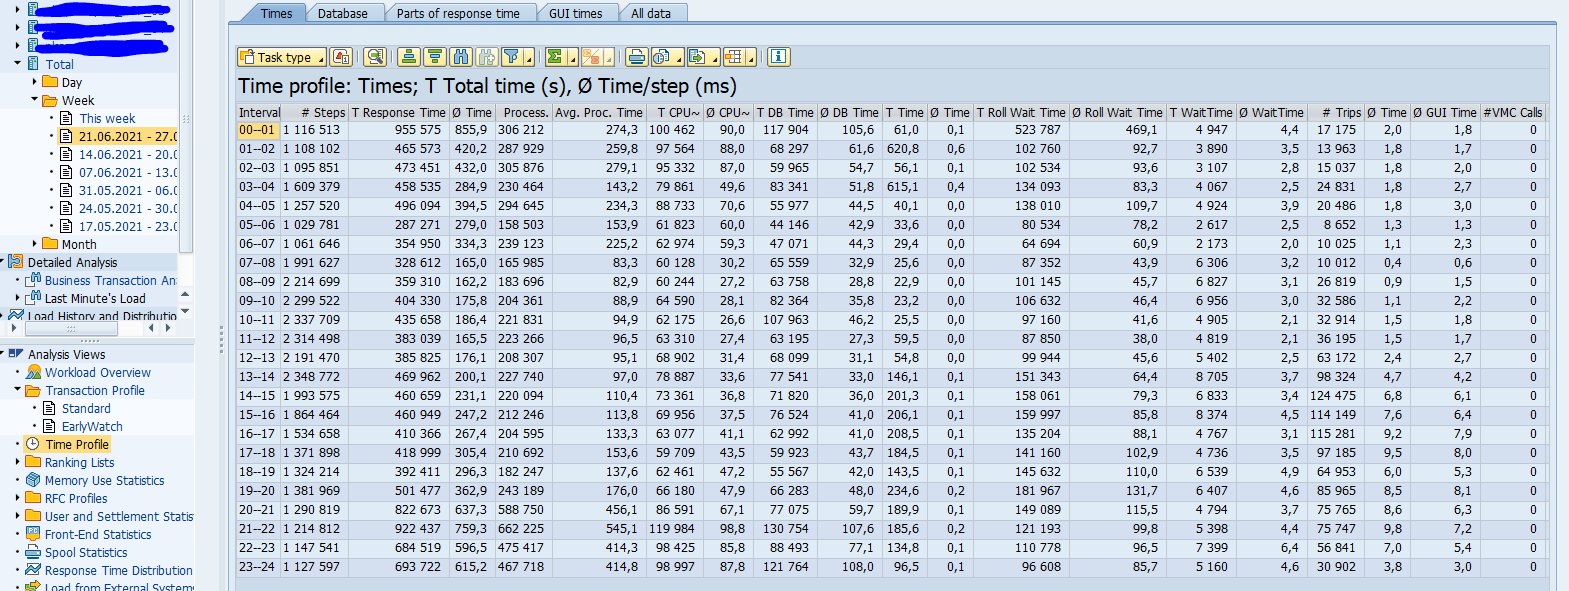
For several use cases you might need to get a more detailed insight into your SAP system. One of the tools is ST03N (read more about it in this blog), but it focuses on transactions. If you need more details on the calling ABAP coding, the SCMON tool might be a better solution. SCMON is the successor of the UPL tool (Usage and Procedure Logging).

Questions that will be answered in this blog are:

  • How to switch on SCMON tool?
  • How to use the results of the SCMON tool?
  • How can I find back from a piece of code to where it is actually used in a transaction, RFC call, ODATA call, etc?
  • What is the impact of the SCMON tool on system performance?

Activation of SCMON

The minimum requirements of SCMON are described formally in OSS notes 1828848 – Usage & Procedure Logging and ABAP Call Monitor: Technical prerequisite (UPL/SCMON) and 2679723 – ABAP Call Monitor, but basically it is available on any supported modern ABAP stack.

Start transaction SCMON:

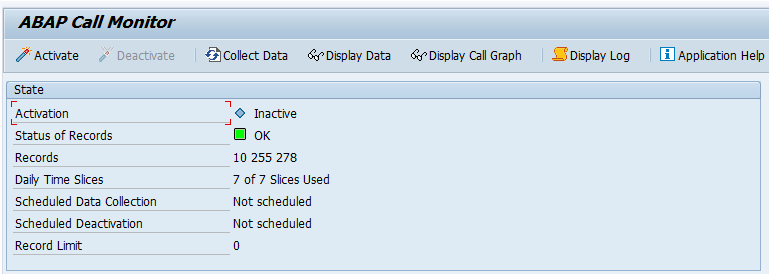
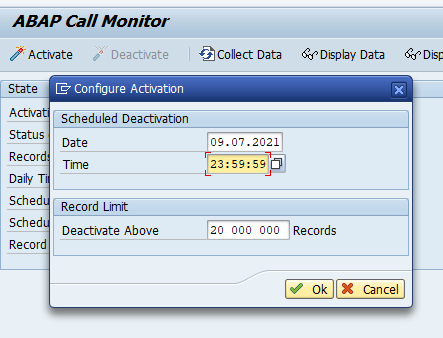
Press the activate button and set the end time settings for the SCMON monitor:

Use of SCMON data

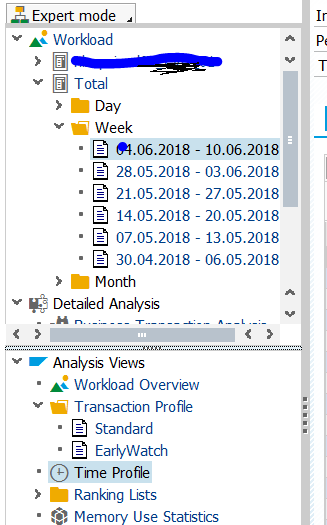
If data is gathered you can already use the results, or you can wait until the data collection time is completed. To display the data start transaction SCMON and hit the Display Data button:

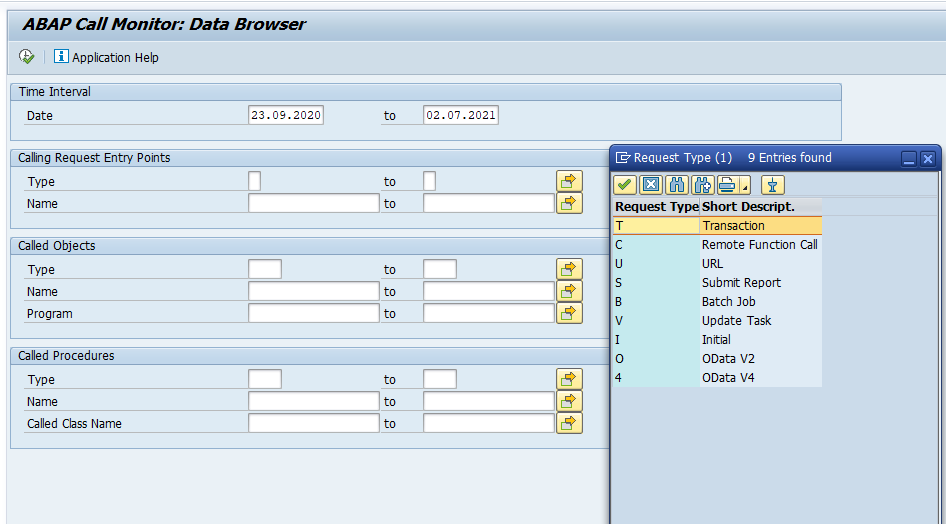
Here you can already see a benefit over ST03N: you can select request type batch jobs, URL, ODATA call, or RFC call next to transaction.

As example we show the result of transaction VA01:

Now you can see in very much detail which ABAP points are called for VA01.

You can also use it the other way around. Suppose we apply an OSS note to class CL_UKM_BUPA_FACTORY and want to determine the impact. If we do a where used list in SE24 on this class we get 134 new calling points and we don’t even know which ones are used.

If we input CL_UKM_BUPA_FACTORY in the CLASS field and search for it, we get this result:

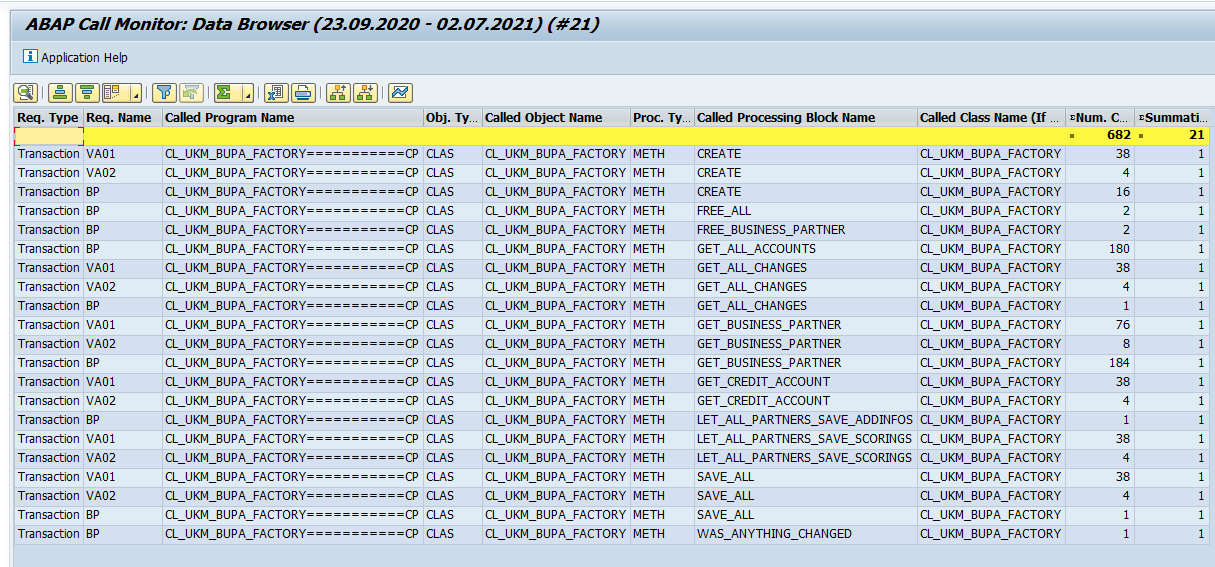
Now you can see that in our system the transactions VA01, VA02 and BP are using this class. Those need to be tested.

This is the big advantage of SCMON: it only takes used code and the code is related back to the start point which you can relate to, like a transaction, batch job, ODATA call, etc.

Performance of SCMON

If you worry about SCMON performance on your production system, it is about the same load as the old UPL. There is a parameter to fine tune performance described in OSS note 2657522 – New profile parameter and improvements for ABAP call monitor.

The exact impact of SCMON on performance is clearly described in OSS note 3098211 – Memory and performance requirements of the ABAP Call Monitor.

Condensing data with SUSG

With transaction SUSG the SCMON data can be condensed. Read more about it in this blog.

SAP background

Background of SCMON can be found in this SAP blog.

Bug fix OSS notes

Bug fix OSS notes that might be relevant for you:

System usage: ST03N

For many different purposes you need insights into your system usage. Which transactions are used and how intensive.

This blog will explain the system workload usage tool ST03N.

The other usage tool SCMON ABAP call monitoring is explained in this blog.

Questions that will be answered are:

  • How to get workload overview from the SAP system?
  • How to get time based profiling information from the SAP system?
  • How to get list of transactions used from the SAP system?
  • How can I quickly download ST03N data with program /SDF/ST03DL?
  • What are the limitations of ST03N?
  • How can I set the data retention for ST03N?
  • Can I check for HTTP usage next to ABAP usage?

Use of ST03N

Start transaction ST03N. In the left pane select the application server or total system and time frame to get an overview of the system workload for the several task types:

With the time profiling you can see the distribution of workload during the hours of the day:

You might see peak hours based on the spread of your users and batch jobs.

In the default system the 24 hours are not visible. Follow the steps in this blog to enable it.

If in ST03N there is no data visible, set parameter parameter stat/level to 1 (Statistical records are active). See OSS note 2675074 – No workload data in transaction ST03N or ST03.

Transactions from ST03N

To get an overview of the user transactions select in the analysis view the Transaction profile:

You can download this overview to xls for further analysis on the transactions used. For explanation on the columns, read OSS note 2778959 – ST03N – Complexity of data displayed in “Parts of response time” tab.

Please be aware of the following limitations from ST03N when making conclusions for system usage:

  • ST03N has limited time frame, some transactions are rarely used, but still vital (like irregularly used repair transactions, basis actions which are rarely done but needed in case of emergencies, year end closing transactions, etc.). See OSS note 1843151 – ST03 Data Retention Time Settings on how to set the retention periods.
  • ST03N does not collect indirectly called transactions in custom code. This means if custom code uses a call transaction XYZA, the transaction XYZA is NOT recorded in ST03N

If more detailed information is required, check the SCMON ABAP call monitoring tool, which is explained in this blog.

Alternative way of downloading ST03N data

As an alternative you can use program /SDF/ST03DL to download ST03N data:

More information about this download program can be found in OSS note 2943445 – Download Historical Workload Data from ST03.

Copying ST03N data to different system

Apply OSS note 2568736 – SAP Readiness Check for SAP S/4HANA – copy ST03N data and follow the instructions to download and upload the ST03N data. This program was primarily developed for the SAP S4HANA readiness check.

Usage of ST03N to determine HTTP calls

You can use ST03N to determine HTTP(s) calls in your system. Read more in this blog.

Usage of ST03N to determine RFC calls

You can use ST03N to determine RFC calls in your system. Read more in this blog.

LR.RFC tasks leading to distorted statistics in ST03

Some LR.RFC tasks may be very high and leading to distorted statistics or wrong interpretation on ST03. You can ignore these high LR.RFC tasks. This is explained in OSS note 3101968 – High response times of LR.RFC tasks in ST03/ST03n.

ST03N data retention

Data retention for ST03N is set in Collector and Performance DB -> Performance Database -> Workload Collector Database -> Reorganization -> Control.

For a full background, see OSS notes 1843151 – ST03 Data Retention Time Settings and 3285517 – Reorganizing and Maintenance of ST03 kernel statistical data.

ST03N bug fix OSS notes

Bug fix OSS notes for ST03N:

ST03N time profiling

If you are running a global system you want to see the usage of the system round the clock. Unfortunately the standard delivery of SAP is summing up the early morning and night hours in the ST03N time profiling.

This blog will explain you how to change this to 24 hours statistics recording.

Questions that will be answered in this blog are:

  • How to switch to 24 hour time profiling?
  • How does the result look like?

General information on ST03N can be found in this blog.

Switching to 24 hour time profiling

To switch to 24 hour time profiling start program SWNC_CONFIG_TIMEPROFILE:

Program SWNC_CONFIG_TIME_PROFILE

Select the Calculate All Hours Separately option and hit the execute button. Done.

The end result

Before you can see the end result you best wait one week for the changed statistics to record.

After 1 week go to transaction ST03N and select the Time Profile option in the expert section:

Time profile selection in ST03n

The end results is a breakdown in all 24 hours:

Endresult

More background information can be found in OSS note 910897 – ST03N: Configuration of the time profile.