This blog will give you tips for improved analysis in the ST22 short dump list.
Questions that will be answered are:
- What is this new button SAP correction notes doing there?
- Detecting Z code in dump?
- How to deal with RFC_NO_AUTHORITY dumps?
- How to deal with CALL_FUNCTION_SINGLE_LOGIN_REJ dumps?
- How to deal with TIME_OUT dumps?
- How to deal with MESSAGE_TYPE_X dumps from program SAPLOLEA?
- How to deal with TSV_TNEW_PAGE_ALLOC_FAILED dumps?
- How to deal with CALL_FUNCTION_BACK_REJECTED dumps?
- How to authorize ST22 details?
- How can I find dumps specific to SAP HANA?
- How to deal with SYSTEM_CORE_DUMPED?
The tips below assume you have not yet any clue on how the dump is created.
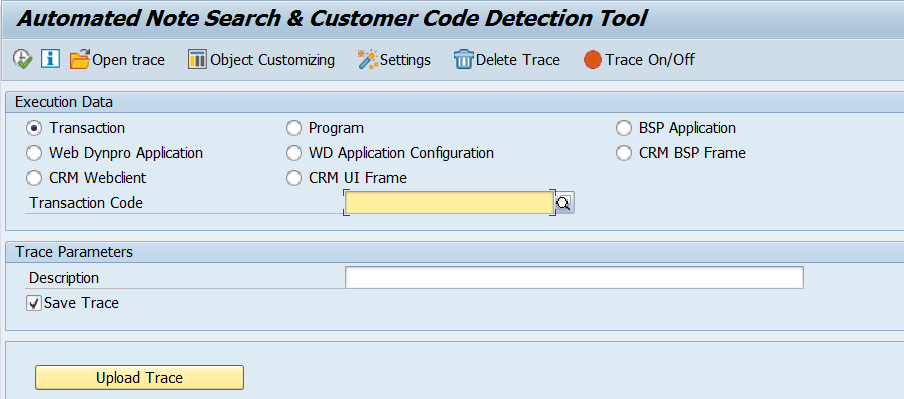
If you know how the dump is created, but cannot analyze from the dump: please read the blog on the ANST tool: automated notes search tool.
SAP Correction Notes button
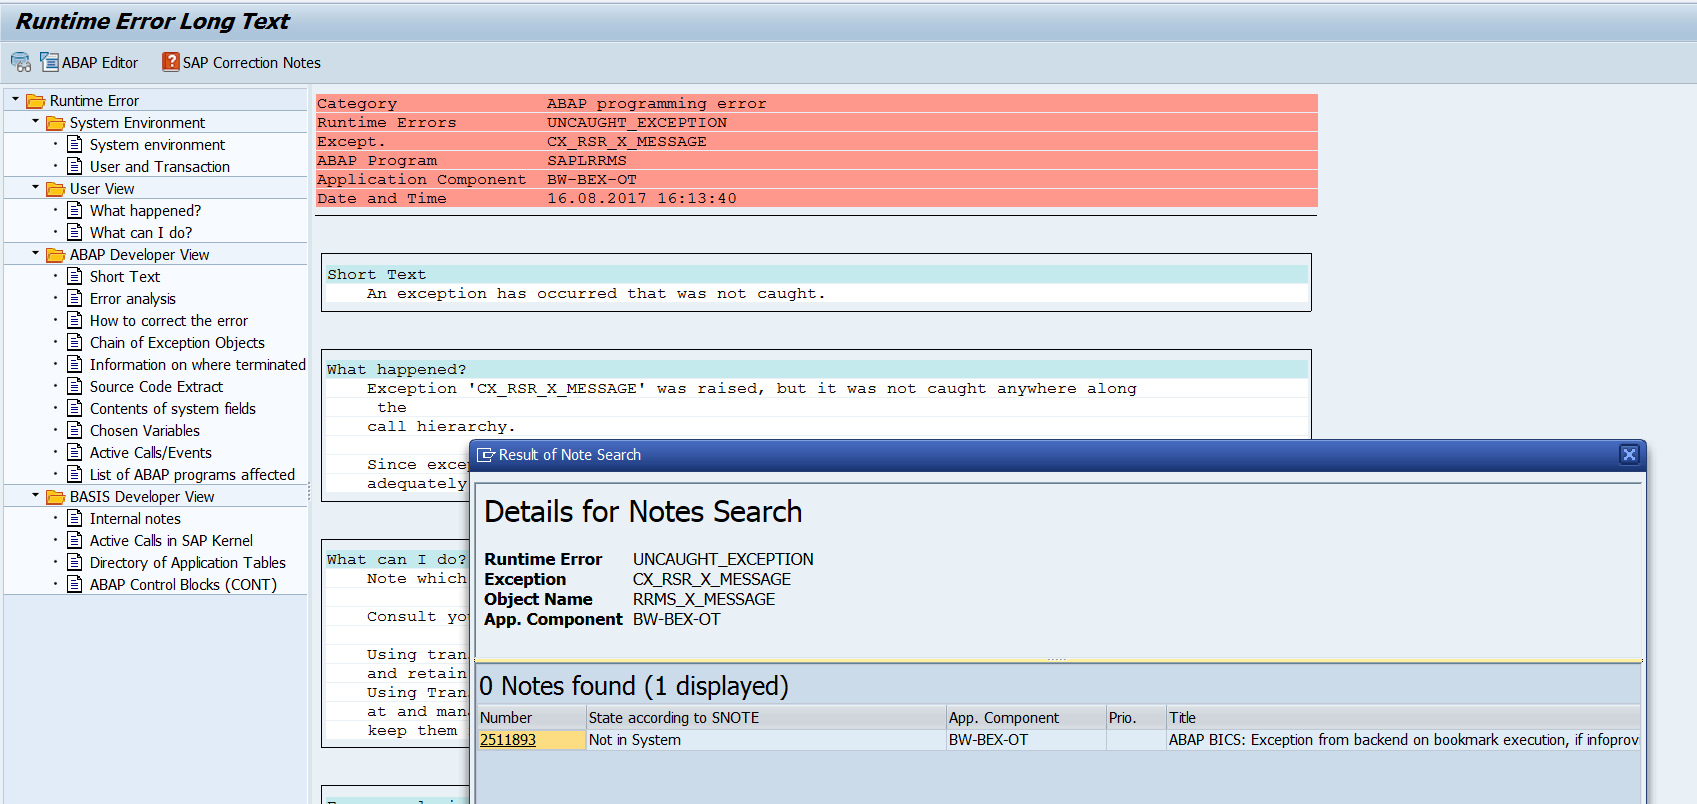
In newer SAP versions for most dumps you can find the SAP Correction Notes button:

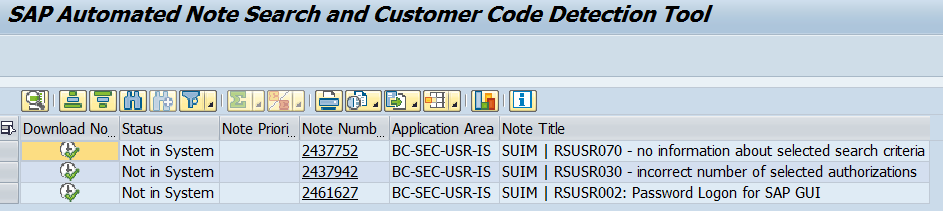
Based on keywords in the short dump SAP will look for known solution correction notes.
The results might be surprisingly accurate:
If you have not setup the new SAP support backbone you will get a connection error:

OSS note 2847665 – OSS RFC Connection fails, which refers to be backbone connection. To solve this issue: follow the instructions from OSS note 2781045 – ANST / ST22 note search “Connection cannot be established” .
If you get the message “Connection cannot be established”, check also fixes mentioned in OSS note 2605397 – ST22 – SAP Correction notes – error: “Unable to extablish OSS connection properly”.
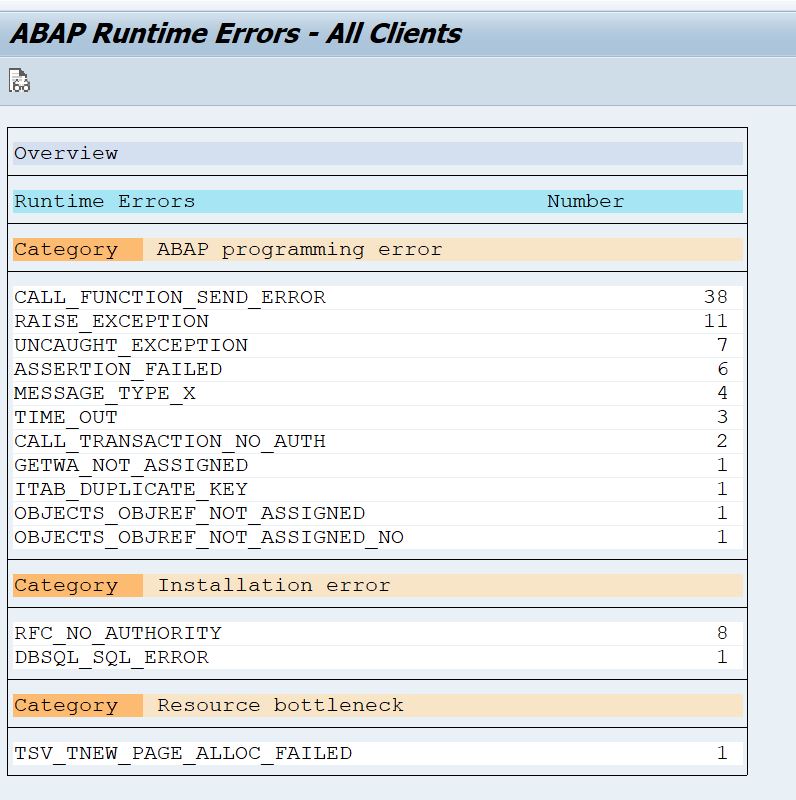
Getting the overview of dumps
After starting transaction ST22 select menu item Goto / Overview. Fill out the dates and you now get the overview including the statistics on the occurrences:
Dumps in HANA environments
SAP keeps a list of ST22 dumps especially for HANA environments: 2399990 – How-To: Analyzing ABAP Short Dumps in SAP HANA Environments. This is a very extensive note.
In HANA based systems you also might get the dump DBSQL_CONNECTION_NO_METADATA. To analyze this dump, read OSS note 2995840 – DBSQL_CONNECTION_NO_METADATA ABAP Dump in ST22.
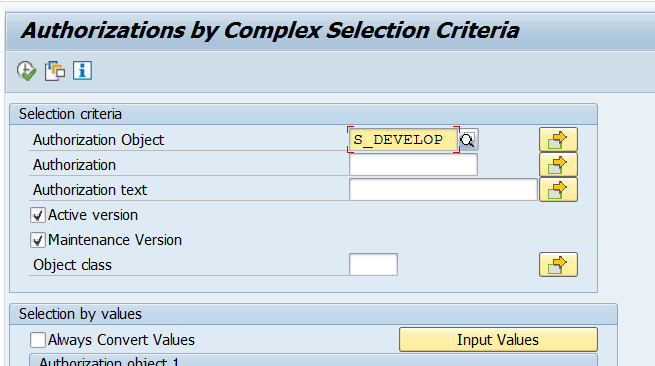
ST22 dump analysis authorizations
All the new ABAP stacks (as of 7.54) have the option for more fine grained ST22 authorizations. Please read OSS note 2792743 – Change in Authorization Check of ABAP Dump Analysis in release SAP_BASIS 7.54/7.77 – Authorization Object S_ABAPDUMP.
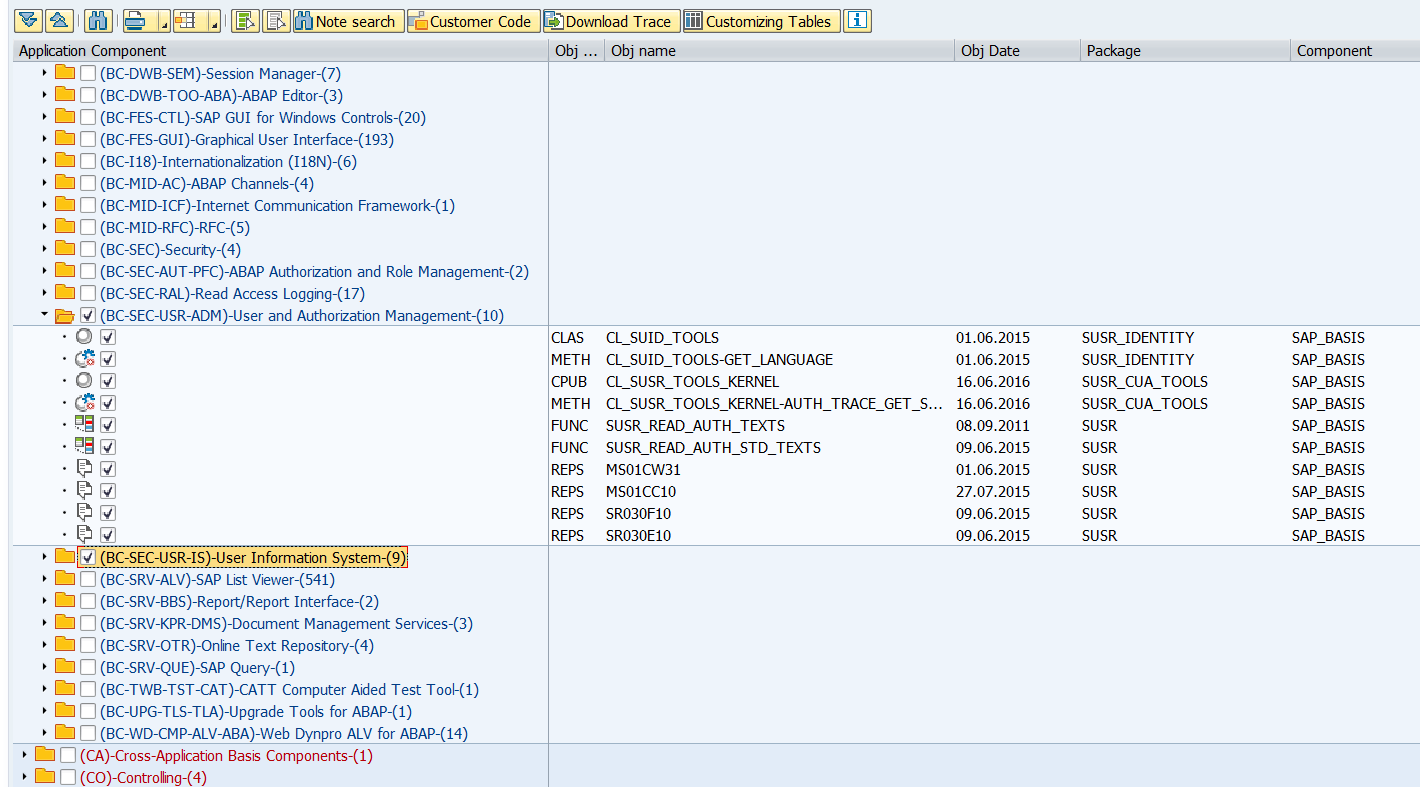
Detecting Z code in a dump
Detecting Z code in a dump is normally easy if it is a Z program. Some dumps you can have due to the fact that Z code is there in a user-exit, which again is calling SAP code. This dump will appear as looking 100% standard SAP, but when you scroll down in the Call Stack you will see Z code:
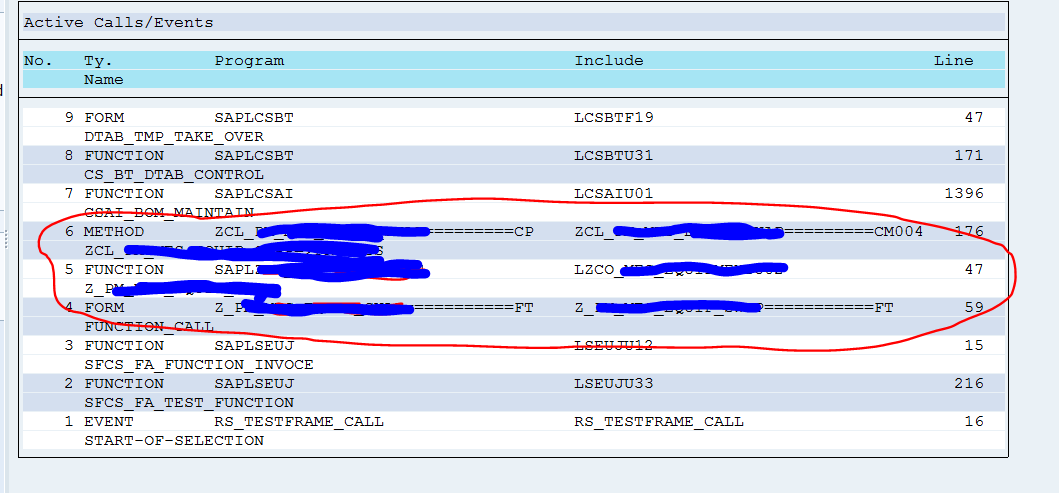
Before raising OSS message to SAP: make sure the call stack does not contain custom Z code.
RFC_NO_AUTHORITY dump
The RFC_NO_AUTHORITY is special kind of dump and typically looks like this:
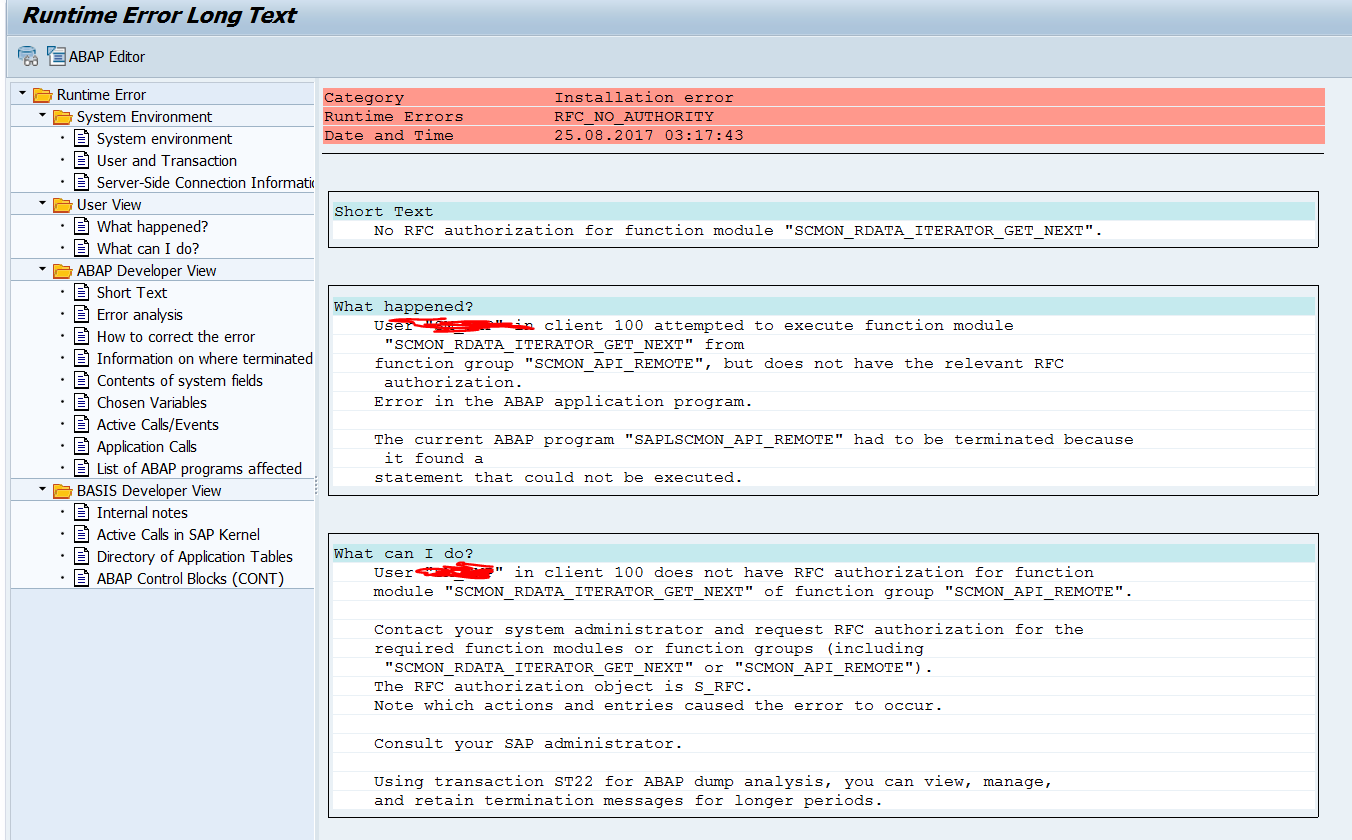
First thing to get from the dump is the user ID and the calling system (is it an internal call or call from different system). And if the user ID is a human user or system user.
Second thing to determine is: is this a valid call or not a valid call?
In case of valid call, look in the dump which authorization is missing and what needs to be added. If the addition is done: do keep an eye on the dumps, since a new dump might come for a different new authorization object.
In case of an invalid call, you need to determine how the call was initiated and take action to avoid the initiation. This is not always a simple job.
Why is checking this dump important? Complete business flows might be disrupted if this happens. It is hard to detect for the end users what is going on. It will take them time to raise an incident and for functional people to determine what is going on. This way a lot of valuable time can be lost.
What can also happen: people try to connect via RFC methods to read data. This will give lot of dumps which are hard to follow up.
If you get too many of these dumps and you can’t solve them, you can switch parameter rfc/signon_error_log to value -1. Then the dumps are no longer there in ST22, but in stead moved to SM21 system log with less detail. If you need to have the details again, switch the parameter again (it is dynamic). Background on the parameter rfc/signon_error_log can be found in OSS note 402639 – Meaningful error message texts (RFC/Workplace/EBP).
CALL_FUNCTION_SINGLE_LOGIN_REJ dump
A bit similar to the above dump is the CALL_FUNCTION_SINGLE_LONG_REJ dump. Here a user tries to login via RFC to the SAP system, from a different SAP system, or from a JCO based connector.
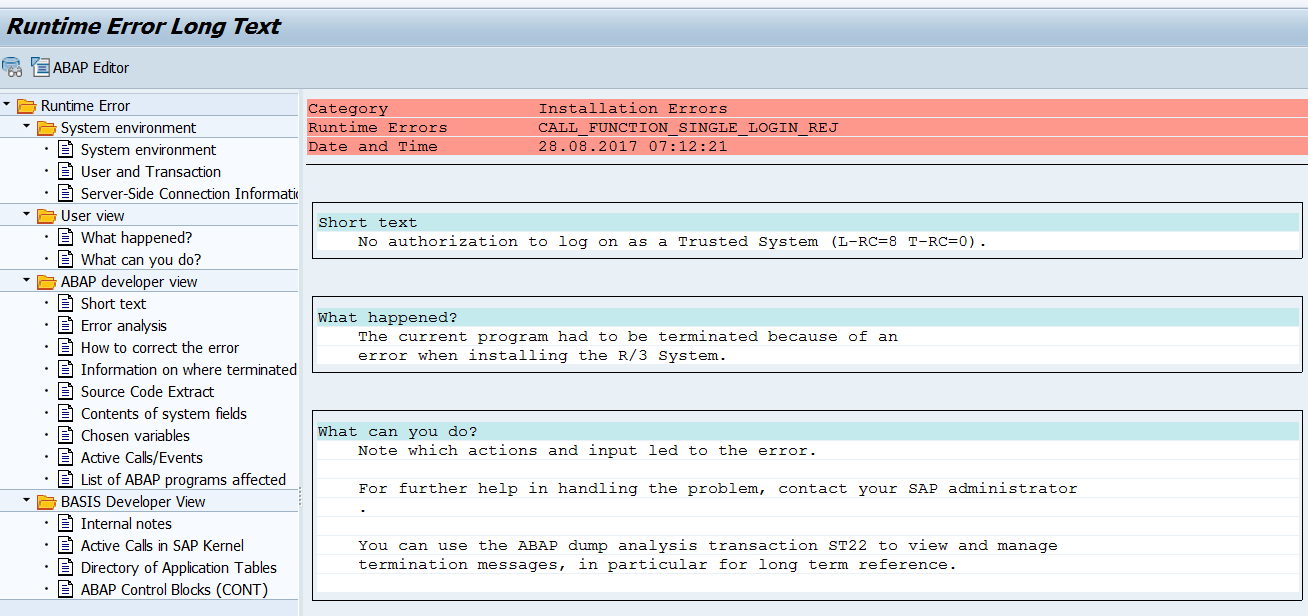
Again: first determine if the call is valid or not. If not valid, determine the calling source (can be hard!).
If it is a valid call, scroll down in the details section for this dump and look for the part below:
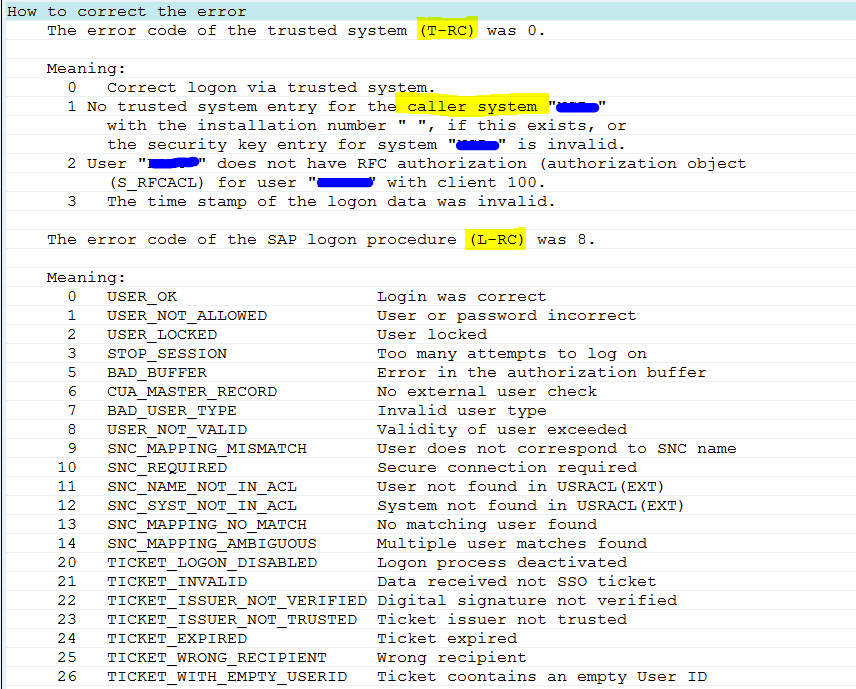
There are two codes: T-RC code and the L-RC code. Check both the codes. In this case above the user ID validity was no longer ok.
Depending on the codes different solution needs to be applied.
Why is checking this dump important? Complete business flows might be disrupted if this happens to system user. If it happens to single user he might get grumpy. It is hard to find for the end users what is going on. It will take them time to raise an incident and for functional people to determine what is going on. This way a lot of valuable time can be lost.
TIME_OUT dumps
If an online query takes longer than the timing set in parameter rdisp/max_wprun_time a TIME_OUT dump will happen. By default and best practice, this time out parameter is set to 10 minutes. This is also the case in most system.
This dump will look like:
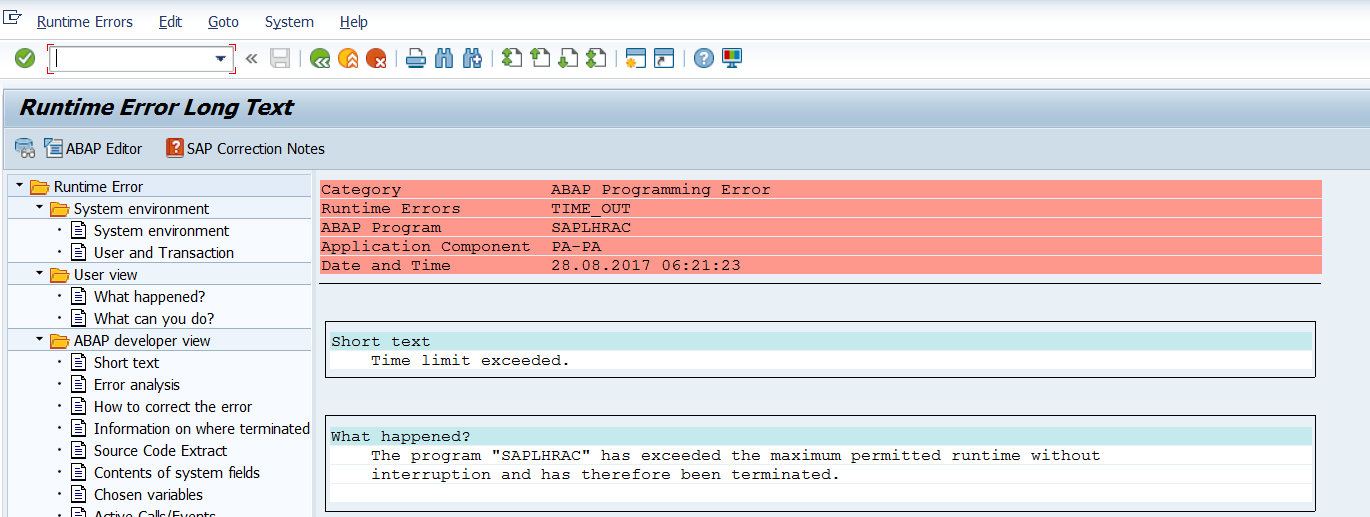
If you scroll down (or click in the left section) to the User and Transaction section, you can see the ID of the user who caused this and the transaction.
First reaction of the average basis person is: call/mail the user and ask him to run this in batch mode. This is indeed one of the solutions.
Alternative potential solutions:
- Analyze with the end-user if he can fill out more selection criteria (hence reducing the time needed to select the data)
- Analyze with the end-user if he can run the report in multiple smaller sets
- Check if there are known performance OSS notes for the transaction the user is running (the root cause might simply be an SAP bug)
- Check if the database statistics of the tables queried is up to date
- In some cases both the selection criteria are ok, and the output of the list in batch only give a few results: in this case the creation of special index might be the solution. This can happen in case of check reports that look for business exceptions.
Why is checking this dump important? Users tend to get very frustrated by the system if they hit this dump. They have to wait 10 minutes and have no result. Sometimes you see this dump a couple of times in a row. Imagine yourself being the user with a boss demanding report which crashes after 10 minutes…
MESSAGE_TYPE_X dumps from program SAPLOLEA
The MESSAGE_TYPE_X can be pointing to very serious issue. But the ones generated by program SAPLOLEA point towards one type: the SAP GUI server interaction.
This dump typically look like this: a main dump MESSAGE_TYPE_X and calling program SAPLOLEA.
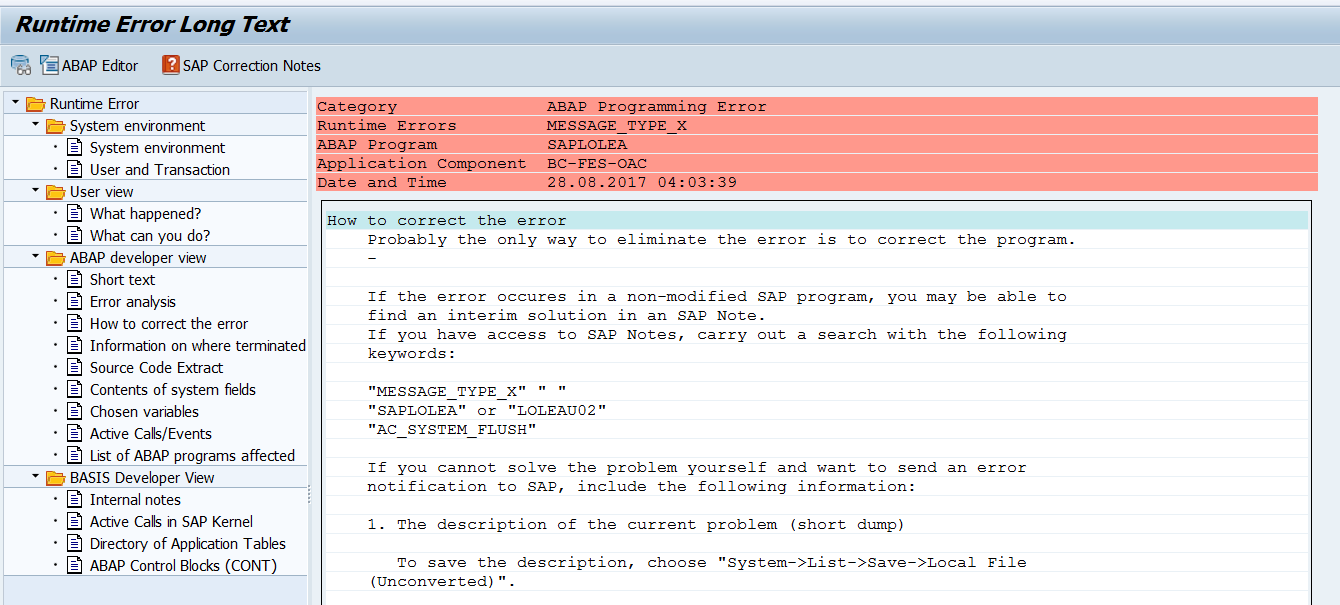
This dump can have 3 main root causes:
- Issue in ABAP code (hit the SAP correction notes button to search for solutions)
- Issue in local SAP gui installation of the end user
- Issue in the SAP kernel
If you see many dumps with the same user ID: this typically points towards an old local SAP gui installation. Solution is to update the local SAP GUI for that user to the latest version that is supported in your company.
In rare cases the SAP kernel causes these kind of dumps. These are hard to find and detect. The only remedy here is to update the kernel at regular intervals.
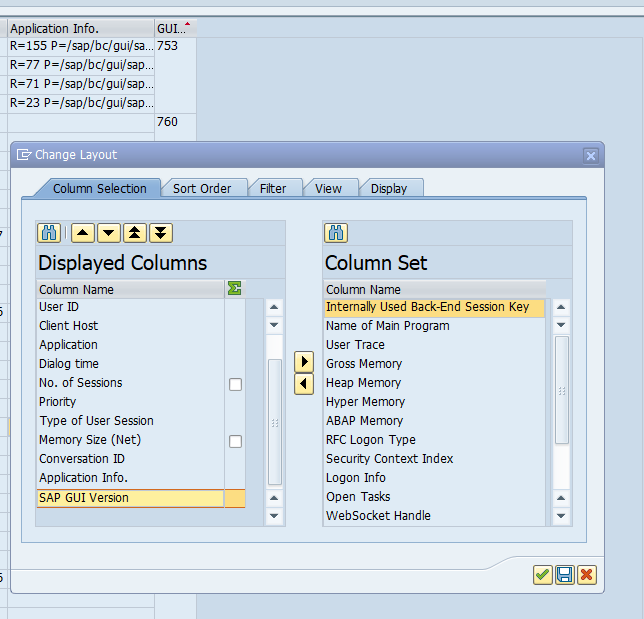
To find which users use which SAP GUI version: go to transaction SM04 and add the field SAP GUI version:
From ABAP code: use function module TH_USER_LIST to get list of sessions. The GUI version is in the field GUIVERSION of output table USRLIST.
For more background on SAP GUI patching read this dedicated blog.
TSV_TNEW_PAGE_ALLOC_FAILED dumps
This type of dumps can have 2 main root causes:
- Way too many data is selected
- System is not properly tuned
For the second case read OSS note 2180736 – TSV_TNEW_PAGE_ALLOC_FAILED for and extensive description on what to check and update on basis level.
Known TSV_TNEW_PAGE_ALLOC_FAILED dumps:
Exception condition “SINGLE_EXIT_MULTIPLY_ACTIVE” triggered dumps
This dump can happen when you are upgrading system or converting a system to S4HANA. The dump itself has text RAISE_EXCEPTION. But in the details you the SINGLE_EXIT_MULTIPLY_ACTIVE. The issue is a duplicate BADI implementation where only one is allowed. Check in the dump which BADI and start transaction SE19 to remove the duplicate.
SYSTEM_CORE_DUMPED dumps
SYSTEM_CORE_DUMPED are very low level system dumps. Read OSS note 2162346 – SYSTEM_CORE_DUMPED on ST22 : How to analyze it on how to analyze them.
CALL_FUNCTION_BACK_REJECTED dumps
These dumps are caused by missing callback positive listing. See OSS note 2981184 – What to do in case of CALL_FUNCTION_BACK_REJECTED short dump. The solution is to add the function module to the positive list in RFC. In no way reduce the RFC security by lowering the RFC callback security parameter rfc/callback_security_method. Read this blog on how to hack using callback RFC, and why not to lower the security.
HTTP_NO_MEMORY dumps
Too many concurrent HTTP sessions are opened. Most likely solution is to increase parameter icf/max_handle_key. See OSS notes 2327822 – Internal session terminated with runtime error HTTP_NO_MEMORY or HTTP_MAX_CONN_EXCEEDED and 3433597 – “Unknown parameter icf/max_handle_key, a check cannot be performed” when add profile parameter in RZ10.
Folder dumps
Dumps related to GUI folders:
- 357693 – Redundancy avoidance in Easy Access
- 362883 – Easy Access: Error when expanding folders
- 1603032 – Dump with MESSAGE_TYPE_X in SAPLOLEA and AC_SYSTEM_FLUSH and LOLEAU02
Coding and table generation dumps
Dumps can happen due to coding and tables not generated properly. When it happens during transport import, it is normal. If it persists after the import, you need to act. Best practice notes:
- 1567187 – [Best Practice] How to solve LOAD_TYPE_VERSION_MISMATCH
- 2296826 – [Best Practice] How to solve dump LOAD_PROGRAM_CLASS_MISMATCH
- 2385757 – [Best Practice] How to solve dump LOAD_PROGRAM_INTF_MISMATCH
- 2386365 – [Best Practice] How to solve dump TYPELOAD_NEW_VERSION
- 2559989 – [Best Practice] How to solve dump LOAD_PROGRAM_TABLE_MISMATCH
Dump clean up
Dumps can be cleaned up with program RSSNAPDL. For more background on this program see oss note 1995777 – Dump deleted within a short period of time ST22.
Check these 3 notes as well:
- 3429292 – Improve system logging for deletion of runtime error short dumps
- 3550273 – Managing and Modifying Cleanup of Short Dumps
- 3580567 – Improve labels on selection screen of RSSNAPDL (Delete Short Dumps)
Remove 28 day limit for keeping short dumps
Note 3020638 – Short dumps cannot be kept more than 28 days explains the 28 days limit. Applying note 3022767 – Remove implicite deletion of short dumps older than 28 days removed the limit.