SQLM SQL monitor

This blog will explain about the SQLM tool to monitor expensive SQL statements in a productive environment.

Questions that will be answered are:

  • How to start and configure the SQLM tool?
  • How to analyze the results?

Configuration of SQLM tool

The SQLM tool does not require specific configuration or installation if you have a bit modern SAP system. To activate it start transaction SQLM and click on the Activate button for All Servers:

The trace is active now until the given time frame.

Example use of the SQLM transaction

First we start by writing a very bad performing Z program:

This program is really inefficient. After activation of the SQLM monitoring we run this program a few times.

Now we goto the SQLMD transaction (or from SQLM and then press display data button) to display the SQL monitoring results:

Selection can be done on total number of executions, execution time, amount of records. Result:

You see now the impact of our badly written program. Double click on the line will jump to the ABAP code point.

Creating snapshots

At the bottom of the SQLM start screen there are the buttons to create snapshots:

This results into the Snapshot screen:

You can create a snapshot here for later re-use. You can also download the snapshot to a different system by using these buttons: first export to file:

When you have the file, goto the target system and start SQLM and press create snapshot. Now use the option Create with Data Source File Import.

It is common practice to capture data in production by a basis administrator who exports it. Then the data download is handed over to an ABAP developer using the data as upload in SQLM database in the development system to improve poorly performing Z code. The developer can use the SWLT tool (see blog) to combine the SQLM data with the static code review data taken from the ATC tool (see blog).

Follow up use in SWLT

The SQLM data can be used as input in the SWLT tool: SQL performance worklist tool. This tool combines the SQLM data with the ATC tool results. Read more about SWLT in this blog.

Background information

More background information can be found in OSS note 1885926 – ABAP SQL monitor and 3242700 – ABAP SQL Monitor: Implementation Guide and Best Practices.

Useful blog (which is start of blog series on SQLM): link.

Impact on performance and memory is minimal. Description is fully documented in OSS note 3100598 – Memory Requirement and Performance Impact of the SQL Monitor.

OSS notes

Relevant OSS notes:

SAT ABAP runtime analysis for ABAP web applications

SAT ABAP runtime analysis is a great tool for analyzing performance issues. This tool can also be used to analyze ABAP web dynpro and FIORI applications. For more background on SAT tool itself, read this blog.

Questions that will be answered in this blog are:

  • How to run SAT tool for ABAP web applications?

Running SAT tool for ABAP web applications

Start transaction SAT, and press the button Schedule in the block For User/Service.

You now reach the measurement overview screen:

Now select the Schedule Measurement button. In the next screen fill out the user to trace and very important: switch the object type to URL and process type to HTTP:

Do not press the schedule measurement button yet. First go to the ABAP web application to the part you want to measure for performance. Afterwards delete the browser, since it will keep on sending data.

No you have to go back to the SAT start screen and click on the tab Evaluate:

Double click on your measurement line. The system will now read the measurement log files and process them. This can take some time. The end result screen looks again like a normal SAT result screen:

SAT ABAP runtime analysis

The SAT ABAP runtime analysis tool can be used to identify performance problems in ABAP programs.

Questions that will be answered in this blog are:

  • How to run the SAT tool?
  • How to read the results of the SAT tool?

Starting the SAT tool

The SAT ABAP runtime analysis tool can be started with transaction SAT:

Top left there is a Tips & Tricks button. This will bring you the to the following tool:

Here you can compare the optimal and not optimal way of coding. By hitting measure runtime button you can actually compare in real time the difference between the 2 methods.

The performance issue program

To test the tool, we first write a simple test program:

REPORT zperftest2.

DATA: zlt_vbak TYPE TABLE OF vbak.
DATA: zls_vbak TYPE vbak.
DATA: zlt_vbap TYPE TABLE OF vbap.
DATA: zls_vbap TYPE vbap.
DATA: zls_vbap2 TYPE vbap.

SELECT * FROM vbak INTO TABLE zlt_vbak UP TO 100 ROWS.

LOOP AT zlt_vbak INTO zls_vbak.
  SELECT * FROM vbap INTO zls_vbap.
    DO 10000 TIMES.
      zls_vbap2 = zls_vbap.
    ENDDO.
  ENDSELECT.
ENDLOOP.

Now we start the SAT tool, enter the program name. Make sure the tick box evaluate immediately is on and press Execute.

Now the measurement will start.

Result of the trace tool

The result of the trace tool is as follows:

On the left side you see the split in where the program spends it time. Here you can see that most of the time is spend on internal processing and not on SQL statements. SQL statement can be analyzed from the SAT tool or from the ST05 SQL trace tool.

By double clicking on the the internal access the right hand side of the screen is filled. Here you can see in which code blocks the most net and gross time is spent. It does not always point you to the exact statements that are not ok, but it can point you to the program that is causing the biggest delay.

In our case the DO 10000 TIMES loop is the performance killer. With only SQL tracing this cannot be found.

Runtime analysis for web applications

For runtime analysis for web applications, read this dedicated blog.

Relevant OSS notes

Check and if needed you can apply these OSS notes to solve bugs in the SAT tool:

ST05 SQL performance tracing

Performance issue solving is an important job for ABAP and basis consultant. One of the helpful tools is ST05 SQL performance trace tool.

Questions that will be answered in this blog are:

  • How to switch on ST05 SQL trace?
  • How to read the results from the ST05 SQL trace?
  • How to use the ST05 SQL trace with multiple application servers?

The test program

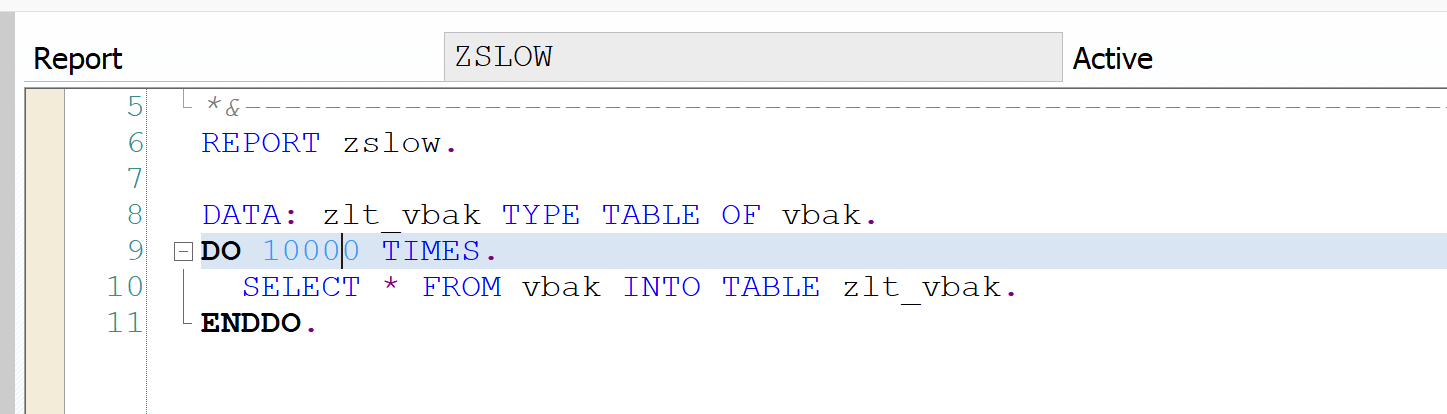
First we create a small test program for our performance analysis.

REPORT zperftest.

DATA: zlt_vbak TYPE TABLE OF vbak.
DATA: zls_vbak TYPE vbak.
DATA: zlt_vbap TYPE TABLE OF vbap.
DATA: zls_vbap TYPE vbap.

SELECT * FROM vbak INTO TABLE zlt_vbak UP TO 1000 ROWS.

LOOP AT zlt_vbak INTO zls_vbak.
  SELECT * FROM vbap INTO zls_vbap.
    DO 10 TIMES.
      CALL FUNCTION 'BAPI_MATERIAL_EXISTENCECHECK'
        EXPORTING
          material = zls_vbap-matnr+0(18).
    ENDDO.
  ENDSELECT.
ENDLOOP.

Off course this program is written very badly to be really slow and making performance issues.
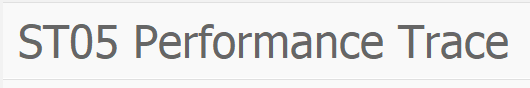
ST05 SQL trace

Start the ST05 SQL trace tool with transaction code ST05.

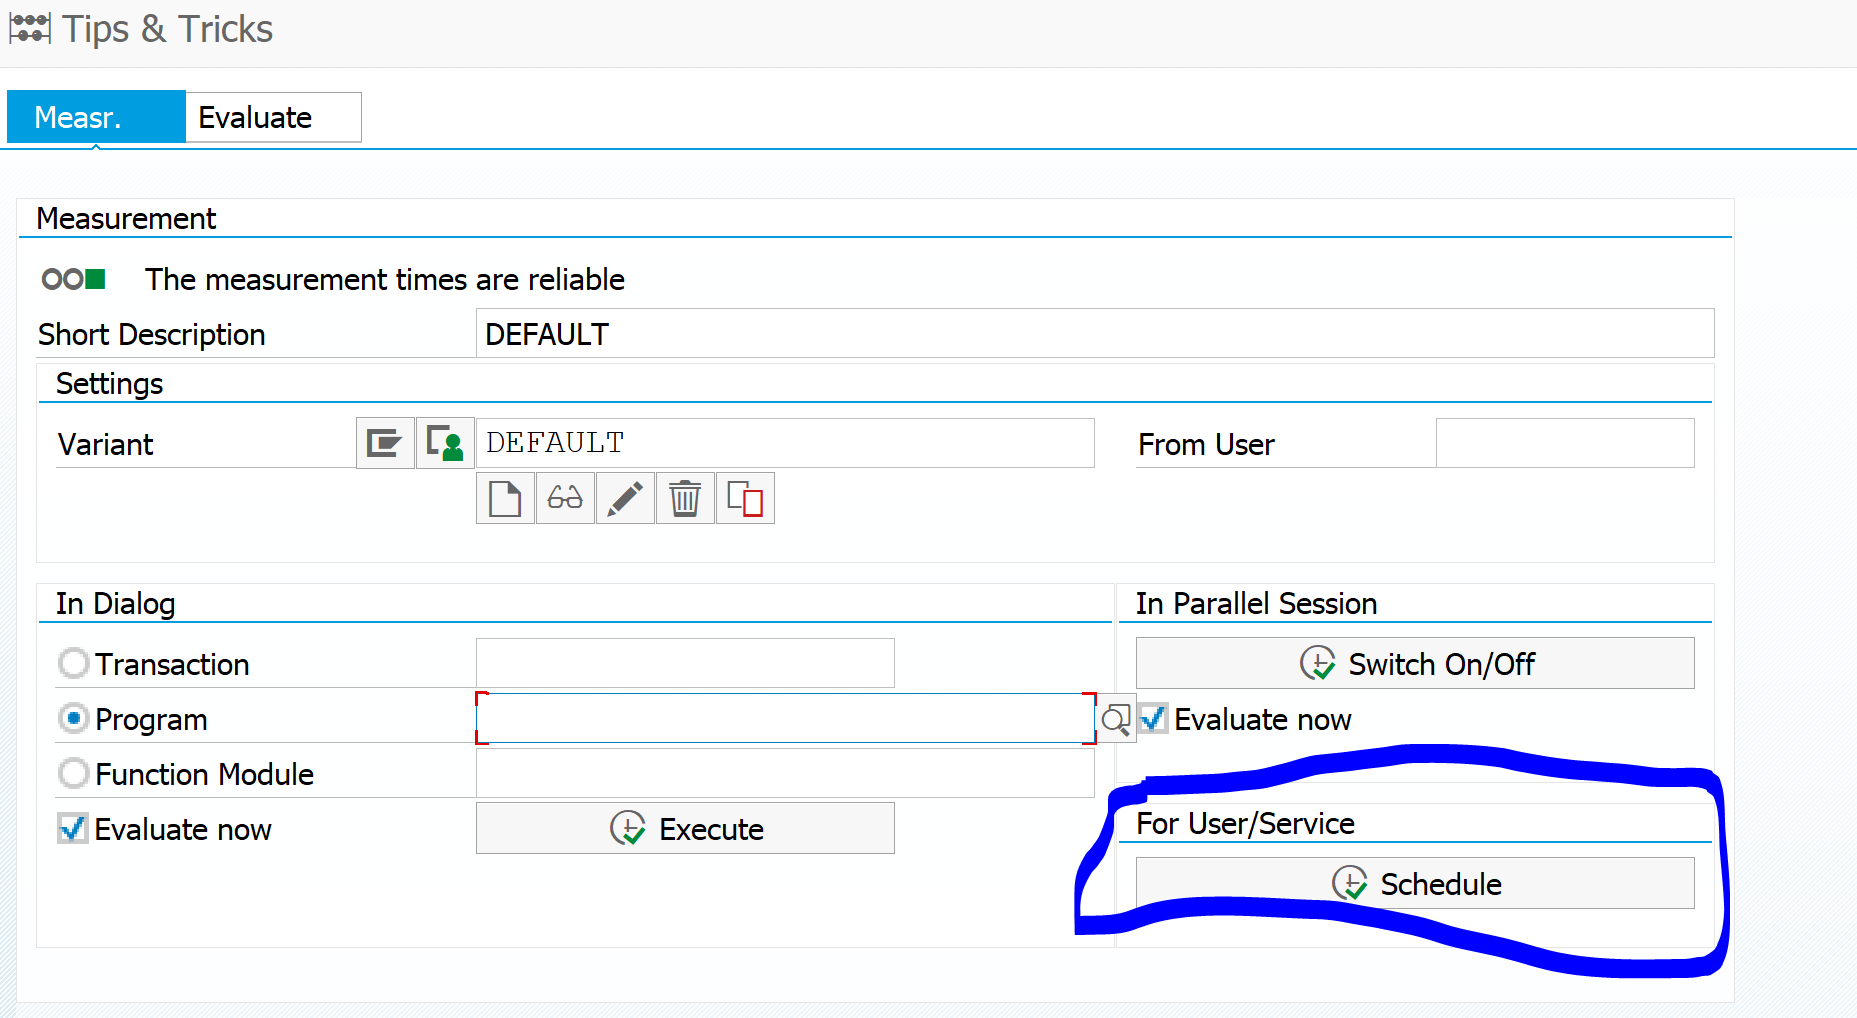
You can activate the trace for all users with the button Activate trace. But this is usually not needed and will only give you a long trace to analyze.

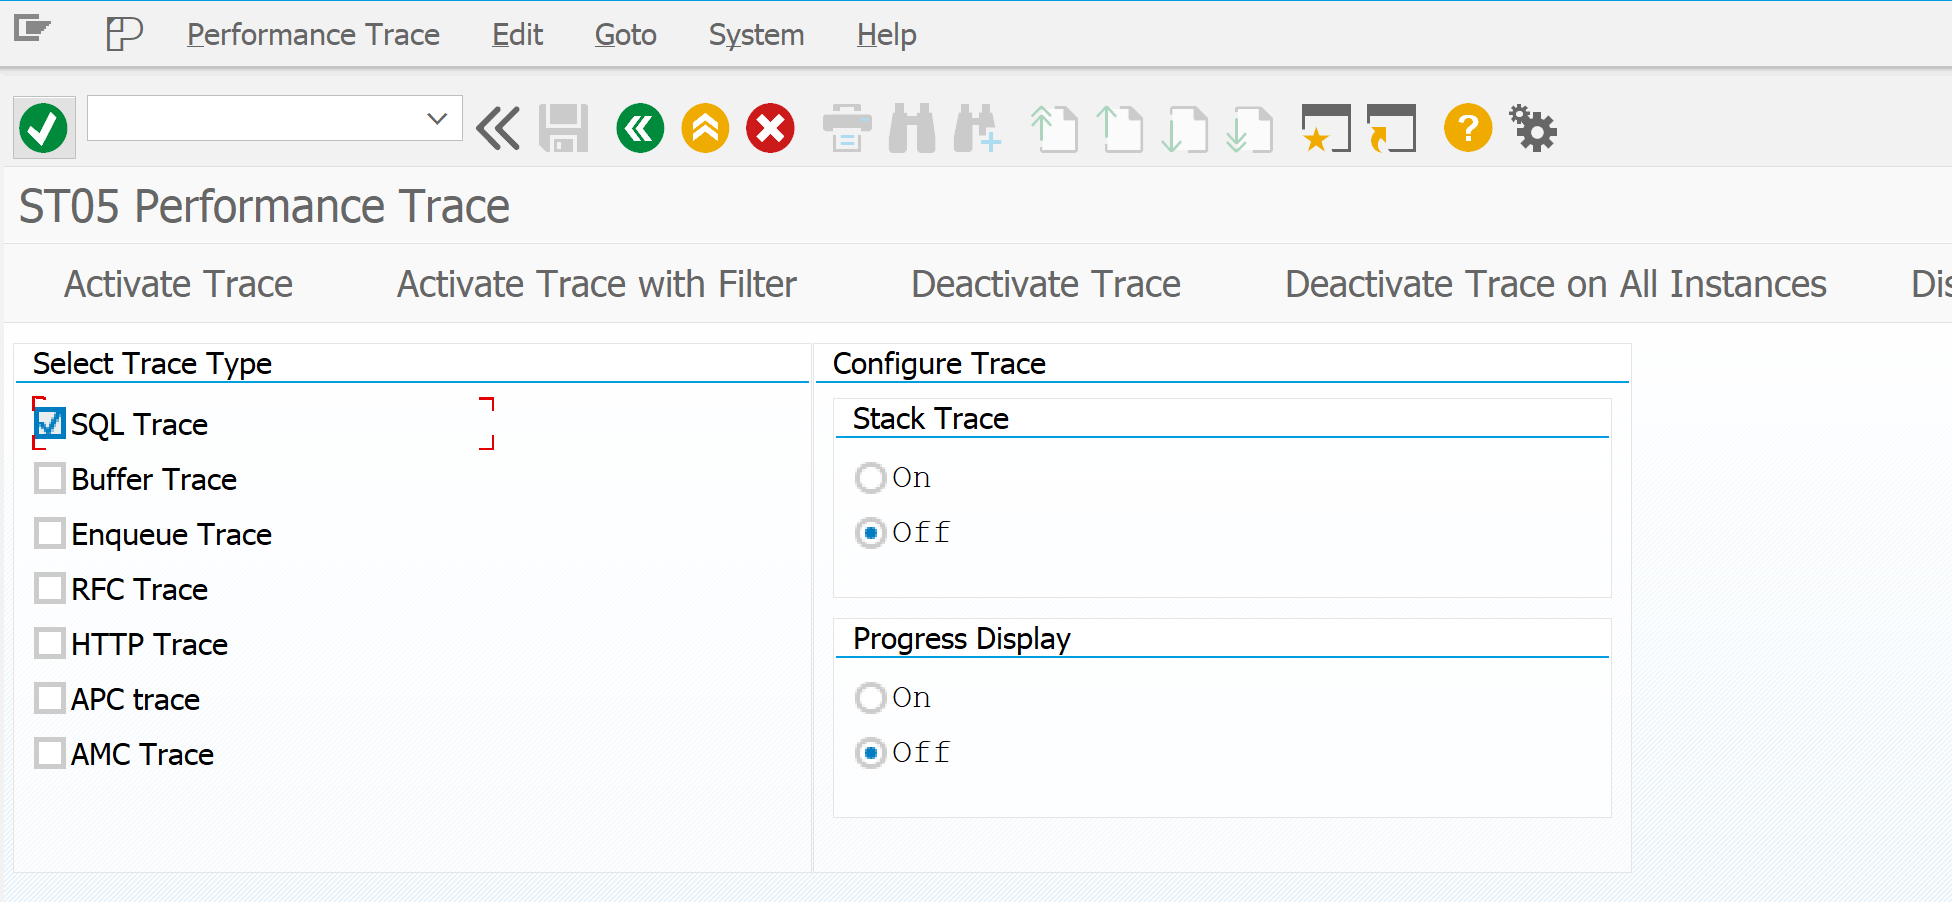
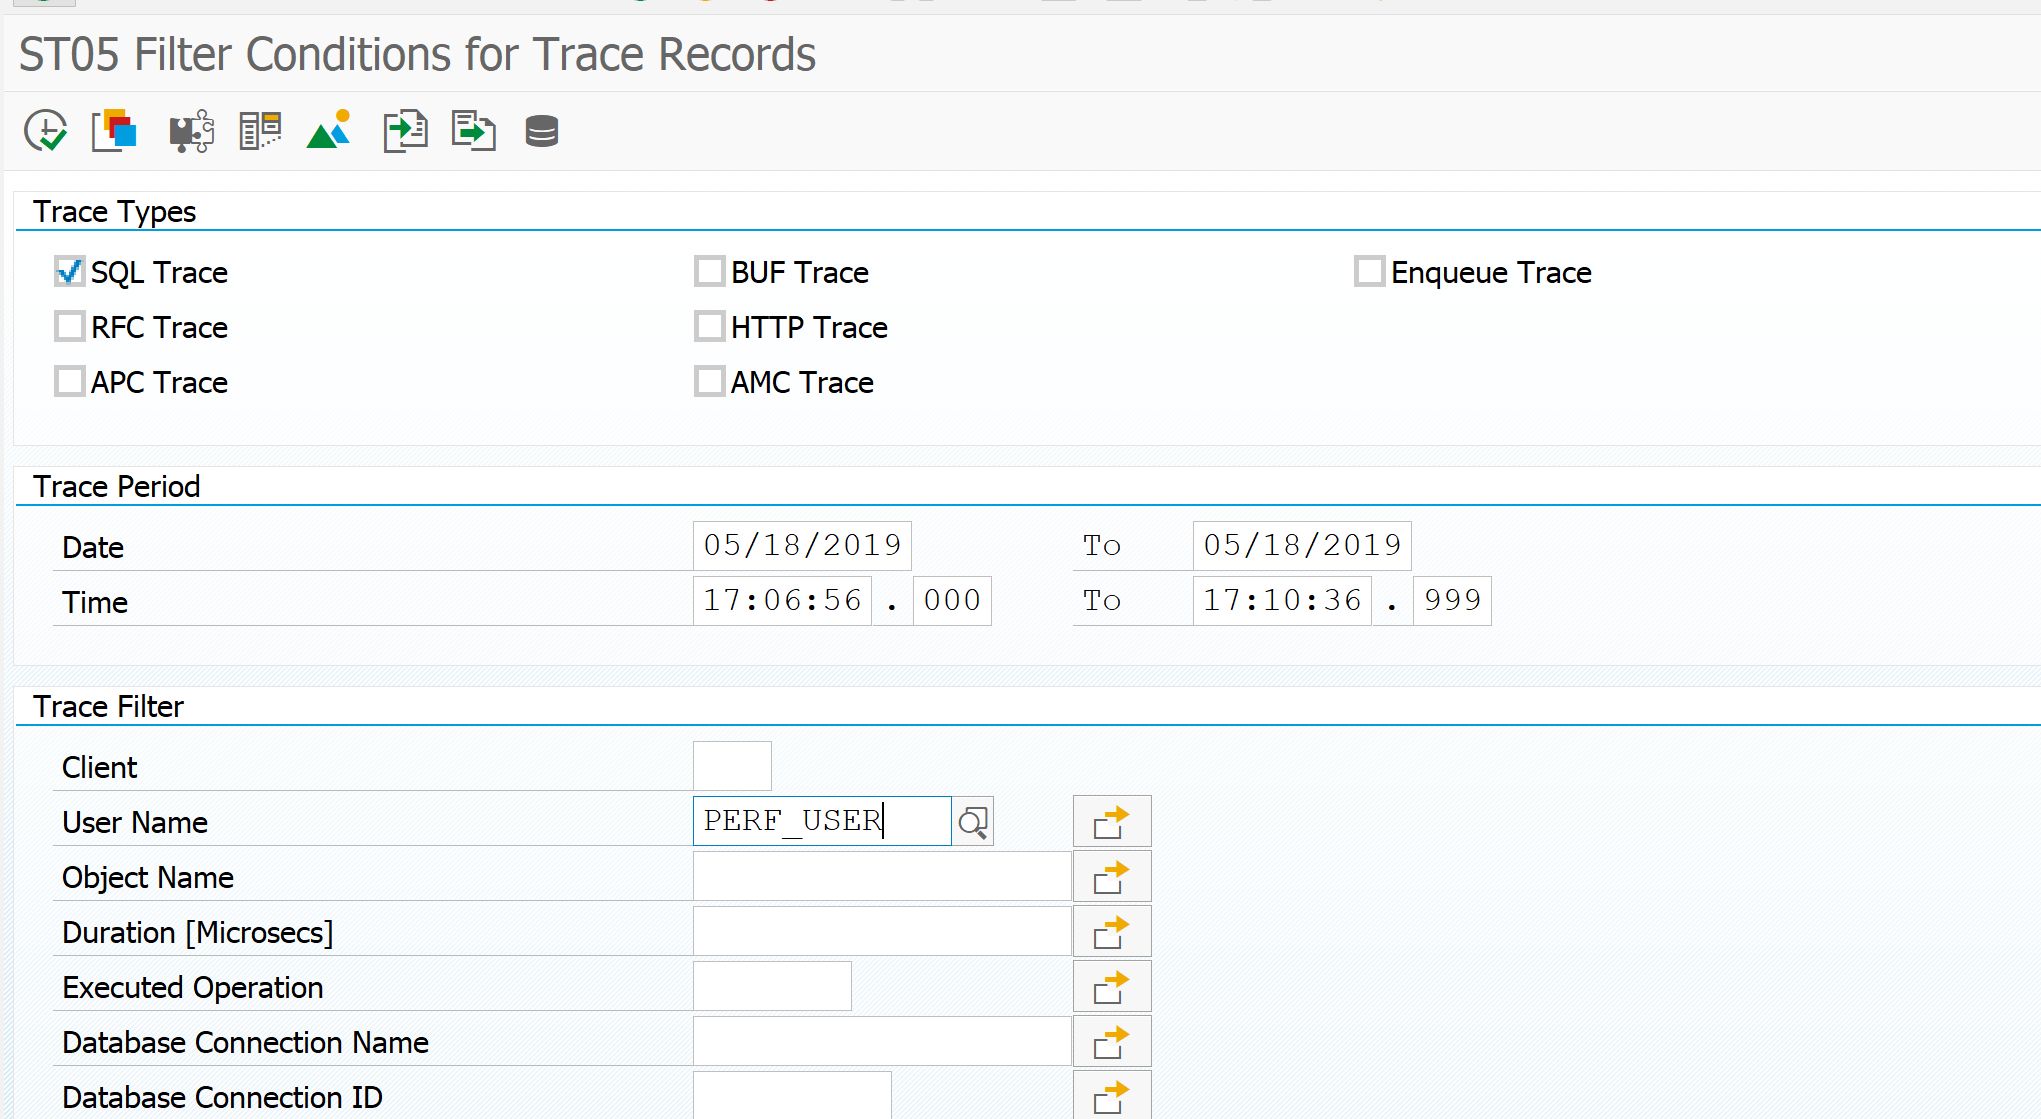
The usual method is to activate the trace with a filter, mostly on user name to trace a specific user action:

If the authorization team already started on ST01 authorization trace, you cannot start the SQL trace. First stop the ST01 trace. 

Now you can start the performance test program in a different session. Just wait until it is finished. It is important the user you are tracing is only doing this action and does not perform any other action, since these other actions are also recorded and will make the analysis harder to read.

When completed go back to the ST05 and click Deactivate trace.

Trace analysis based on duration

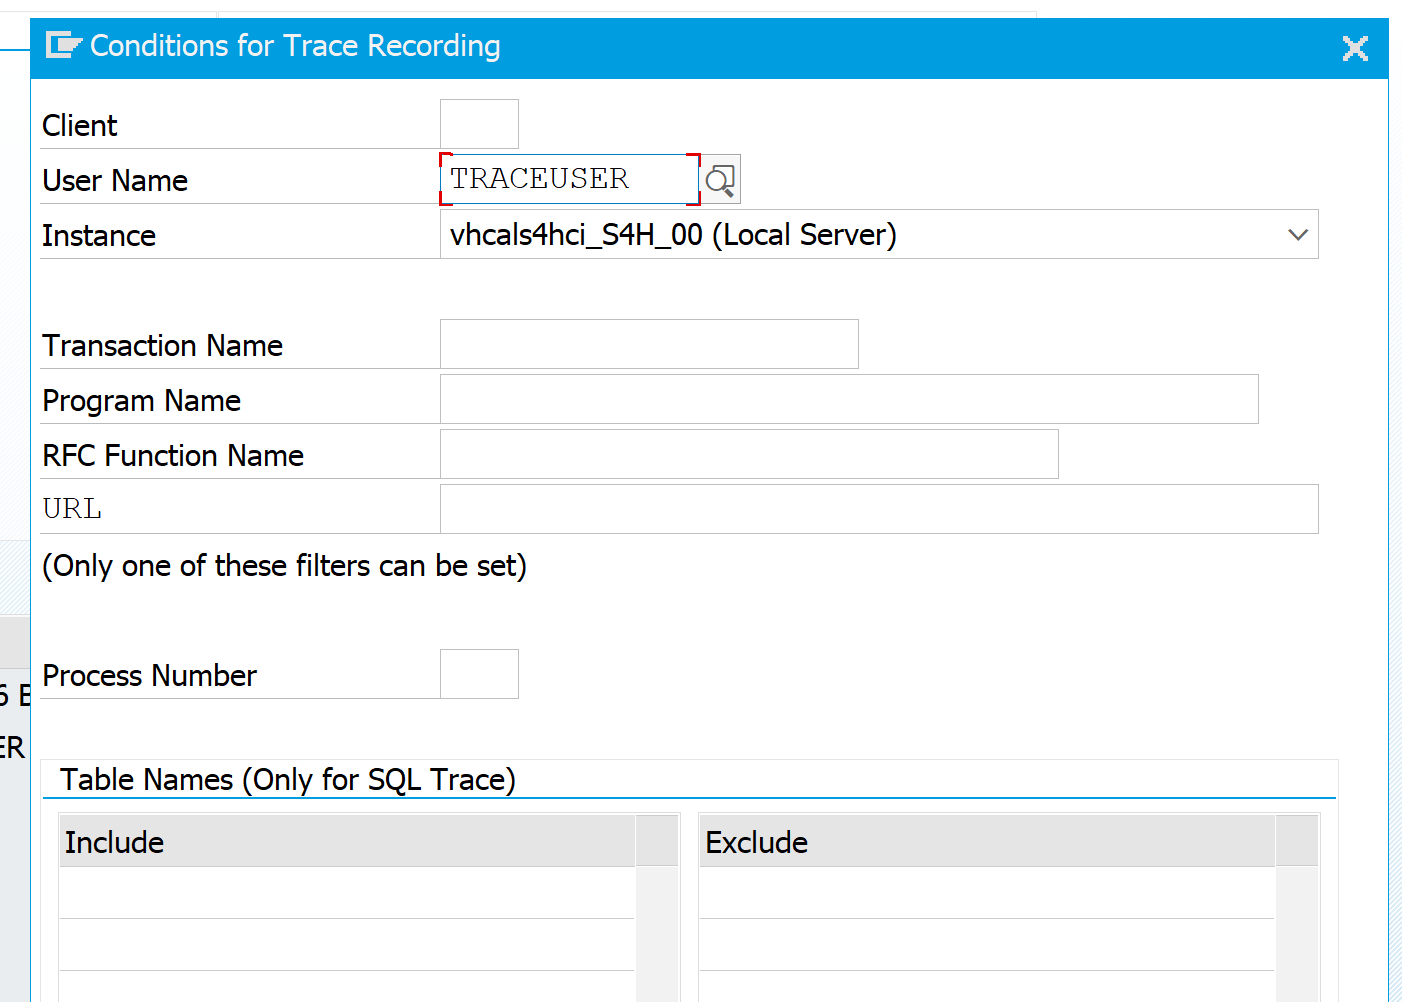
Now press the Display trace to see the results. If your trace is large you will get this screen:

This is quite common and click yes. If your result is really too big, change the 5000 on the first screen in to a good maximum, or try to record a smaller time frame.

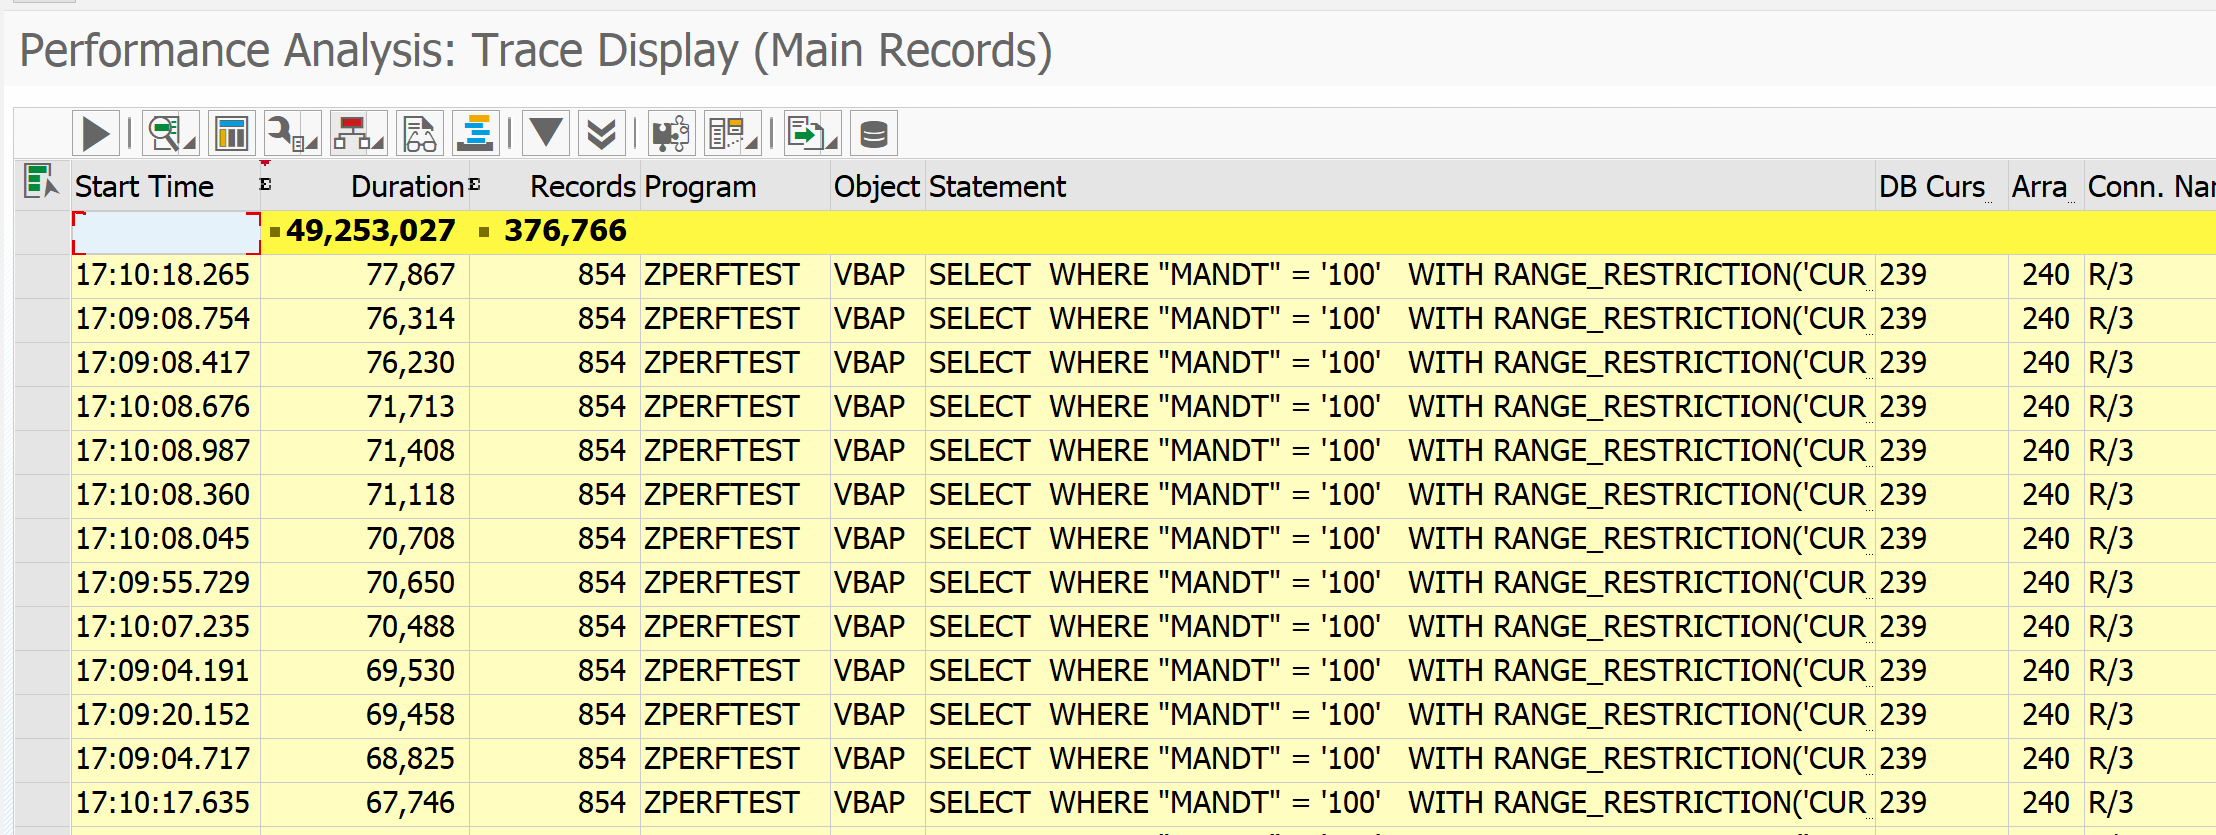
Result now looks like this after sorting on the column duration:

You can see that the total SQL commands took 48 seconds in total. The longest SQL single command took 78 milliseconds (which is very fast, so long running SQL’s are not the issue in this example).

In your case you might find very large single SQL commands. By selecting the line and pressing the button Display ABAP call location, you can jump to the place in the coding that fired the SQL command.

Summarized trace analysis

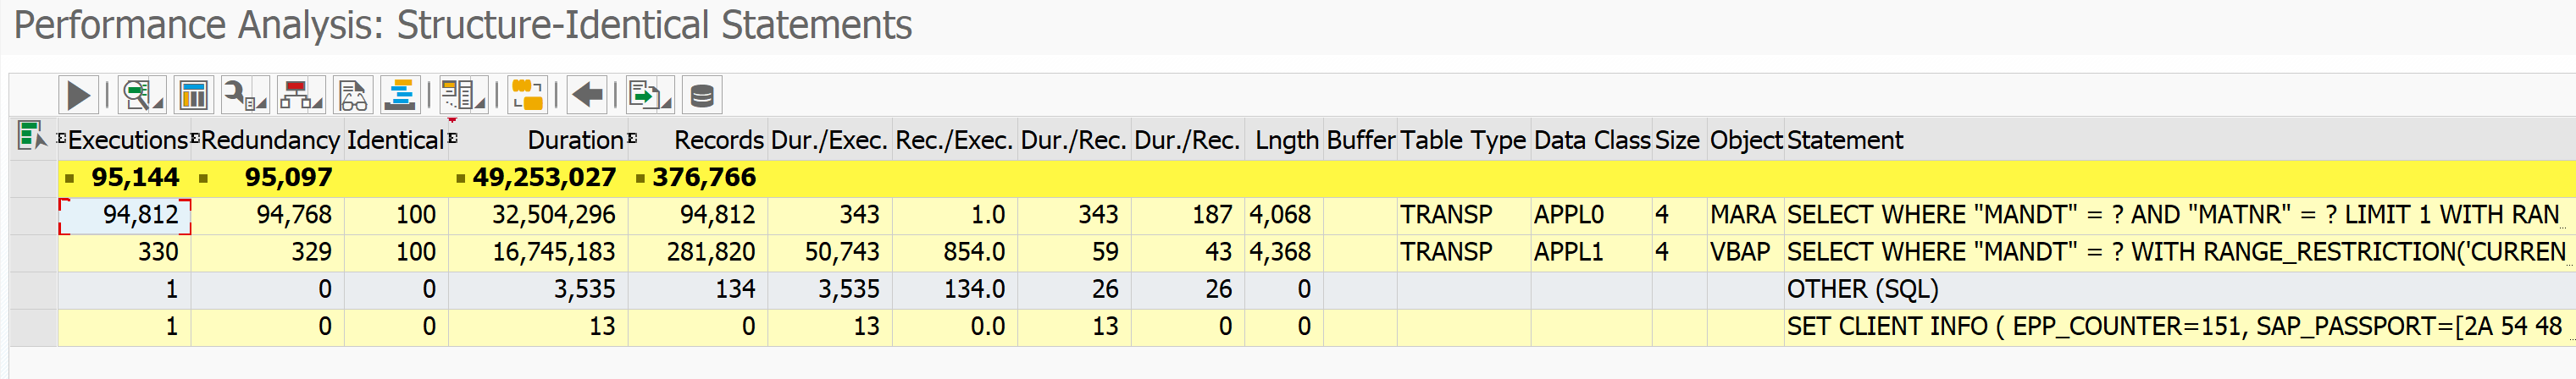
Since we have many records and many small ones, we need to use the summary tools. In the trace analysis select menu path Trace and then Structure Identical statements. This will give the following surprisingly short overview:

In the third column you can see that there are 100 identical calls, and also a high number of redundant calls.

If you now click on the second line to the ABAP call position you jump to our badly performing program and see that the majority of the delay is coming from the do 100 times loop. The first line is coming from standard SAP in the BAPI call.

This happens in real live as well that not all calls will point you into the right program. You might have to check multiple lines to find the right program causing the issue.

Multiple application servers

Development systems normally have only 1 application server. Productive servers can have more. If you have to analyze a performance issue directly on production with ST05, you have to be aware that the performance trace is per application server. If needed, you can select in ST05 as specific server, or you can select all. The trace display is still per server.

Relevant OSS notes

Notes to check or to apply:

Oracle statistics update

If you are having performance issues, of if you have done intensive data archiving or technical cleanup in your system running on Oracle, you need to consider the Oracle statistics. Without proper statistics the performance of your system will be sub-optimal or even bad.

Questions that will be answered in the blog are:

  • How to run Oracle index statistics update?
  • How to use the update as part of technical cleanup?

Oracle index statistics update

To run the Oracle index statistics update, go to transaction SE38 and start program RSANAORA:

RSANAORA start screen

To redo the statistics of an index fill out the table and index in the format: table~index. In this example the main index (0) of table BALDAT is chosen: BALDAT~0.

Run the update and wait for it to be finished:

After RSANAORA run

Repeat this for every index defined in your system (lookup in SE11, button Indexes).

Runtime will depend on the amount of entries in the table and the type of infrastructure. Test on acceptance system before running in productive server.

Index run for almost empty tables

If your table is empty or almost empty you can also run RSANAORA with the option Alter index rebuild online. This will speed up read performance for that table index.

Regular runs

If you have setup regular technical clean up jobs as explained in this blog, you can opt to schedule a last step in the clean up job the update of the statistics program RSANAORA. This will ensure best performance while it will hardly cost you time.

Index monitoring

Oracle has a function called index monitoring to check if indexes are used at all.  You can use it to delete non-used indexes. See OSS note 105047 – Support for Oracle functions in the SAP environment.