SMENQ: new SAP enqueue management transaction

When you have installed and activated SAP enqueue server 2 (this will happen when you move to S4HANA), the transaction SMENQ is available to manage lock entries. This replaces transaction SM12.

Questions that will be answered in this blog are:

  • Where to find more information on SAP enqueue server 2?
  • What are the new functions in SMENQ?
  • How to solve lock overflow issues?

SMENQ transaction

When you start SM12 you see that a new button SMENQ is available if you have activated SAP enqueue server 2:

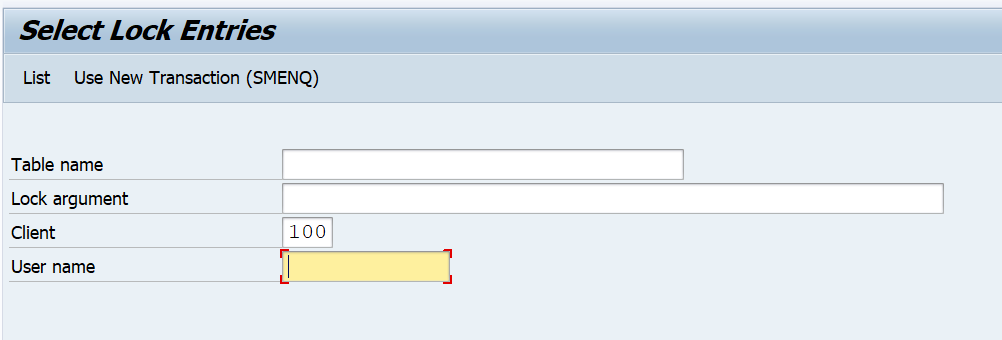
You can enter this way, or directly via transaction SMENQ:

From the start screen you can search for locks, just like SM12 can. The new functions are in the Server Administration button.

Enqueue server administration

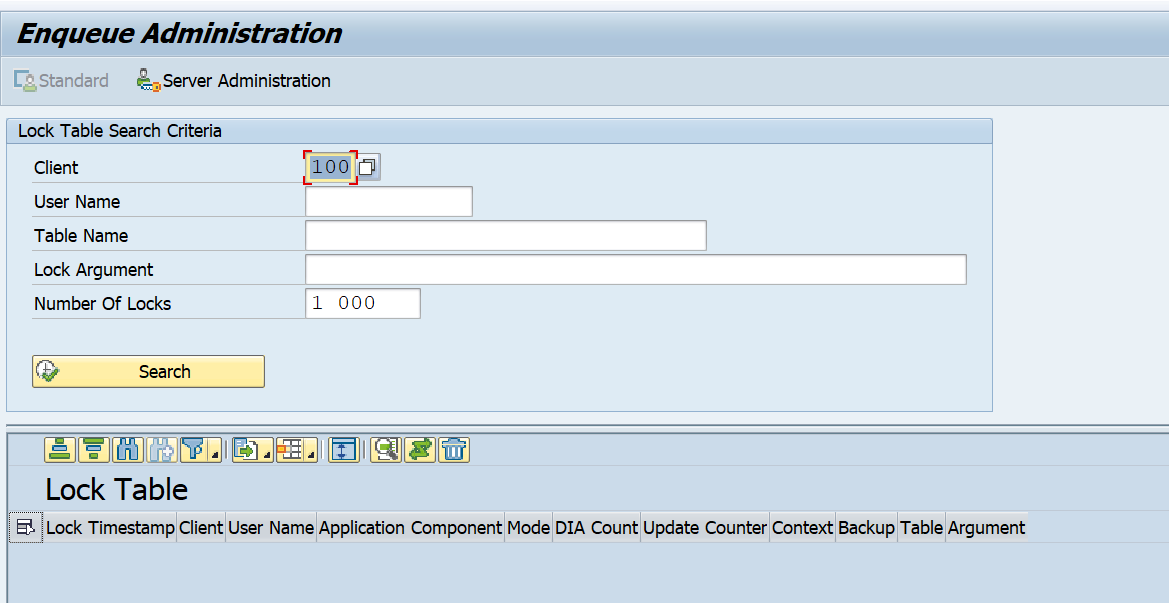
From the start screen of SMENQ goto the Server Administration:

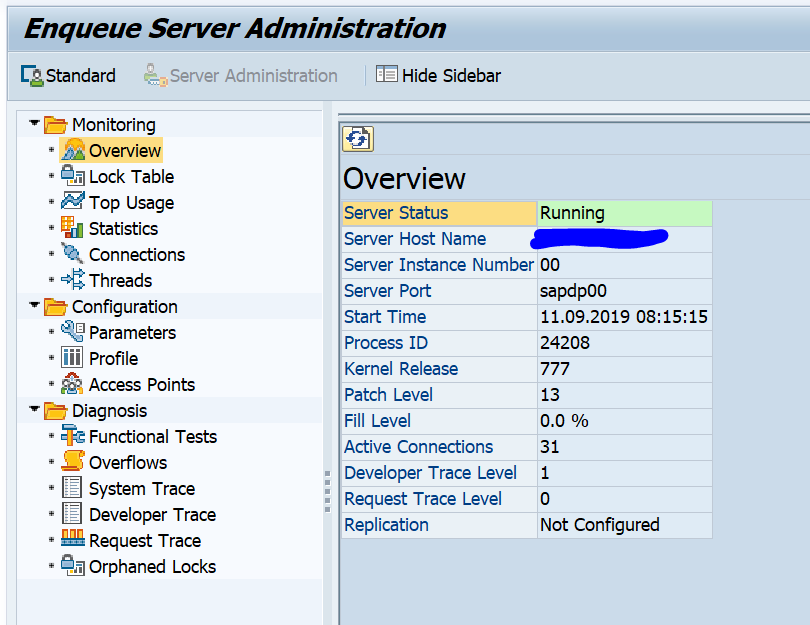
Now you can launch a lot of tool.

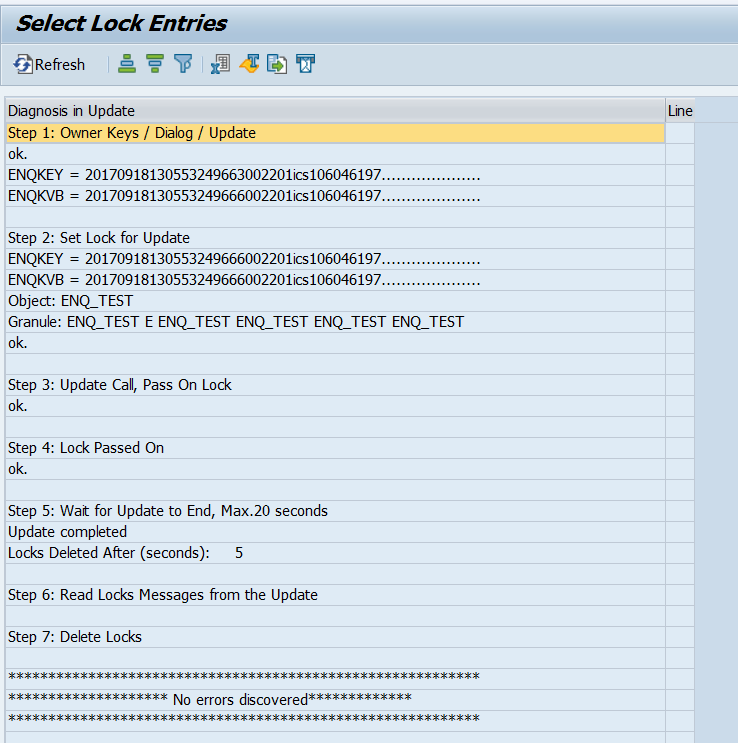
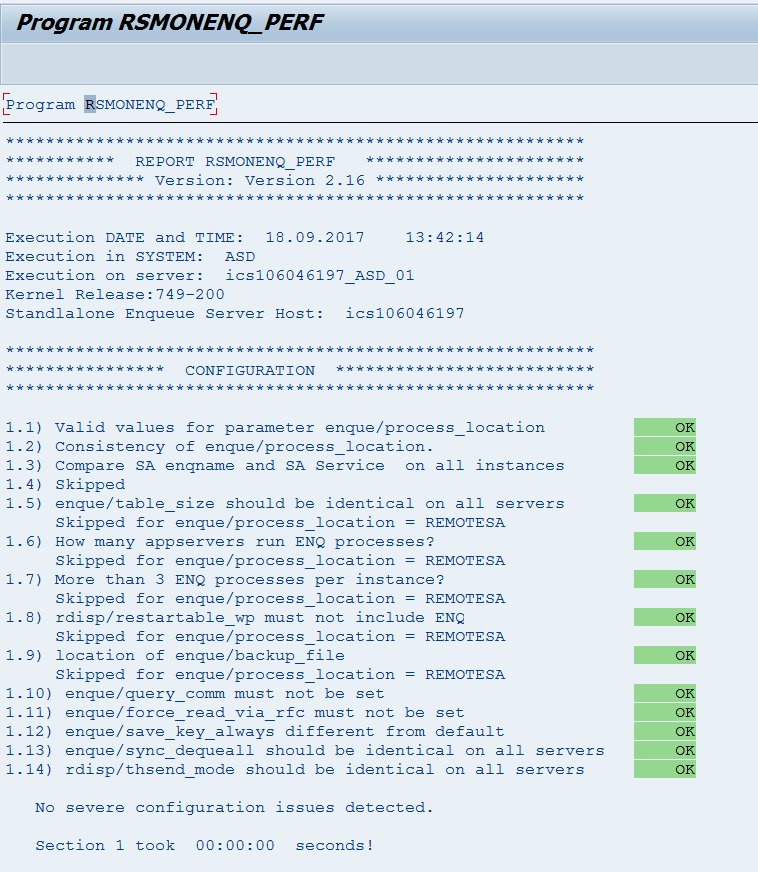
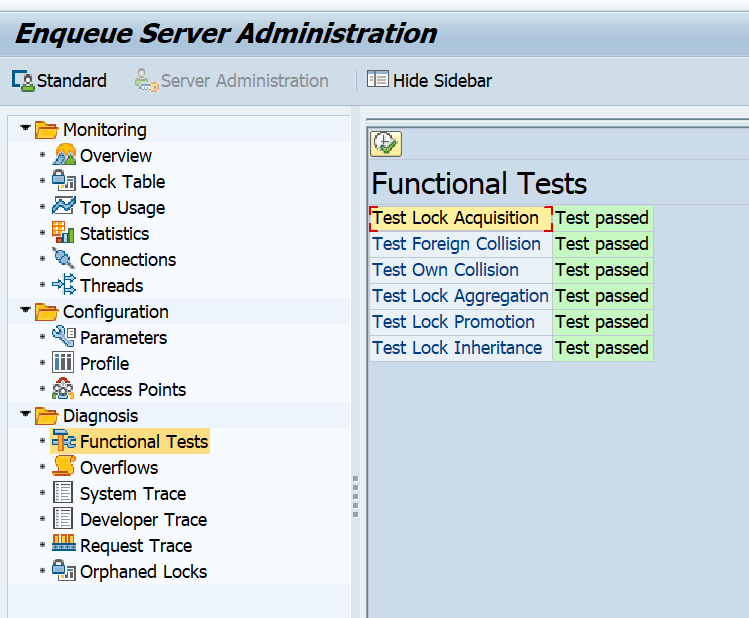
Interesting tool is the Functional Tests tool to quickly check the correct functionality of the enqueue server to be fully working:

Lock overflow issues

If you experience issues with lock overflow on standalone enqueue server 2, read OSS note 2917868 – ENQU, ENSA 2.0: Lock Table Overflow.

2942857 – ENQU 2.0: Maximum number of locks cannot be increased above 2 million.

Other issues

High wait times: 3250533 – High “Waiting Time for Lock Operations” statistic in Enqueue Server Administration.

Update pending: 2832507 – SMENQ shows replication status as “Active (update pending)”.

Trace file

ENSA trace file download is enabled via OSS note 2887346 – SMENQ: adjust the functionality.

Bug fix notes

Bug fix notes:

Background information

More background information on the functions of enqueue server 2 can be found at this blog.

Enque and lock table issue analysis

Enqueue and lock table issue analysis can be bit hard form time to time. They don’t regularly occur and when they do, they can have big system performance impact.

This blog will explain:

  • How to detect enqueue issues?
  • How to quickly analyze the enqueue issues?

Detecting enqueue issues?

Enqueue issues can be easily detected in SM50 and SM66 if work process get stuck long time with status ENQ.

First analysis on enqueue issues

The first analysis on enqueue issues can be done in transaction code SM12. From the menu now select the options Extra / Diagnosis and Extra / Diagnosis in Update. This will run the diagnostics on the enqueue handling.

Result looks like:

SM12 check enqueue in update

To get statistics on the enqueue processing, on the same SM12 start screen select the menu Extra / Statistics.

Deeper analysis on enque issues

For deeper analysis on the lock issues, you might need to switch to the detailed error handling part of SM12. This is a hidden feature. To switch it on you must have the correct authorization (S_ENQUE with ALL in the activities). Switching can be done by keying in the word TEST in the GUI command line (where you key in the tcodes and the /n etc).

Now you will see an extra menu called Error Handling.

From this menu you can directly launch program RSMONENQ_PERF via the menu option Error handling/Diagnosis environment. This programs will check the performance of the enqueue handling:

Result from program RSMONENQ_PERF

The Error Handling menu will also give you option to trace the enqueue processing.

Even more analysis is possible with the Enqueue Log Analyzer. See OSS note 3110596 – Analyze the enqueue scenario with enqueue log analyzer and kernel snapshot analyzer.

More backgrounds can be found in OSS note 2252679 – How to analyze an enqueue lock problem and OSS note 2126913 – ENQU: The enqueue log (specifically on the logging).

Troubleshooting for old locks: 2422483 – Troubleshooting old locks transaction sm12.

Large log file: 3254498 – Large number of entries in enqueue backup files.

High wait times: 3250533 – High “Waiting Time for Lock Operations” statistic in Enqueue Server Administration.

Not all locks are shown: 2795956 – SM12 does not list all locks.

Lock table overflow

Lock table overflow can happen when more locks are set by programs then the available allocated memory for the locks. In a normal system this will hardly occur. But during a conversion that is operating on massive amount of data (sometimes even using parallel jobs) this lock table overflow can happen. If it happens this will effect ALL users. They will get lock table overflow error and cannot save their work. More then enough reason to have large conversion tested first on a test system with production like sizing and settings.

The FAQ note on lock table overflow is: 552289 – FAQ: R/3 lock management.

What can be done about lock table overflow?

Provided you have checked your system sizing, you can increase the lock table memory by increasing the parameter enque/table_size. More background read OSS note 1565578 – Lock Table Overflow and OSS note 13907 – System error in the block handler, overflow lock table.

Before increasing make sure to have read these two OSS notes on the lock table: OSS note 746138 – Analyzing lock table overflows and OSS note 746138 – Analyzing lock table overflows.

If you are running an older ECC system, the lock table settings in the profile parameters might be set quite low. Newer upgraded ECC system can handle much higher values of the enque/table_size parameter.

Top capacity users

In SM12 you can select menu option Extra / Top Capacity Used / Current or History to find the top users of locks. Background: 2138377 – Output delivered by “Top Capacity Used” menu in SM12.

New enqueue manager 2.0

For the new enqueue manager 2.0 read this blog.