Introduction
Maintaining SAP HANA systems requires regular housekeeping activities, and one of the critical components is the HANA Cleaner. Monitoring its activity ensures that log cleanup and housekeeping jobs are running as expected.
In this blog, it is explained how we implemented HANA Cleaner monitoring in SAP Focused Run (FRUN) using custom metrics via template maintenance, without requiring custom scripts. This approach leverages standard FRUN capabilities and provides a scalable and maintainable monitoring solution.
Solution Overview
The objective of this monitoring setup is:
- Track the execution of HANA Cleaner jobs
- Detect inactivity or failure scenarios
- Alert operations teams proactively
We achieved this using:
- Custom Metric based on File Monitoring
- FRUN Template Maintenance
- Diagnostic Agent (push) data collection
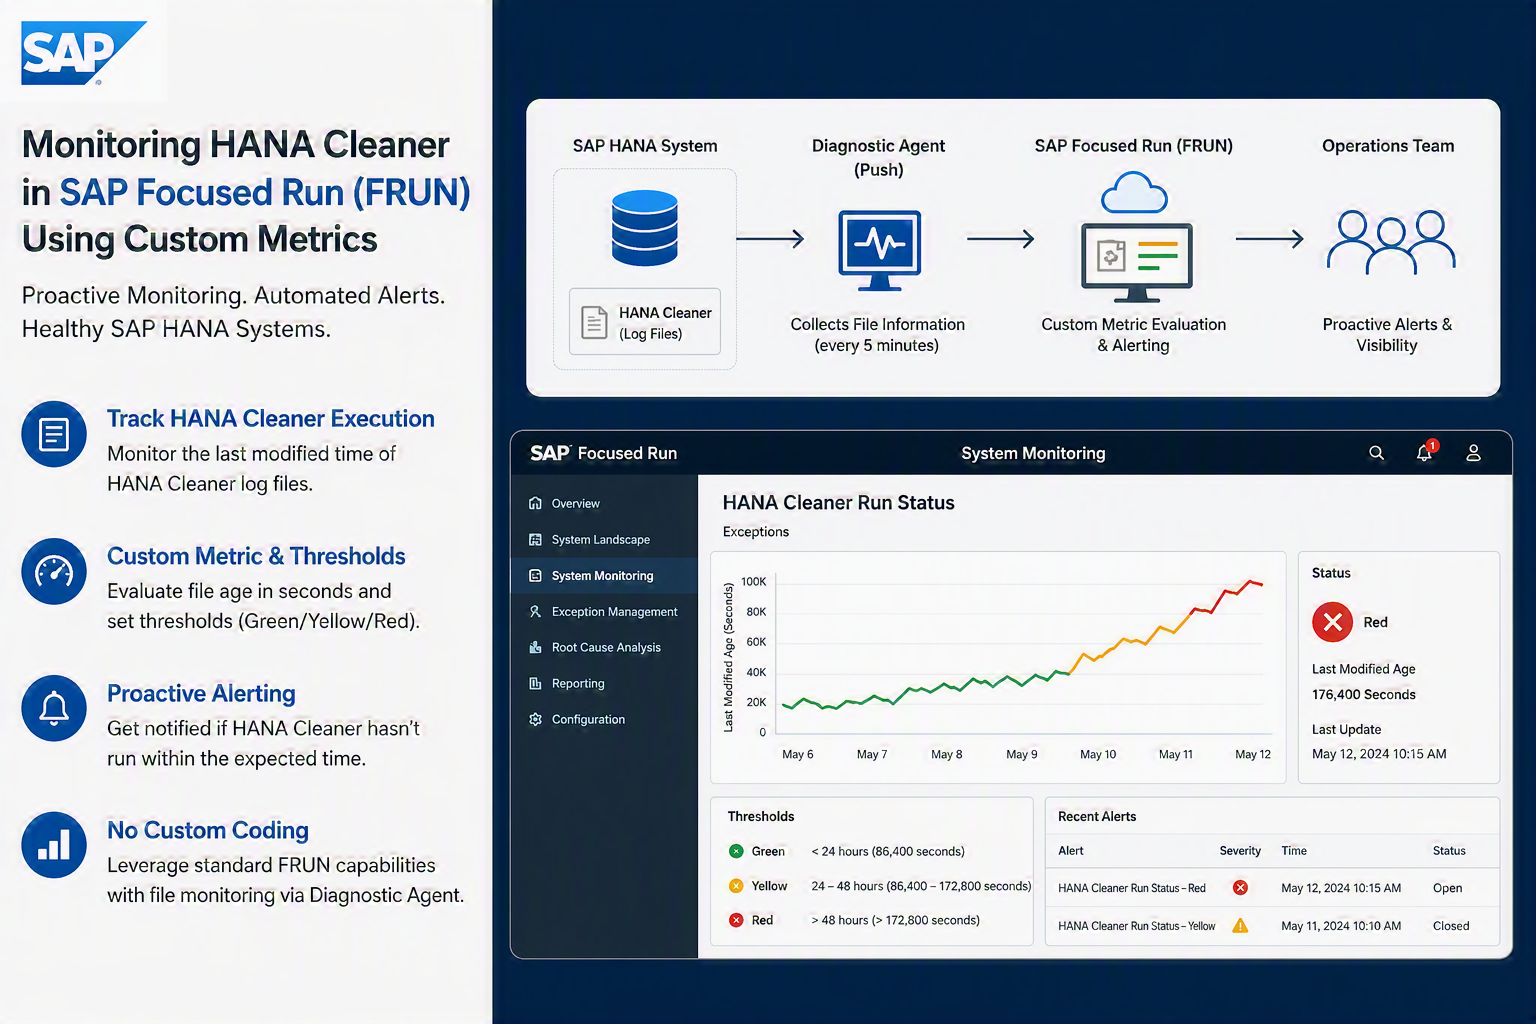
How It Works
The monitoring logic is simple but effective:
- The system monitors the last modified timestamp of HANA Cleaner log files
- A custom metric evaluates this timestamp continuously
- If no update is detected beyond a defined threshold (e.g., 2 days), an alert is triggered
This ensures immediate visibility into any issues with the HANA Cleaner process.
Implementation Details
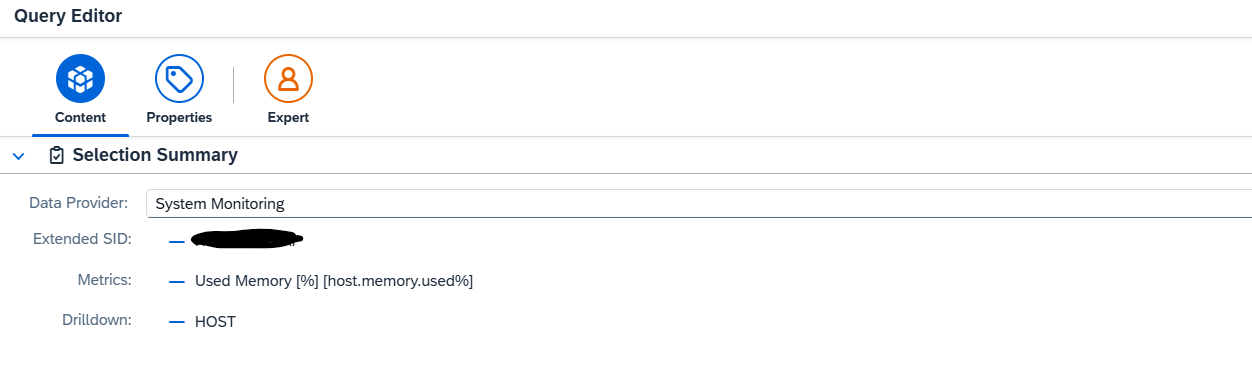
Step 1: Create Custom Metric in FRUN
Navigate to:
Advanced System Management → System Monitoring → Template MaintenanceCreate or enhance a metric such as:
HANA Cleaner Run StatusCategory:
ExceptionsStep 2: Configure Data Collection
From the screenshot setup, the following configuration is used:
Data Collector Type
Diagnostic Agent (push)Data Collector Name
File InformationCollection Interval
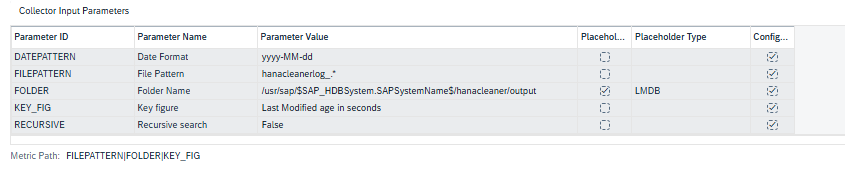
5 MinutesStep 3: Maintain Collector Input Parameters
Here are the key parameters used:
| Parameter ID | Description |
|---|---|
| DATEPATTERN | Date format used (yyyy-MM-dd) |
| FILEPATTERN | HANA Cleaner log file pattern |
| FOLDER | Path to log directory |
| KEY_FIG | Metric to evaluate |
| RECURSIVE | Enable/disable recursive search |
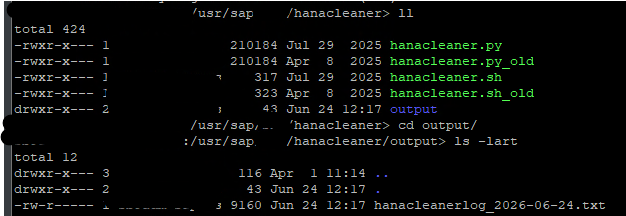
Actual Values Used
Plain Text
DATEPATTERN = yyyy-MM-dd
FILEPATTERN = hanacleanerlog_*
FOLDER = /usr/sap/${SAP_HDBSystemID}/${SAPSystemName}/hanacleaner/output
KEY_FIG = Last Modified age in seconds
RECURSIVE = False
Show more lines
✅ This configuration ensures the system monitors the latest file modification time in the HANA Cleaner output directory.
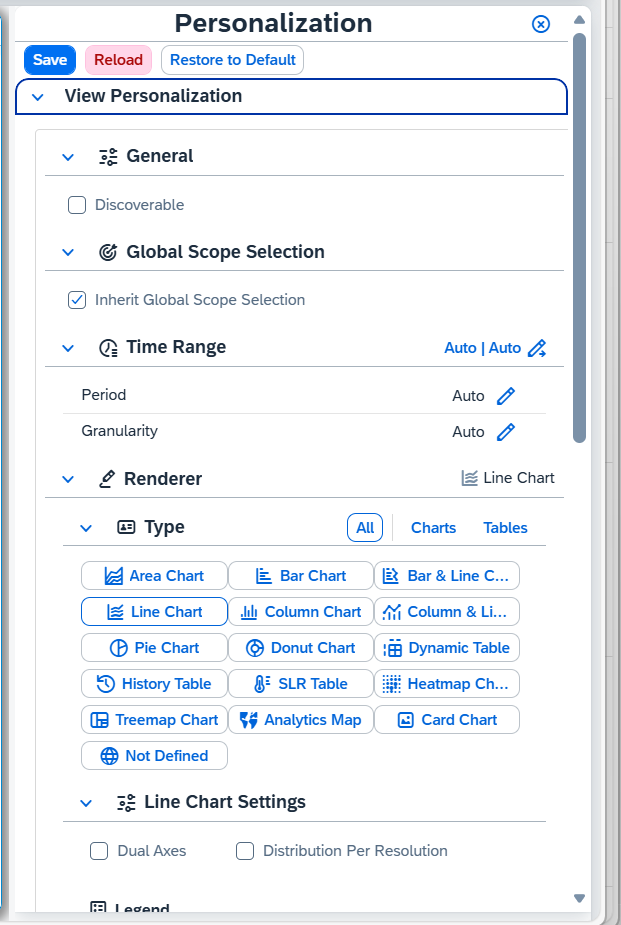
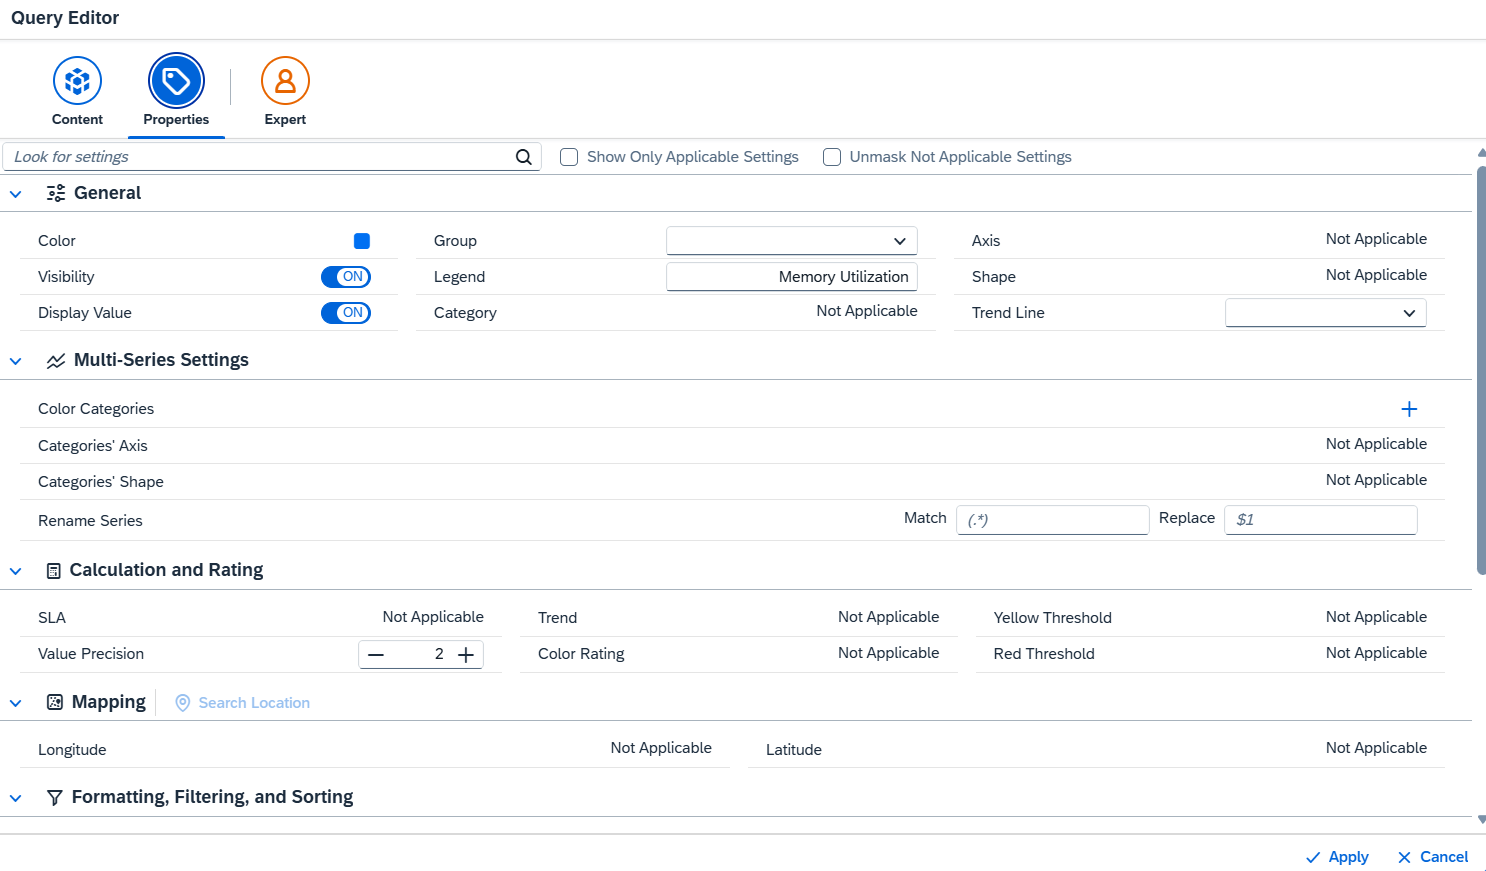
Step 4: Define Metric Logic
The key figure:
Last Modified Age in SecondsThis indicates how long it has been since the log file was updated.
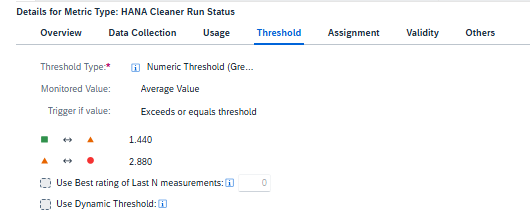
Step 5: Threshold Configuration
Define thresholds based on your operational requirements.
Example:
| Condition | Threshold |
|---|---|
| Green | < 24 hours |
| Yellow | 24–48 hours |
| Red | > 48 hours |
This ensures alerts are triggered if HANA Cleaner hasn’t executed in expected time.
Step 6: Assign Metric to Template
Assign the custom metric to:
- Relevant HANA systems
- Both Production and Non-Production landscapes
This ensures full coverage across your environment.
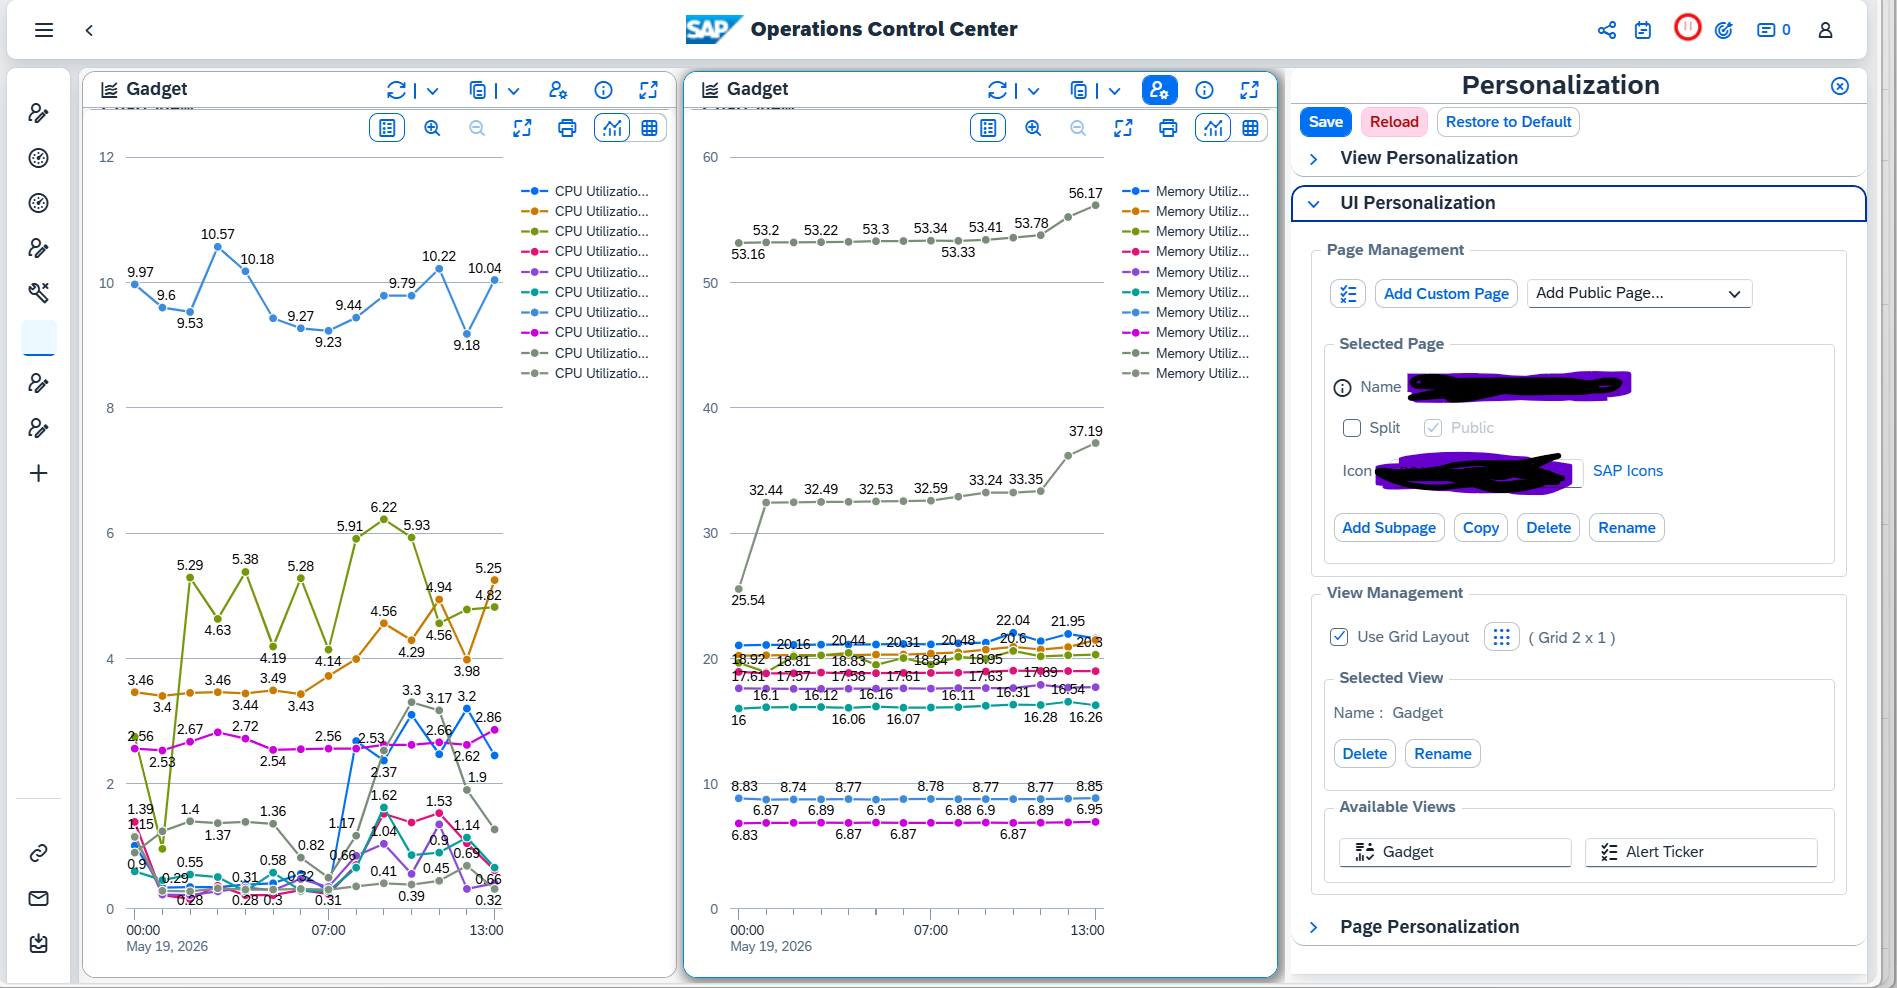
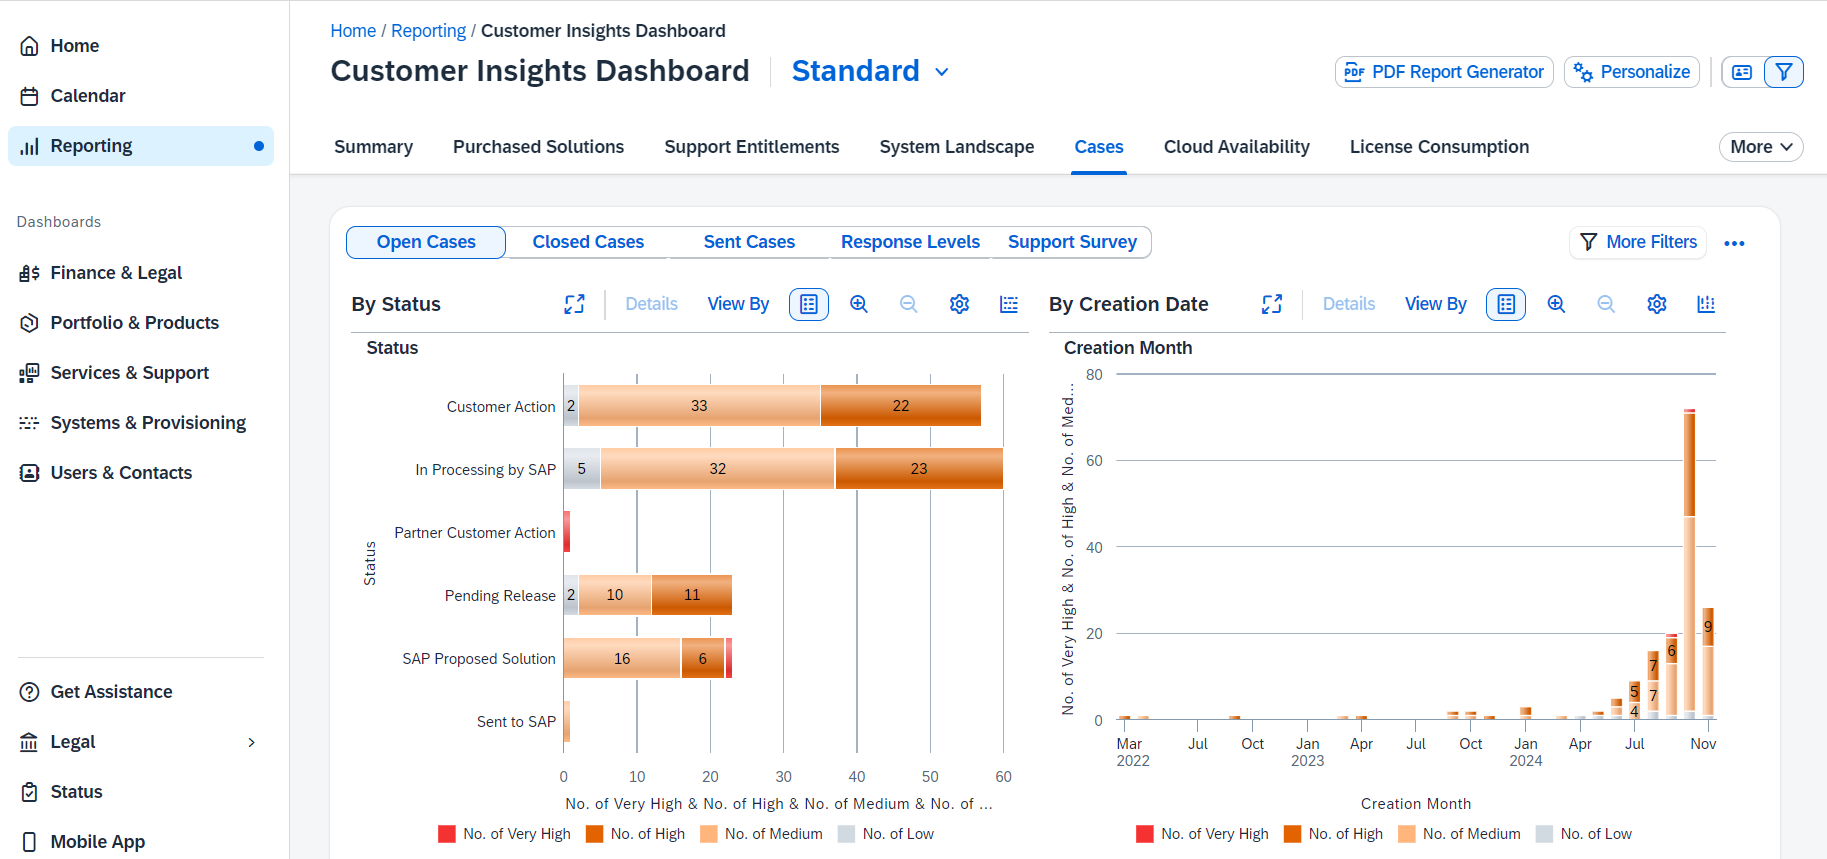
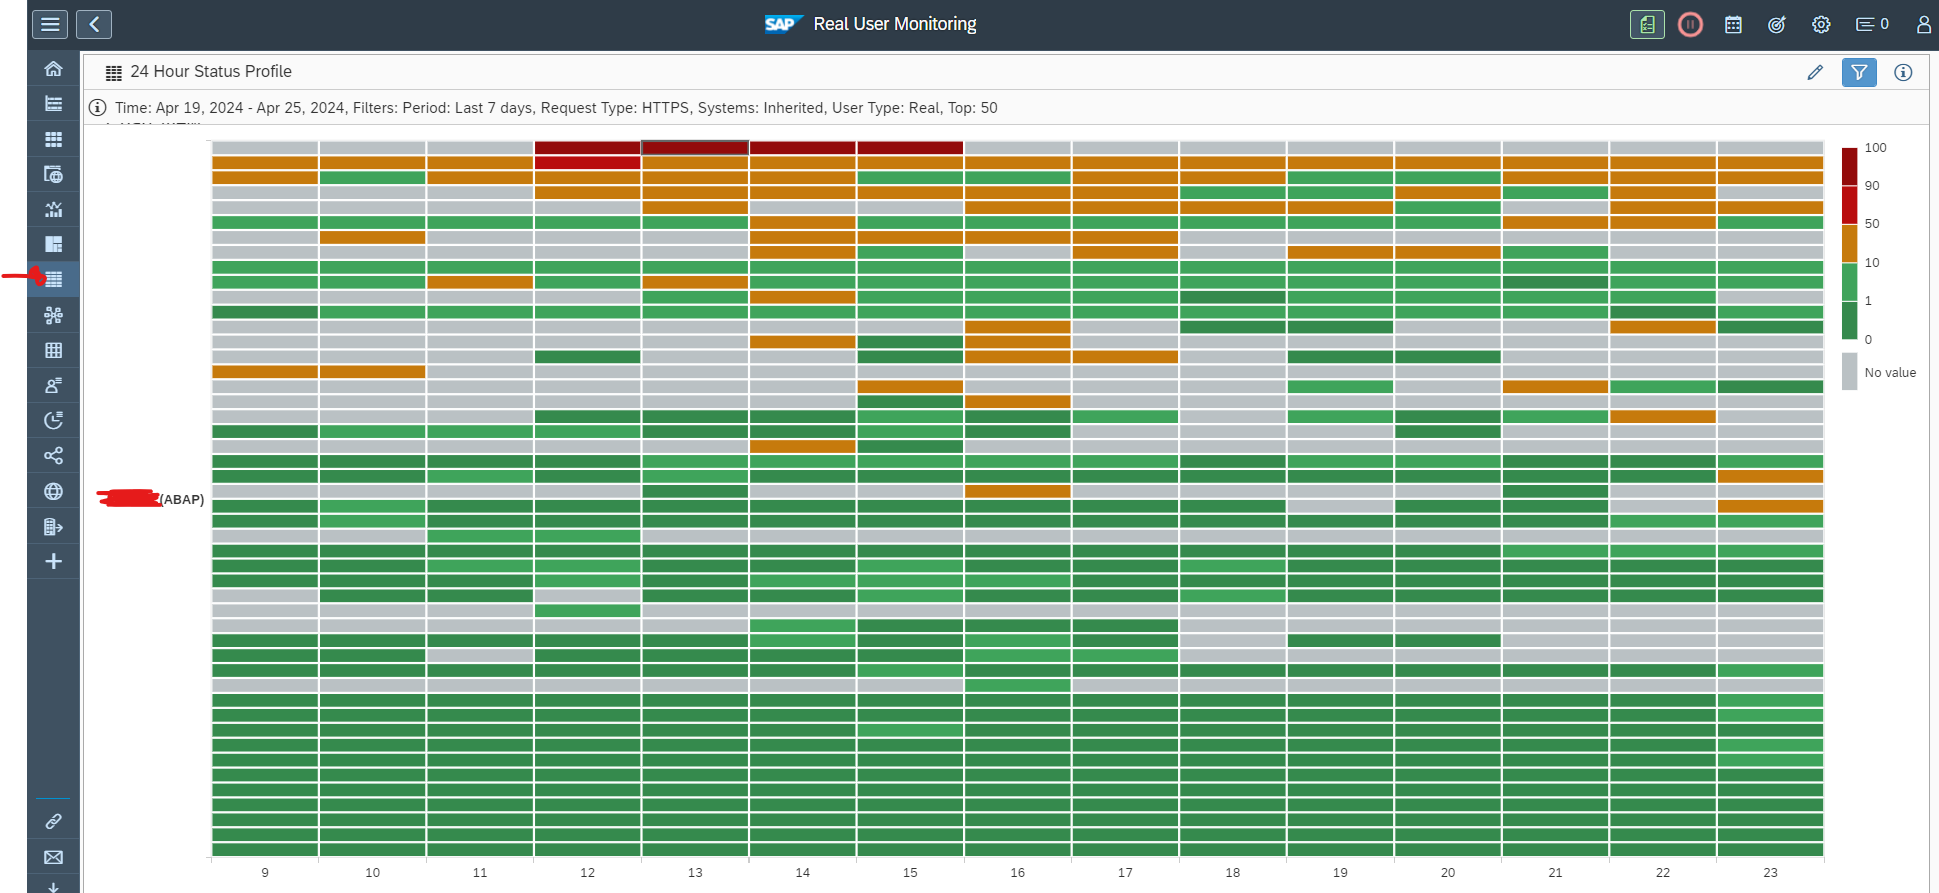
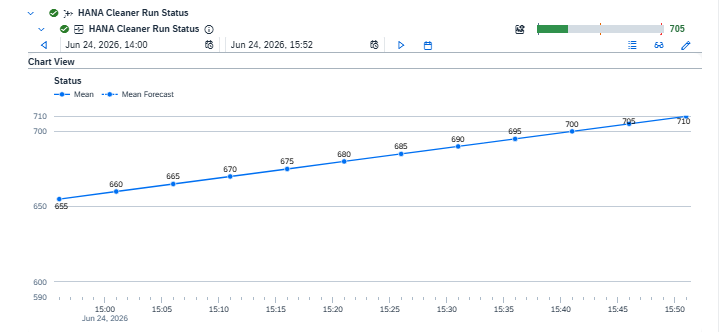
Monitoring Output
Once configured, FRUN displays:
- Historical trend of HANA Cleaner activity
- Status indicators (Green/Yellow/Red)
- Alerts in case of inactivity
From your reference screenshot:
- The metric appears under Exceptions
- A graph shows activity progression
- Alerts are triggered if thresholds are breached
- System Monitoring
- (Optional) Root Cause Analysis
Coverage
This setup can be implemented:
- Across the entire HANA landscape
- For all S/4HANA or standalone HANA systems
- In both:
- Production
- Non-Production environments
Advantages of This Approach
No Custom Coding Required
Uses standard FRUN capabilities
Can be applied across multiple systems via templates
Frequent monitoring (every 5 minutes)
Detects failures before business impact
Simple file-based monitoring logic
Key Learnings & Best Practices
- Always ensure correct file path and pattern
- Validate that Diagnostic Agent has access to directory
- Fine-tune thresholds based on:
- HANA Cleaner job frequency
- Business requirements
- Use template-based rollout for consistency
Conclusion
Monitoring housekeeping activities like HANA Cleaner is critical for maintaining system health. By leveraging FRUN custom metrics and file monitoring, we can implement an efficient, scalable, and proactive monitoring solution.
This approach eliminates the need for custom scripts while fully utilizing standard SAP monitoring capabilities.