SAT ABAP runtime analysis

The SAT ABAP runtime analysis tool can be used to identify performance problems in ABAP programs.

Questions that will be answered in this blog are:

  • How to run the SAT tool?
  • How to read the results of the SAT tool?

Starting the SAT tool

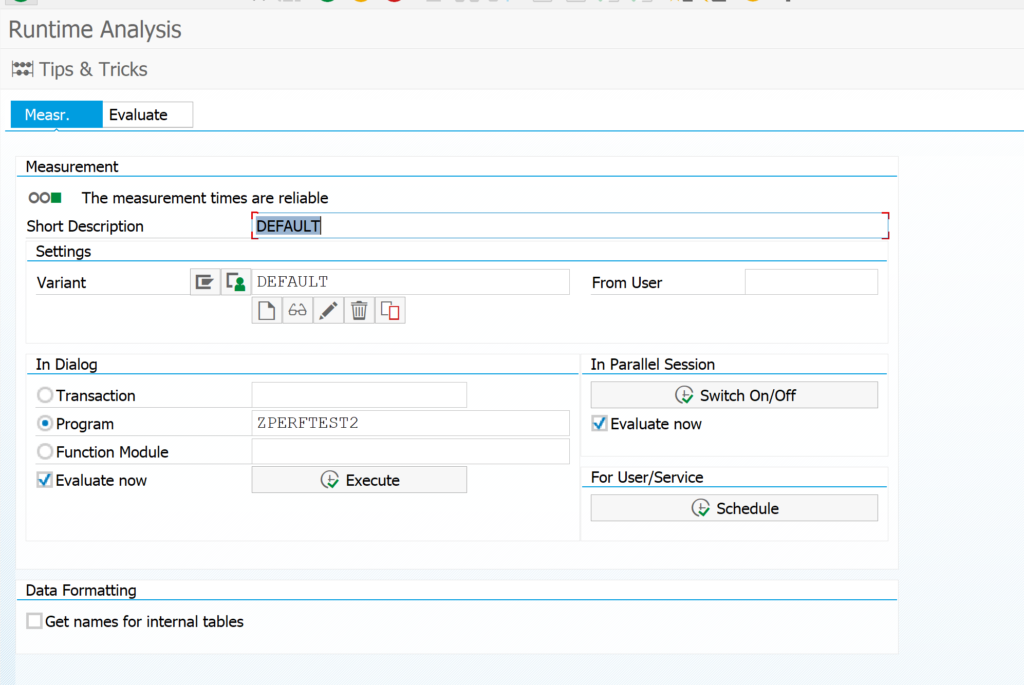
The SAT ABAP runtime analysis tool can be started with transaction SAT:

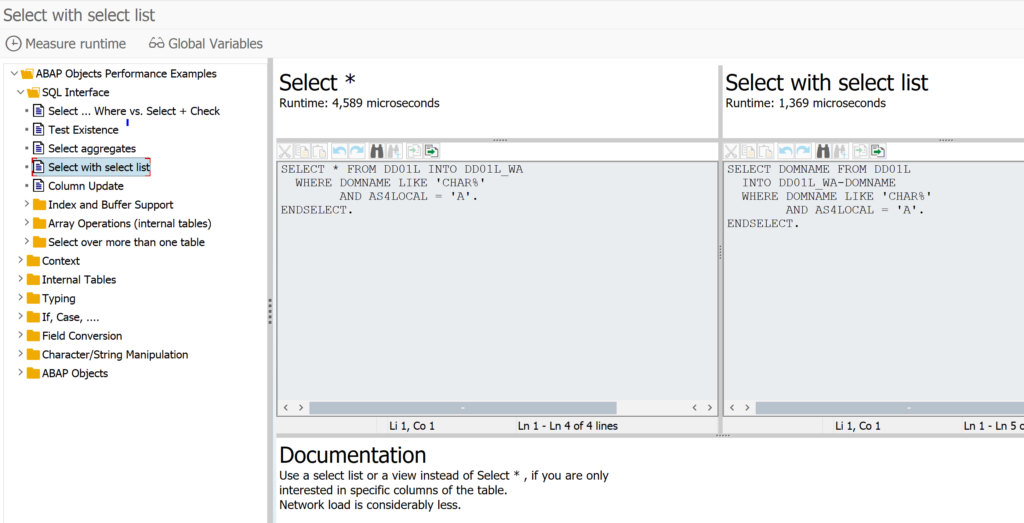
Top left there is a Tips & Tricks button. This will bring you the to the following tool:

Here you can compare the optimal and not optimal way of coding. By hitting measure runtime button you can actually compare in real time the difference between the 2 methods.

The performance issue program

To test the tool, we first write a simple test program:

REPORT zperftest2.

DATA: zlt_vbak TYPE TABLE OF vbak.
DATA: zls_vbak TYPE vbak.
DATA: zlt_vbap TYPE TABLE OF vbap.
DATA: zls_vbap TYPE vbap.
DATA: zls_vbap2 TYPE vbap.

SELECT * FROM vbak INTO TABLE zlt_vbak UP TO 100 ROWS.

LOOP AT zlt_vbak INTO zls_vbak.
  SELECT * FROM vbap INTO zls_vbap.
    DO 10000 TIMES.
      zls_vbap2 = zls_vbap.
    ENDDO.
  ENDSELECT.
ENDLOOP.

Now we start the SAT tool, enter the program name. Make sure the tick box evaluate immediately is on and press Execute.

Now the measurement will start.

Result of the trace tool

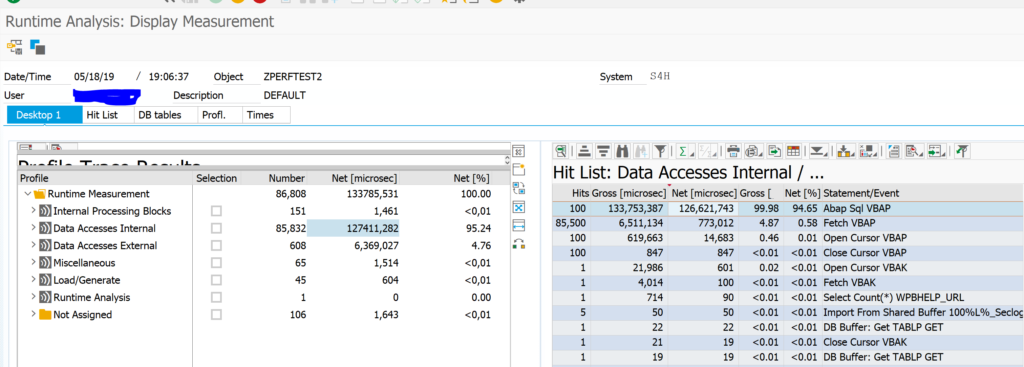
The result of the trace tool is as follows:

On the left side you see the split in where the program spends it time. Here you can see that most of the time is spend on internal processing and not on SQL statements. SQL statement can be analyzed from the SAT tool or from the ST05 SQL trace tool.

By double clicking on the the internal access the right hand side of the screen is filled. Here you can see in which code blocks the most net and gross time is spent. It does not always point you to the exact statements that are not ok, but it can point you to the program that is causing the biggest delay.

In our case the DO 10000 TIMES loop is the performance killer. With only SQL tracing this cannot be found.

Runtime analysis for web applications

For runtime analysis for web applications, read this dedicated blog.

Relevant OSS notes

Check and if needed you can apply these OSS notes to solve bugs in the SAT tool:

ST05 SQL performance tracing

Performance issue solving is an important job for ABAP and basis consultant. One of the helpful tools is ST05 SQL performance trace tool.

Questions that will be answered in this blog are:

  • How to switch on ST05 SQL trace?
  • How to read the results from the ST05 SQL trace?
  • How to use the ST05 SQL trace with multiple application servers?

The test program

First we create a small test program for our performance analysis.

REPORT zperftest.

DATA: zlt_vbak TYPE TABLE OF vbak.
DATA: zls_vbak TYPE vbak.
DATA: zlt_vbap TYPE TABLE OF vbap.
DATA: zls_vbap TYPE vbap.

SELECT * FROM vbak INTO TABLE zlt_vbak UP TO 1000 ROWS.

LOOP AT zlt_vbak INTO zls_vbak.
  SELECT * FROM vbap INTO zls_vbap.
    DO 10 TIMES.
      CALL FUNCTION 'BAPI_MATERIAL_EXISTENCECHECK'
        EXPORTING
          material = zls_vbap-matnr+0(18).
    ENDDO.
  ENDSELECT.
ENDLOOP.

Off course this program is written very badly to be really slow and making performance issues.

ST05 SQL trace

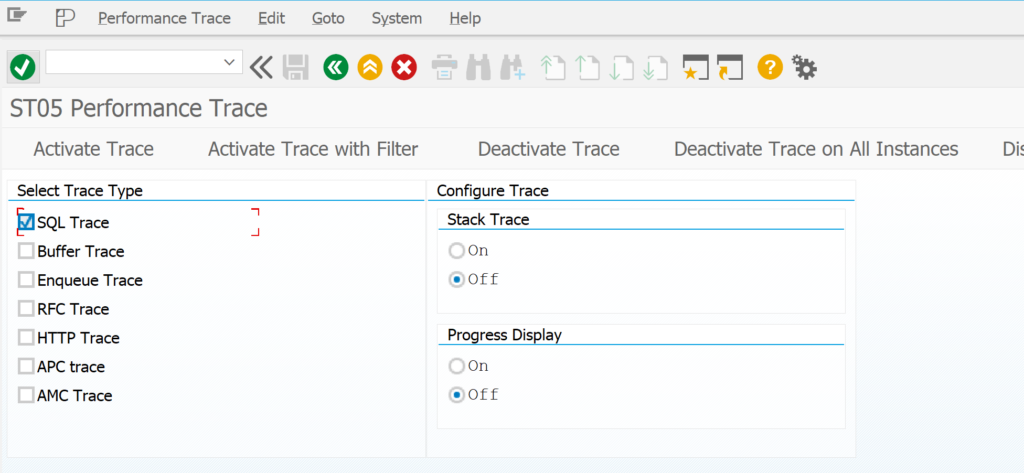
Start the ST05 SQL trace tool with transaction code ST05.

You can activate the trace for all users with the button Activate trace. But this is usually not needed and will only give you a long trace to analyze.

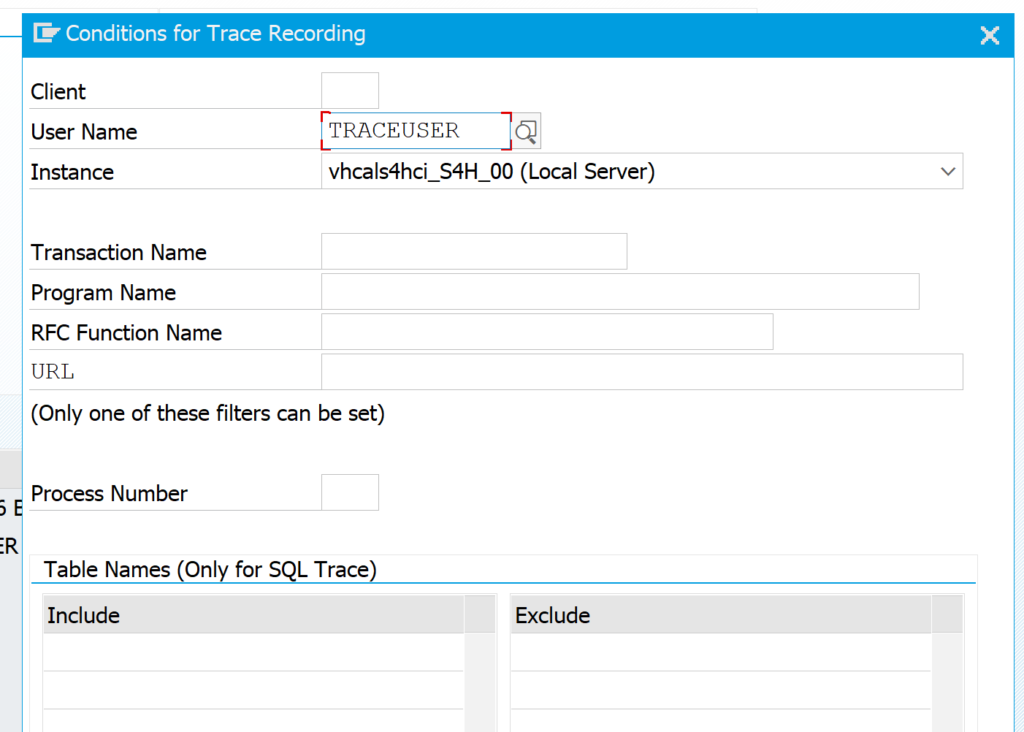
The usual method is to activate the trace with a filter, mostly on user name to trace a specific user action:

If the authorization team already started on ST01 authorization trace, you cannot start the SQL trace. First stop the ST01 trace. 

Now you can start the performance test program in a different session. Just wait until it is finished. It is important the user you are tracing is only doing this action and does not perform any other action, since these other actions are also recorded and will make the analysis harder to read.

When completed go back to the ST05 and click Deactivate trace.

Trace analysis based on duration

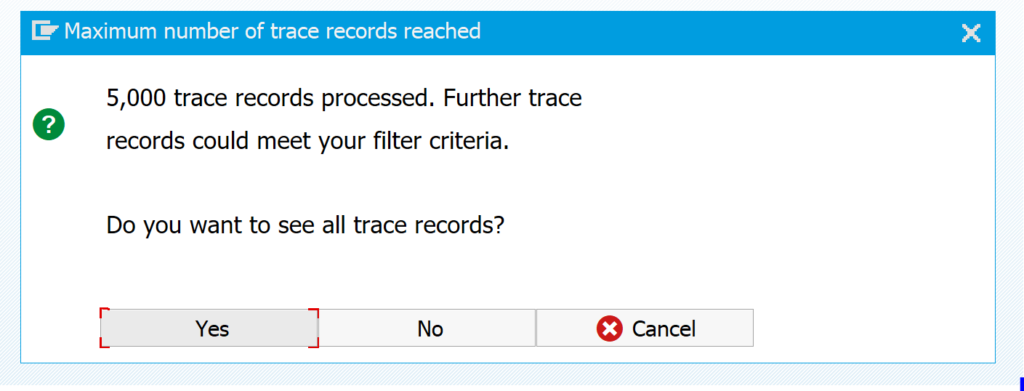
Now press the Display trace to see the results. If your trace is large you will get this screen:

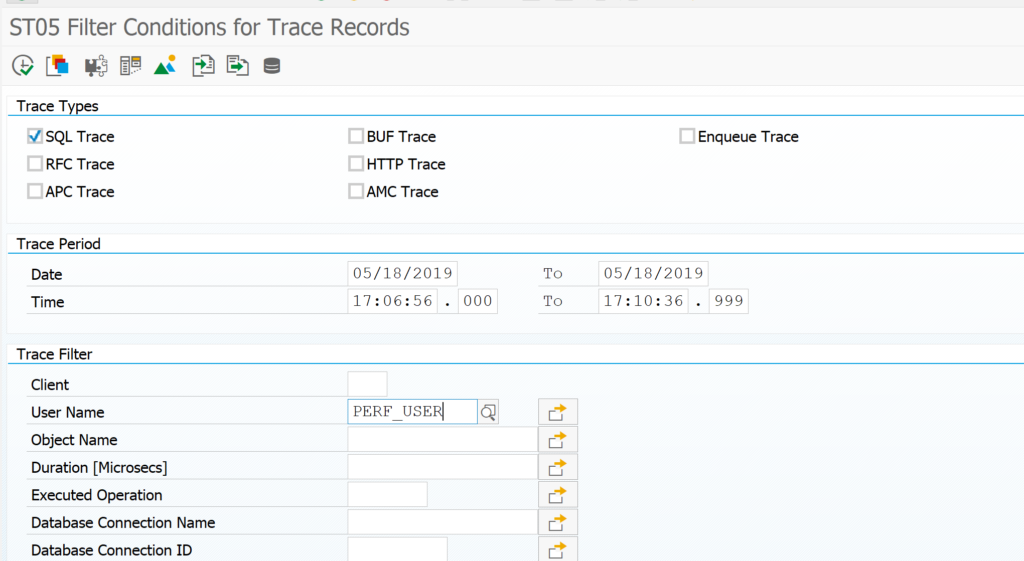
This is quite common and click yes. If your result is really too big, change the 5000 on the first screen in to a good maximum, or try to record a smaller time frame.

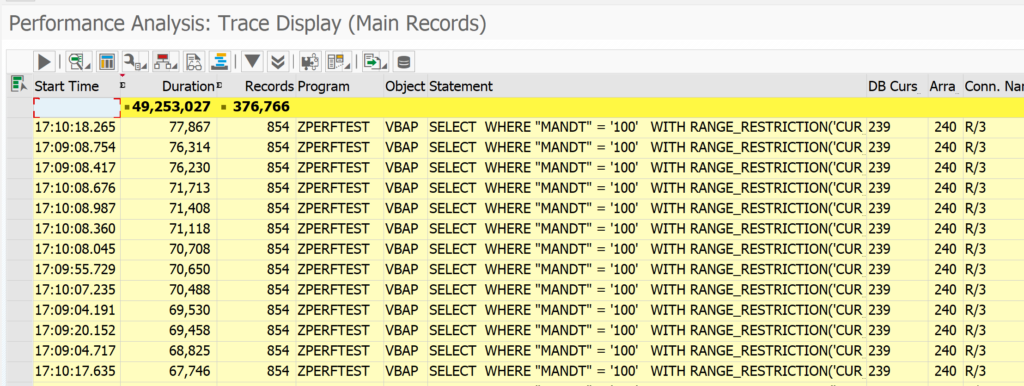
Result now looks like this after sorting on the column duration:

You can see that the total SQL commands took 48 seconds in total. The longest SQL single command took 78 milliseconds (which is very fast, so long running SQL’s are not the issue in this example).

In your case you might find very large single SQL commands. By selecting the line and pressing the button Display ABAP call location, you can jump to the place in the coding that fired the SQL command.

Summarized trace analysis

Since we have many records and many small ones, we need to use the summary tools. In the trace analysis select menu path Trace and then Structure Identical statements. This will give the following surprisingly short overview:

In the third column you can see that there are 100 identical calls, and also a high number of redundant calls.

If you now click on the second line to the ABAP call position you jump to our badly performing program and see that the majority of the delay is coming from the do 100 times loop. The first line is coming from standard SAP in the BAPI call.

This happens in real live as well that not all calls will point you into the right program. You might have to check multiple lines to find the right program causing the issue.

Multiple application servers

Development systems normally have only 1 application server. Productive servers can have more. If you have to analyze a performance issue directly on production with ST05, you have to be aware that the performance trace is per application server. If needed, you can select in ST05 as specific server, or you can select all. The trace display is still per server.

Relevant OSS notes

Notes to check or to apply:

Delete ABAP developer keys

This blog will answer the following questions:

  • How to delete old ABAP developer keys from my system?

ABAP developer keys clean up

If ABAP developers leave their key is still in your system and could potentially misused. Also when SAP comes to measure licenses they might peek in table DEVACCESS to see which developer keys are present.

Unfortunately SAP does not deliver a standard program delete an unused ABAP key. See OSS note 1710320 – How to delete SSCR Object and/or Developer Keys – SAP ONE Support Launchpad.

So you simply have to write your own customer program with a code that looks like:

DELETE FROM DEVACCESS WHERE UNAME EQ '<USERNAME>'.

Maintenance view on DEVACCESS

Alternative solution is to create a maintenance view on table DEVACCESS. This will require a once off modification key. Then you can delete and insert developers keys via the normal SM30 table maintenance transaction.

Developer key hack

The developer keys are not safe, so don’t rely on them. See this blog.

S4HANA

S4HANA does not have the developer key principle at all any more. You can delete all keys in S4HANA. Read more in this blog.

Analyzing code before upgrade or support package: CDMC toolset

This blog will explain on the use of the CDMC toolset you can run analyzing your custom code, before starting upgrade or support package.

CDMC toolset

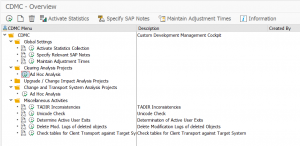
Start transaction CNV_CDMC to goto the CDMC overview.

Goto ad hoc analysis:

CNV_CDMC start screen

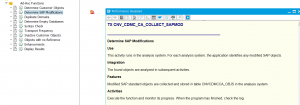
Start SAP modification run

Determine SAP modifications run

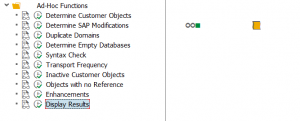
Wait for run to finish. If done, click the Display Results.

Run ready

View results:

Run results

Setback of the modification overview: also OSS notes are marked as modifications.

Other useful runs: Syntax check and Inactive customer objects.

If you run these checks before an upgrade you can save quite some annoying issues during the upgrade itself.

OSS notes

Relevant OSS notes: