This blog will explain about webservice message monitoring.
Questions that will be answered are:
- How can I display webservice messages?
- How can I set the deletion retention timing for webservice messages?
This blog assumes that you have correctly activated the basic SOAP webservice runtime. See separate blog on this topic.
Webservice message monitoring
You can start the webservice message monitoring with transaction SRT_MONI. In the selection screen fill out filtering parameters are per need:
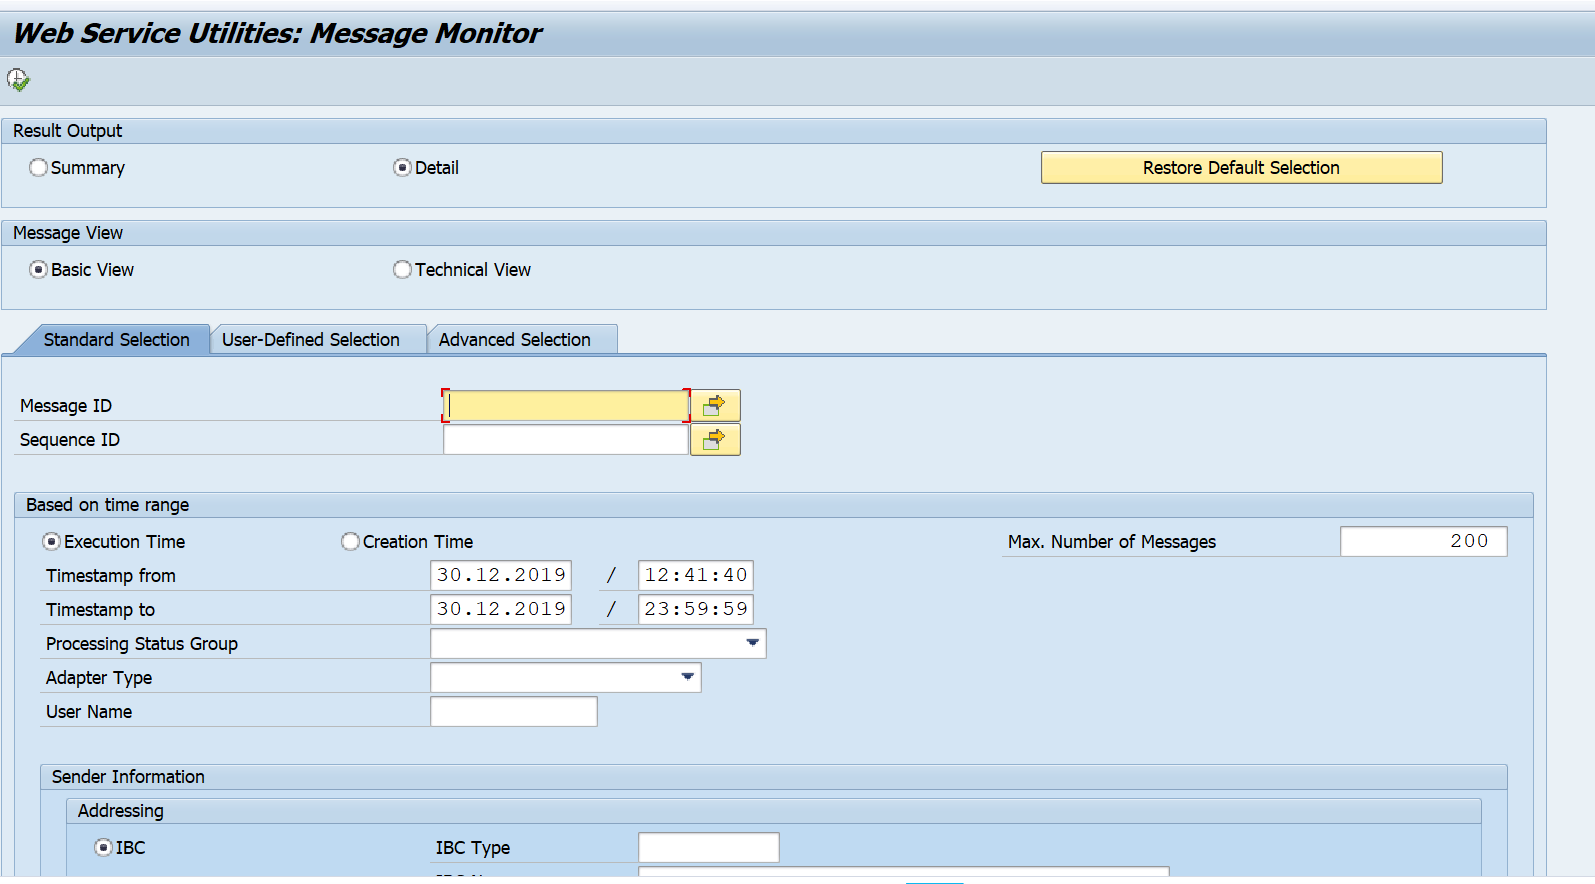
Result will look like:
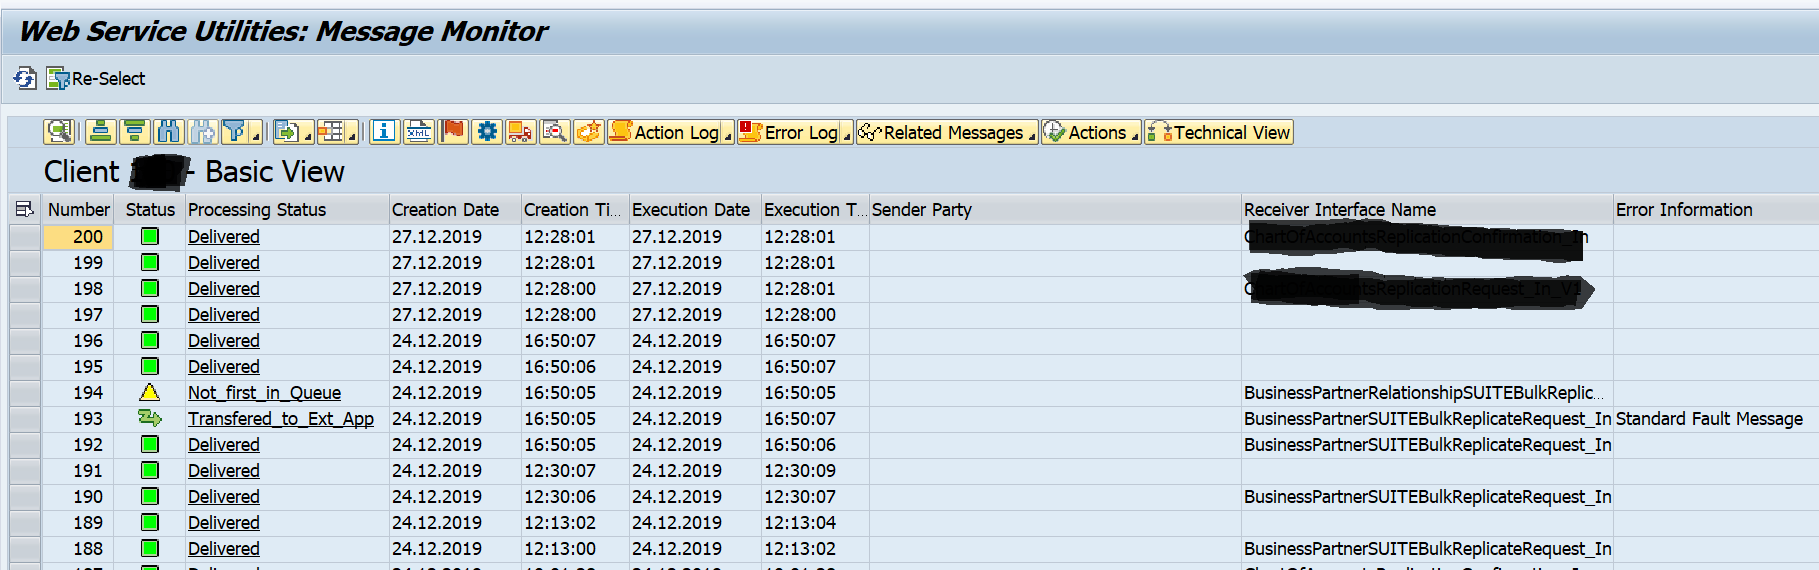
By clicking on the message itself you can see the content in XML format.
Monitoring OSS notes:
- 2031733 – ESI – Error: WSRM_CREATE_FAILED
- 2212497 – ESI – Error: No web service configuration for this access path
- 2278161 – ESI – “Wait for Scheduler” status for Asynchronous messages in SRT_MONI
- 2481529 – ESI – Deletion of WS bgRFC queues via bgRFCMonitor is not possible
- 2754008 – ESI – SRT_MONI: No authority to use bgRFC Monitor API
- 2670185 – ESI – SXMB_MONI: Message cannot be deleted from consumer end point
- 3146980 – Short Dump SRT_MONI (UDS)
- 3269942 – ESI – Transfered_to_Ext_App status in SRT_MONI
- 3257313 – SRT_MONI_GSF: Error messages in WS Block IF_T100_MESSAGE.T100KEY are missing
- 3275141 – ESI – How to find the software component for a SOAP message in transaction SRT_MONI
Web service error log
Use transaction SRT_ELOG to go to the web service error log.
Setting retention period of webservice message deletion
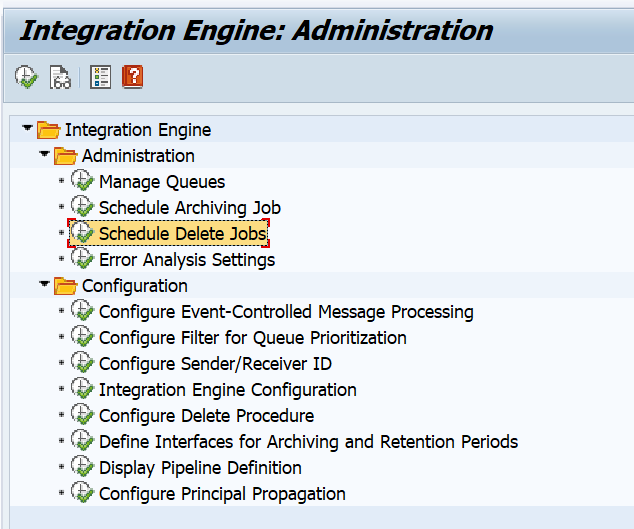
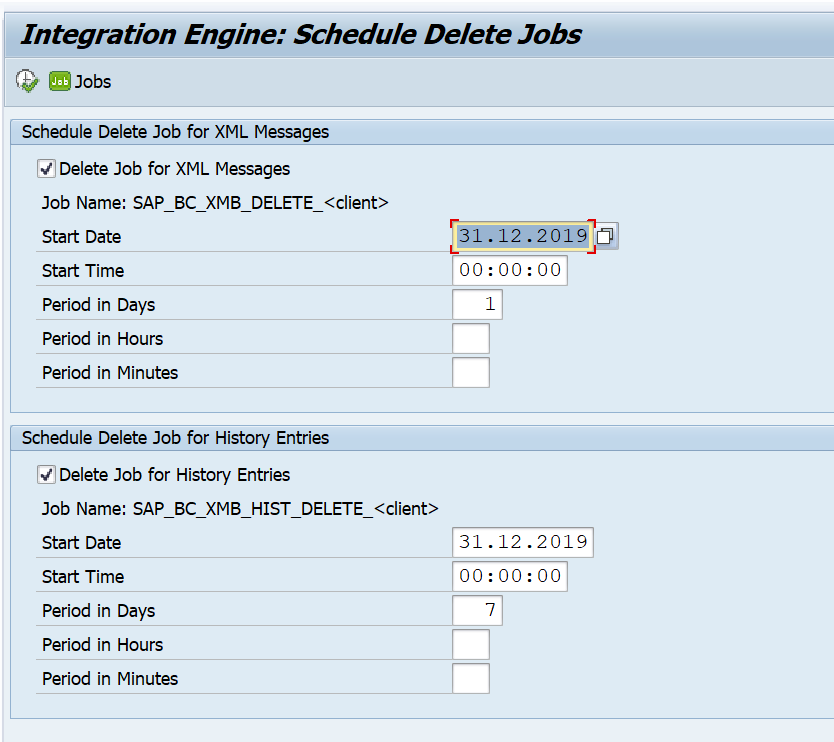
Webservice messages will get deleted automatically in the SAP system. The default value is one week. You might need to keep the messages longer. The setting that controls this retention period is quite hidden. To change the setting, you need to start transaction SXMB_ADM and then select the option Schedule Delete Jobs:
Then you change the retention settings as per need:
Web service tracing
Web service tracing can be activated in transaction SRT_UTIL.
Be careful when switching the trace to on, on a productive system: it can generate a lot of load. Do apply and read OSS note 3084970 - SRT_UTIL: Show disclaimer when enabling tracing for URIs.
Payload trace is explained in OSS 3195367 – ESI – How to use the SRT_UTIL Payload Trace.
OSS notes for tracing and SRT_UTIL:
- 1711486 – ESI – Error when calling Web Services from a browser or transaction SICF
- 1931959 – ESI – SRT: User restore or User preserve failed
- 2203802 – ESI – ICM_HTTP_SSL_ERROR when trying to test a Web Service
- 2237014 – ESI – “Reliable messaging (RM) configured, but no Message ID and no WSRM assertion provided” error when using Web Services ABAP
- 2344142 – ESI – Web Service call fails with CX_SY_CONVERSION_CODEPAGE error [VIDEO]
- 2488301 – ESI – Error: Web service processing error; more details in the web service error log on provider side
- 2994828 – ESI – CX_SY_CONVERSION_NO_DATE_TIME value is not a valid date with time
- 3006159 – ESI – Error: CX_SY_CONVERSION_DATA_LOSS
- 3038290 – Tools for analyzing problems in Web Service framework
- 3084892 – Web Service Tracing: Check Request-URI
- 3091390 – Web service fails with the error Authentication failed (Method wsse:UsernameToken, SRTUTIL Transaction Id xxxxxxxxxxxxxxxxxxxxxxxxxxxxxx)
- 3096588 – ESI – Operation “<operation name>{<namespace>}” not supported (interface: “<interface name>” errors in SRT_UTIL
- 3188653 – How can I capture a synchronous payload destined to ERP in my CIG integration?
- 3220463 – HTTP Codes “502 invalid response” or “504 : Gateway Time-out”
- 3252938 – ESI – Error when clicking the “Original XML” button
- 3266574 – HTTP Code: 403 ( Forbidden ) in SRT_UTIL while saving the Sales Order
- 3413202 – Persist Interface Information in SOAP Error Log for asynchronous Web Services with Stateless(old) pattern
- 3420604 – Dump in SRT_UTIL_RESTART for inconsistent message (missing sequence)
Generic search frame work
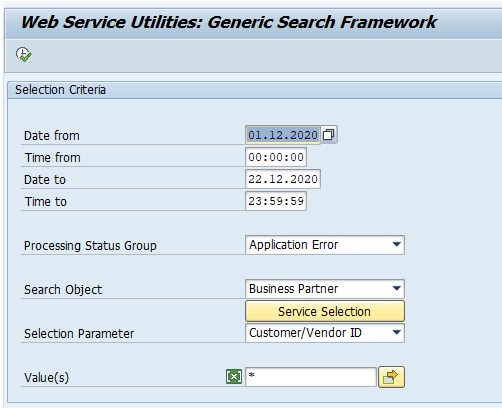
SAP has create in S4HANA 2020 extra search framework. Transaction code SRT_MONI_GSF starts up a specialised search frame work:
To get this new framework you need to apply these 4 OSS notes:
- 2971973 – SRT_MONI_GSF Creation of package
- 2972601 – SRT_MONI_GSF Interface Note
- 2972602 – SRT_MONI_GSF Application Note Business Partner
- 2980590 – SRT_MONI_GSF Application Note T100 Messages
- 3254857 – SRT_MONI_GSF timeout dumps due to high data volume
Bug fix OSS notes
- 2971683 – Time-out error in SRT_MONI Message Display for XML-Conversion errors with huge Payload
- 3001513 – ESI – Function not available for current processing status error when cancelling a message in transaction SRT_MONI
- 3101750 – The SRT_MONI Generic Search Framework does not offer the sender name of the service as filter criteria