The integration and cloud monitoring function of SAP Focused Run consists of 2 main functions:
- Cloud monitoring between on premise and cloud SAP products
- Interface monitoring between SAP systems (read more on interface monitoring in this blog)
This blog will give an overview of the Cloud monitoring between SAP on premises systems and SAP cloud solutions.
Questions that will be answered in this blog are:
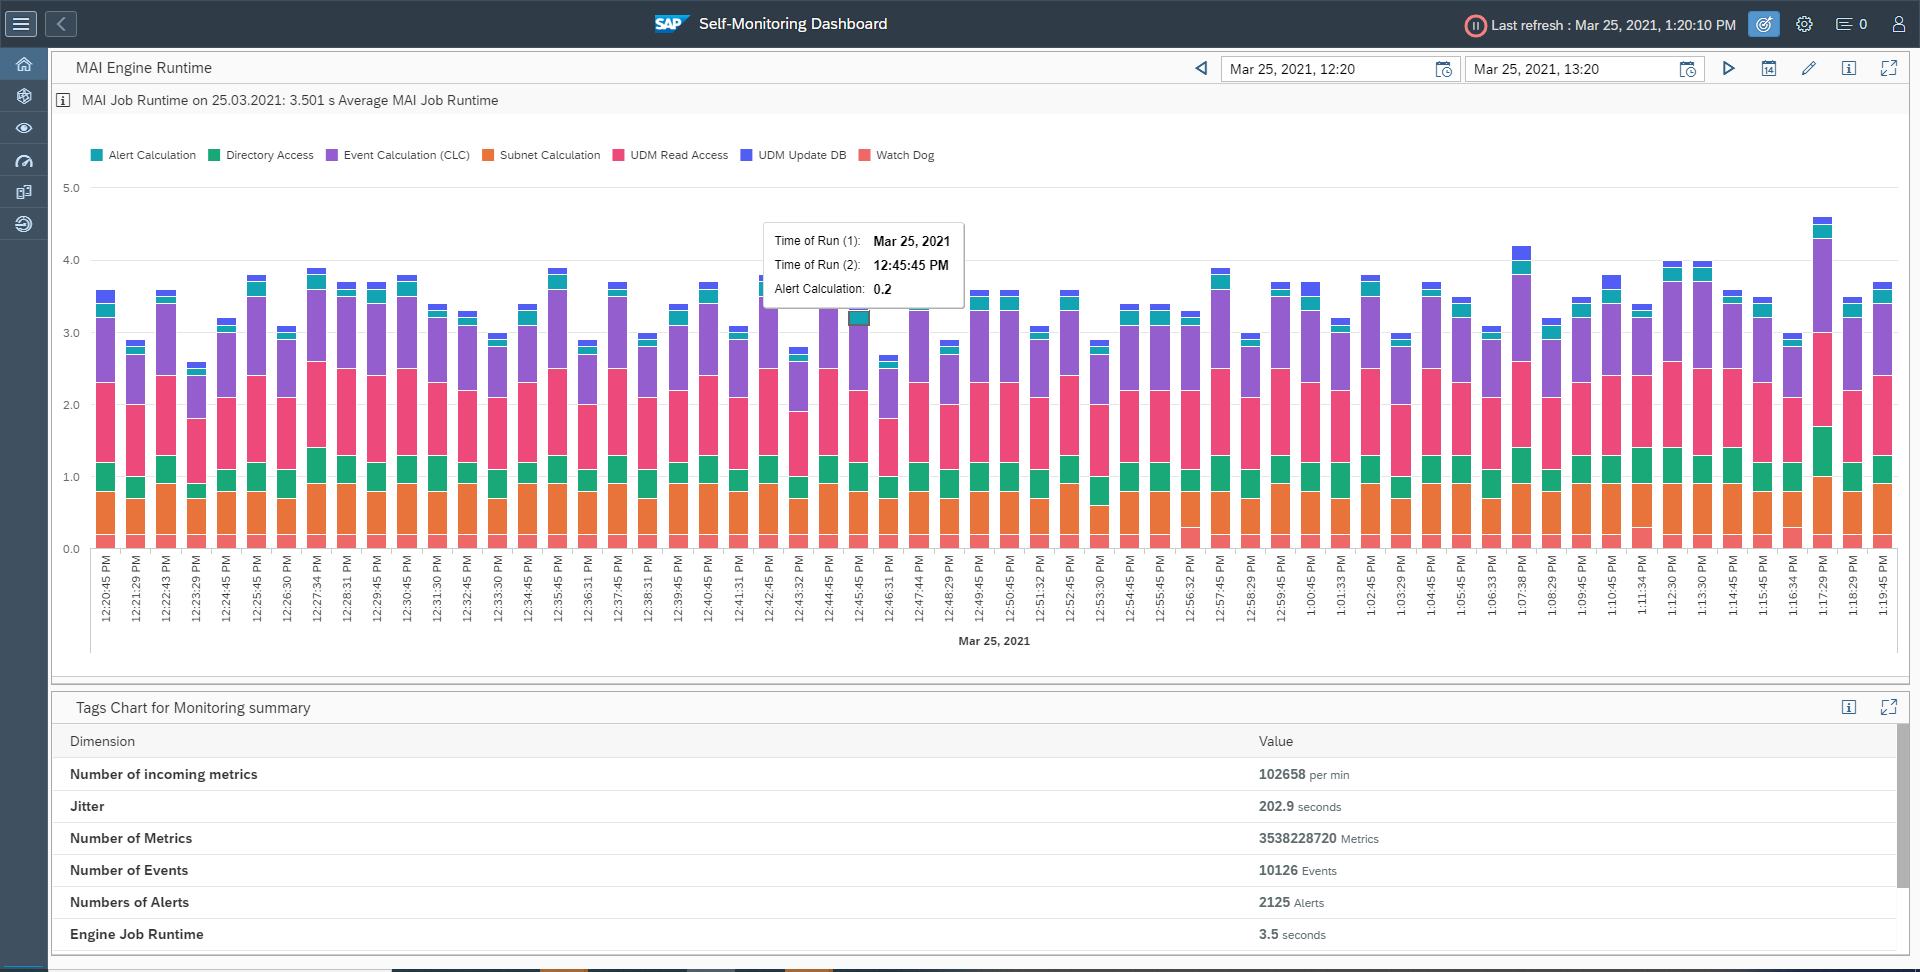
- How does the Cloud monitoring in SAP Focused Run look like?
- How much details and history can I see in SAP Focused Run interface monitoring?
- Can I link an Cloud monitoring event to and alert?
- Which Cloud monitoring scenarios are supported?
- How to monitor message to and from SAP CPI?
- How to setup the monitoring towards SAP CPI?
- How to monitor message to and from SAP Ariba?
- How to setup the monitoring towards SAP Ariba?
- How to setup alert notification from SAP BTP?
Cloud monitoring
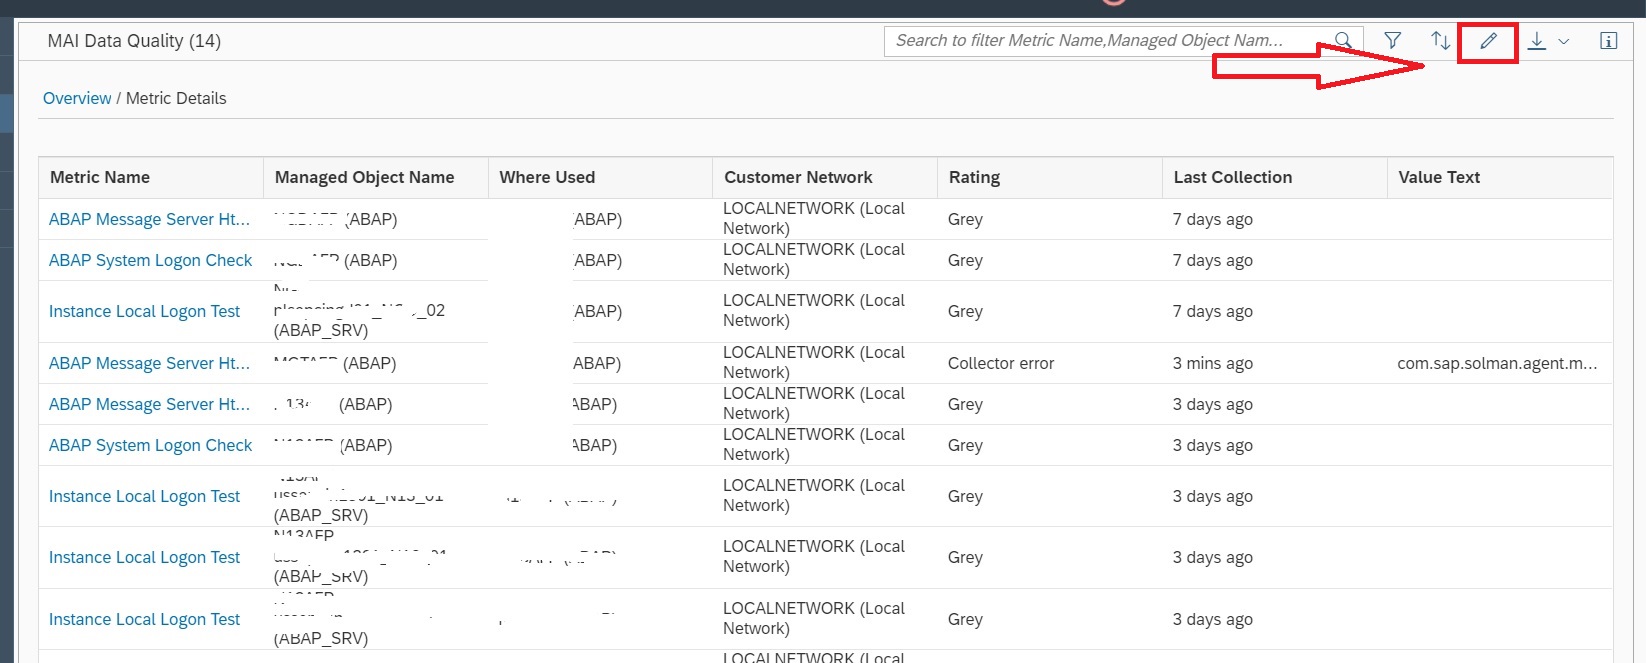
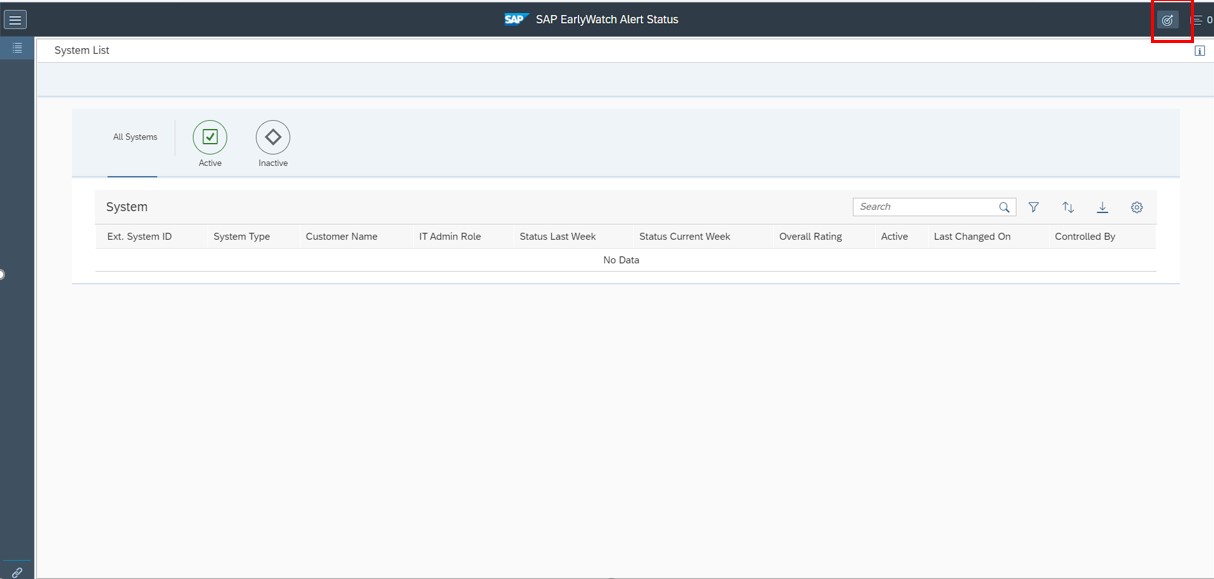
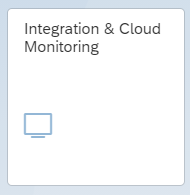
To start the cloud monitoring click on the Fiori tile:
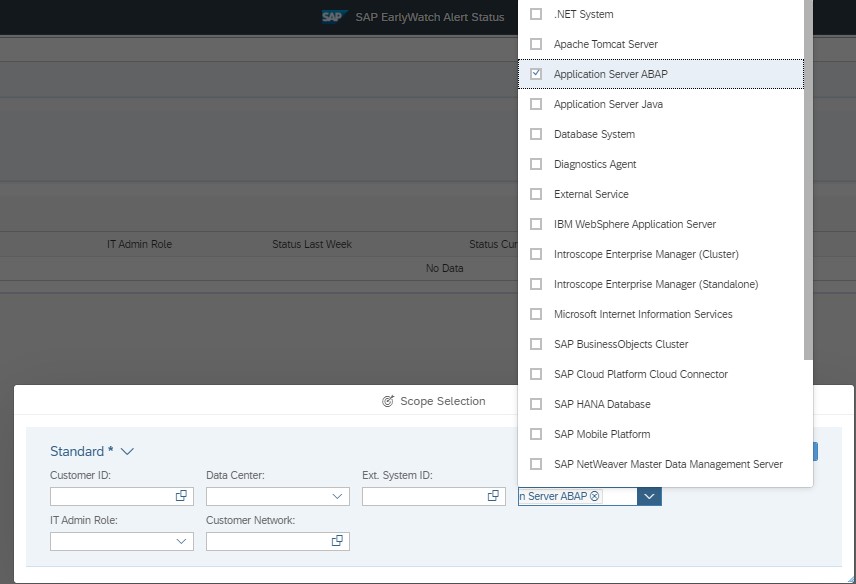
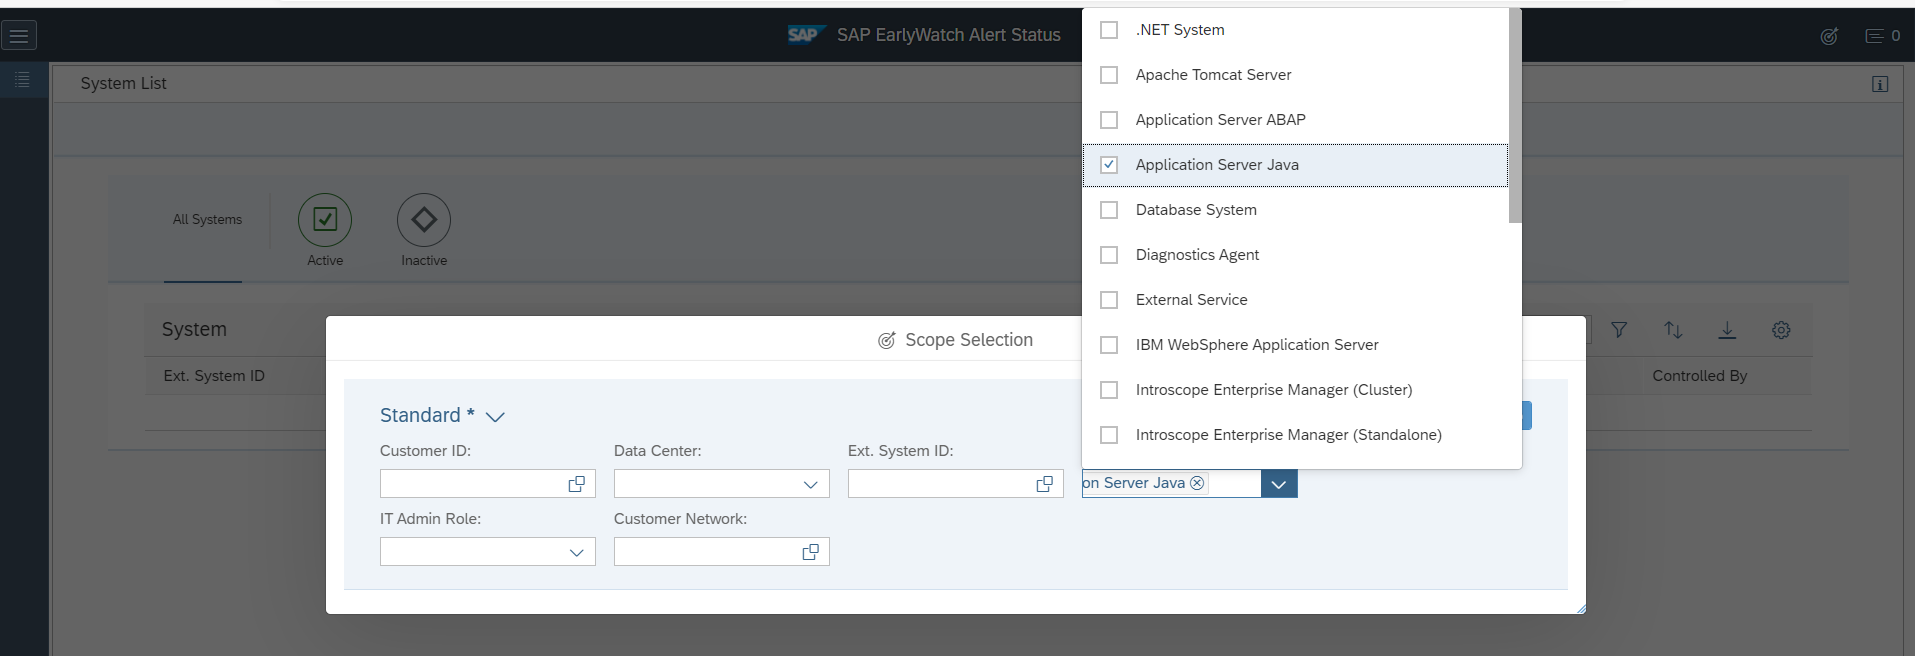
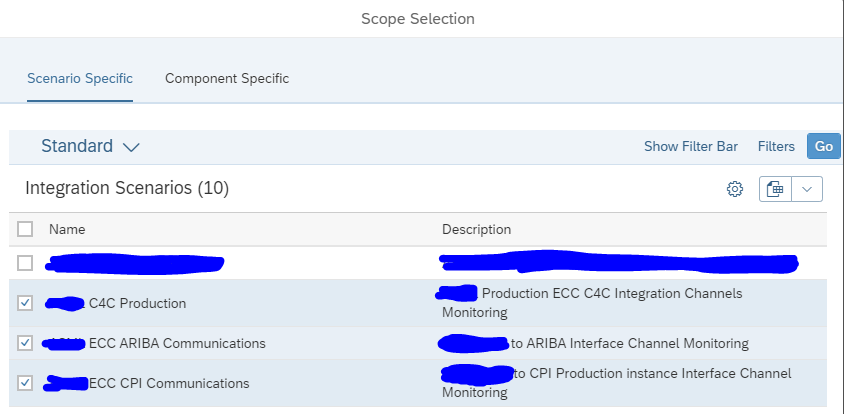
Select the cloud scenarios:
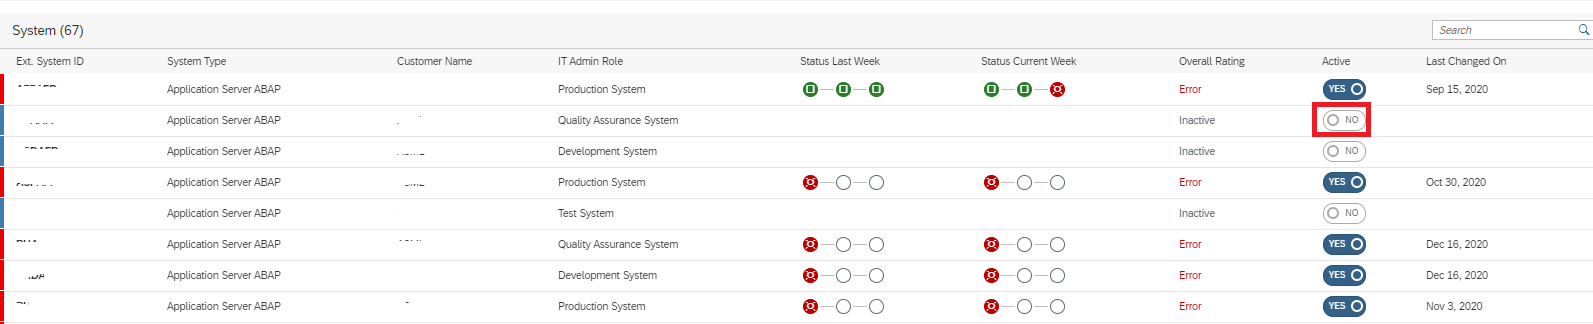
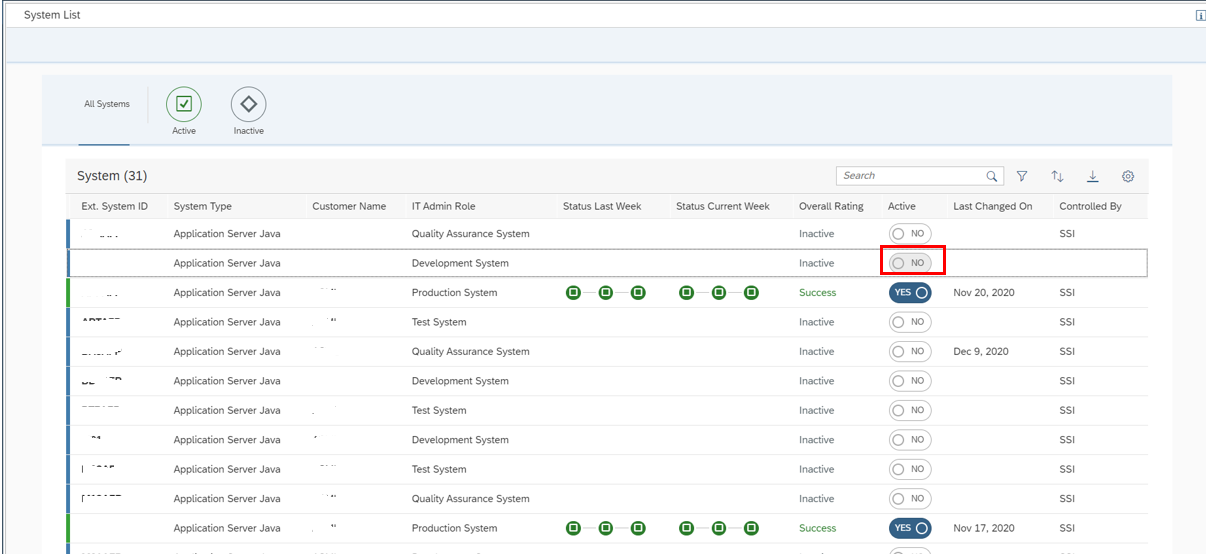
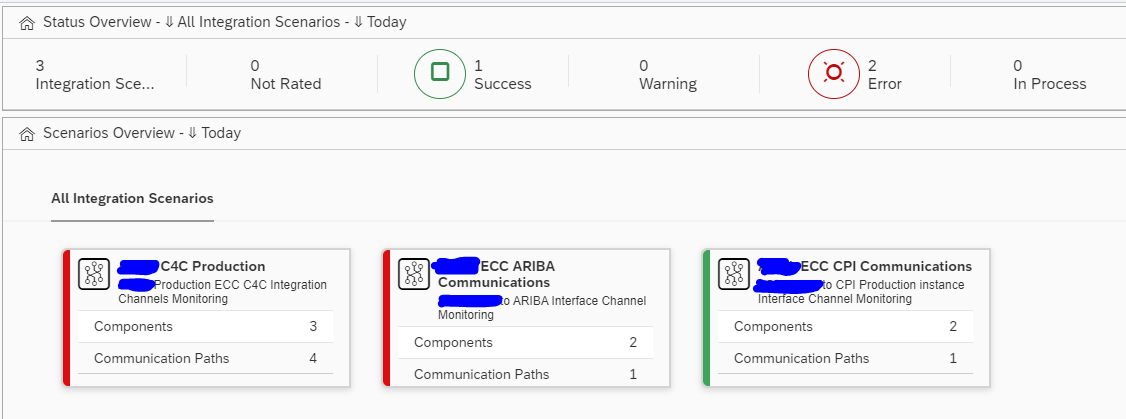
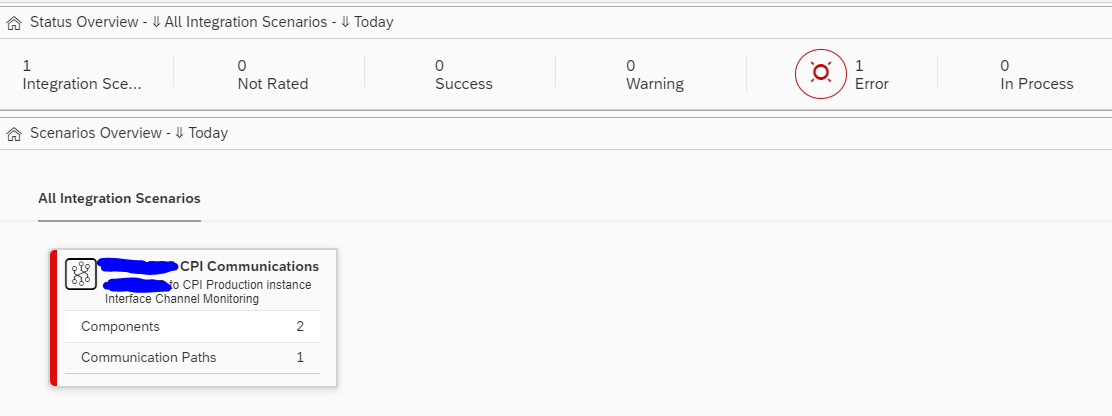
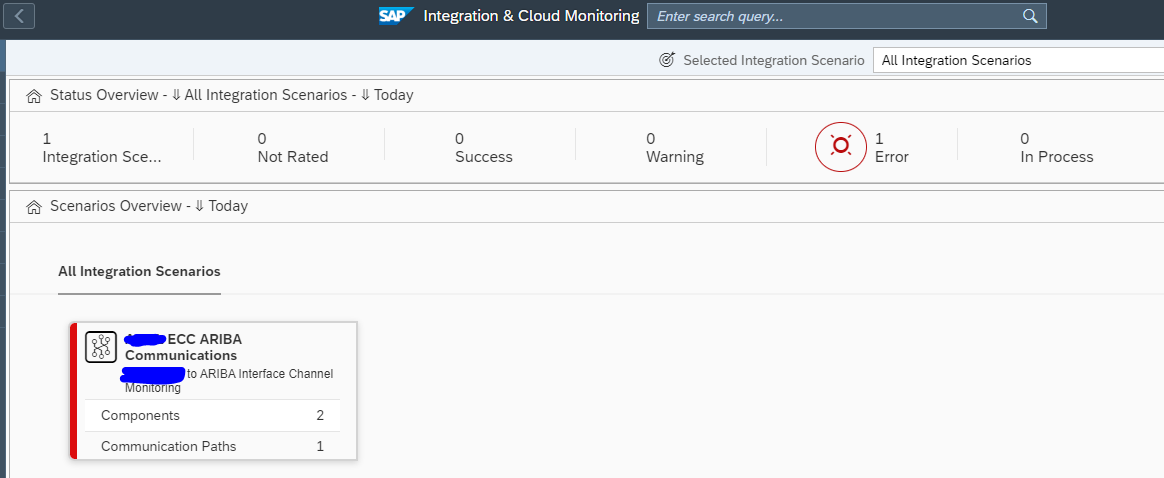
You now reach the scenario overview screen:
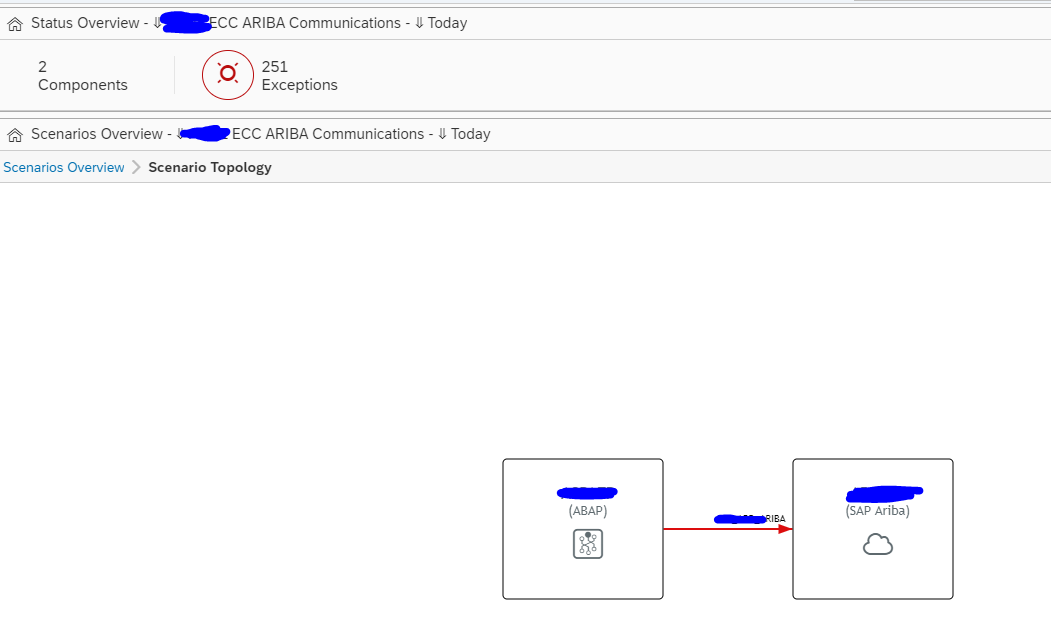
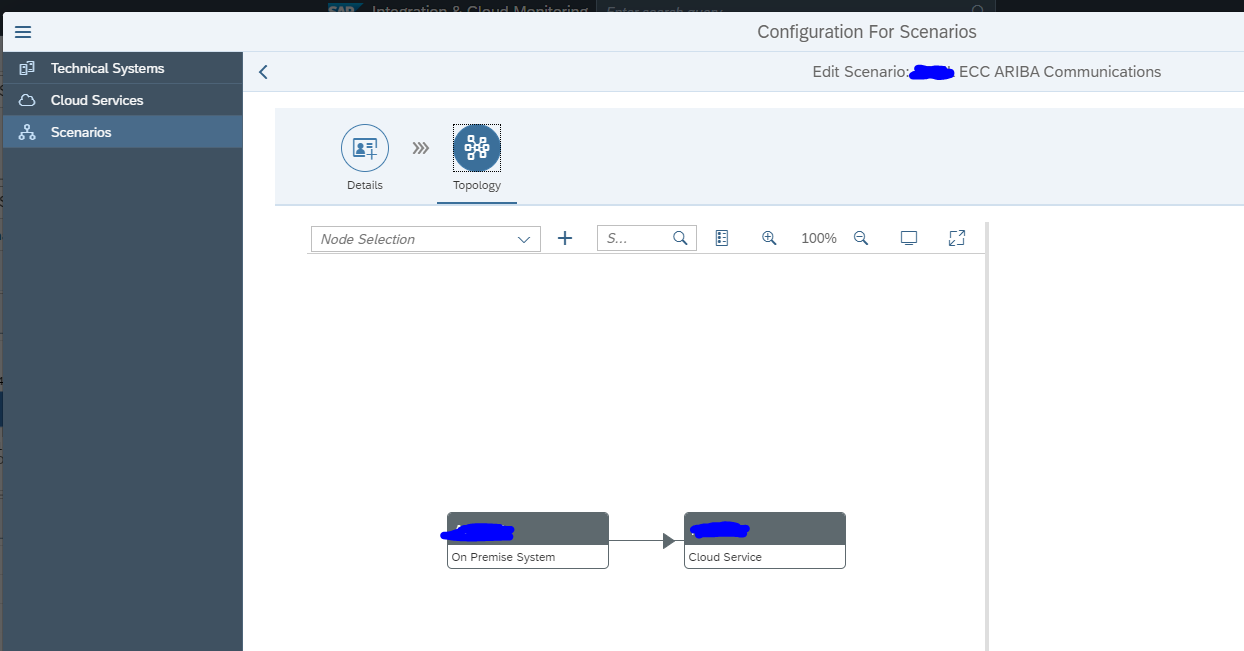
Click on the tile for details (we will take Ariba as example):
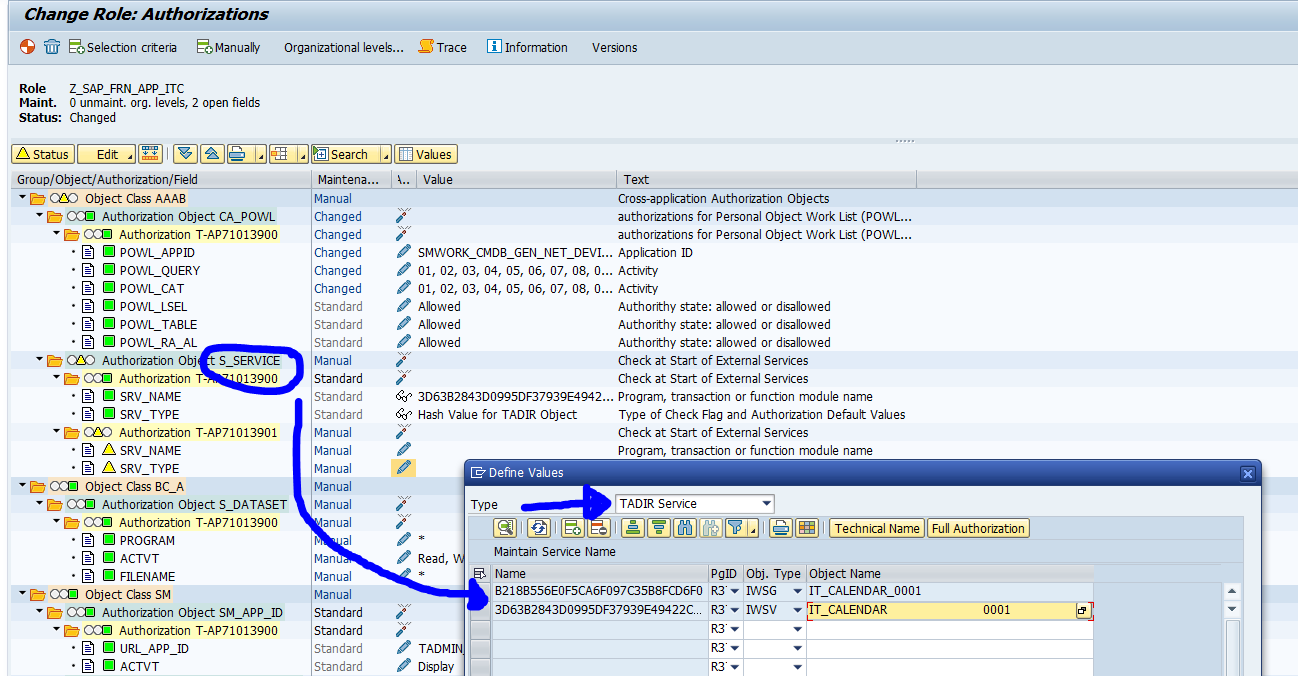
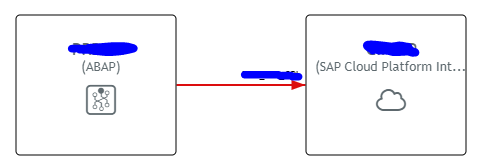
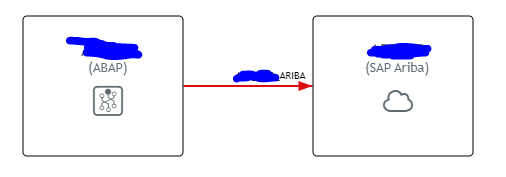
Click on the red line between the on premise and the cloud system:
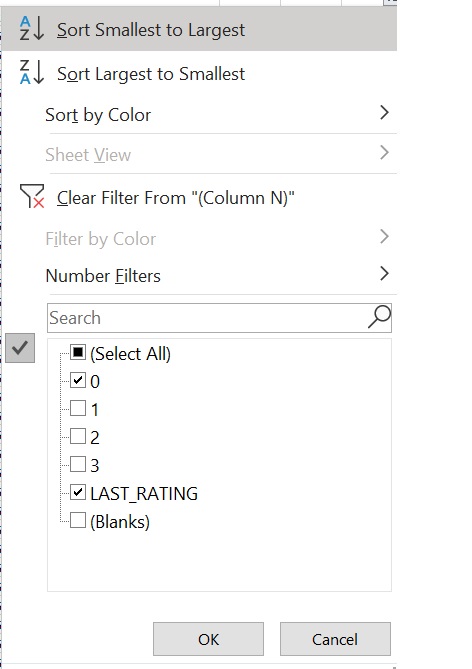
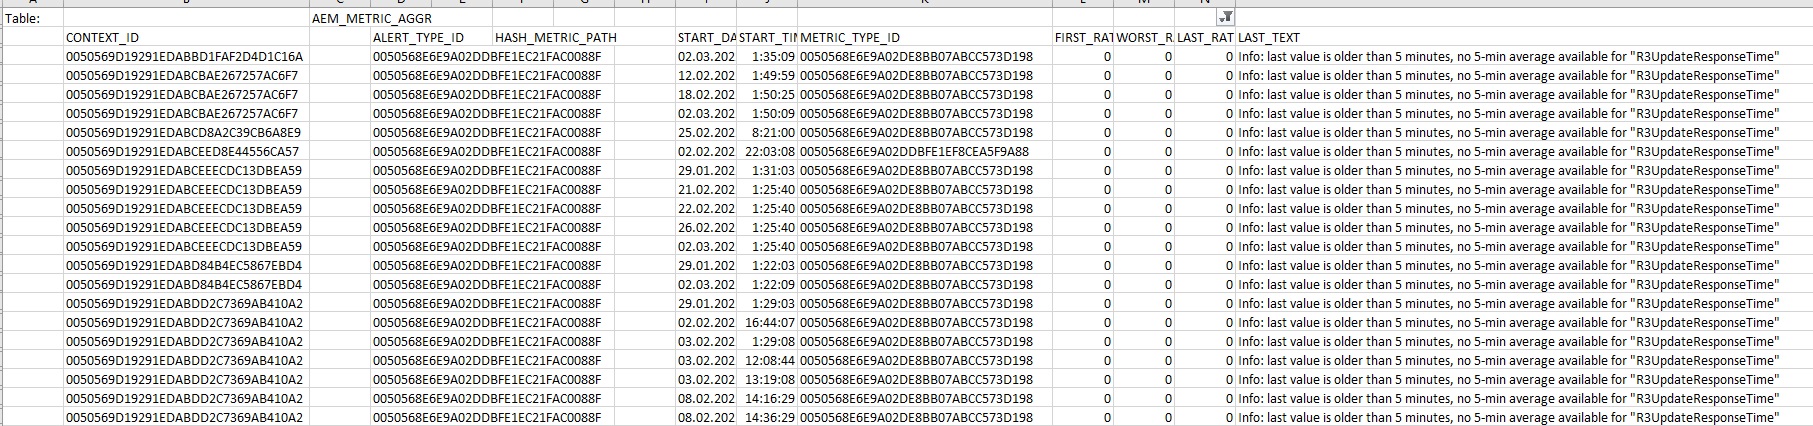
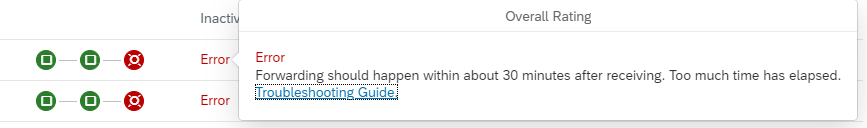
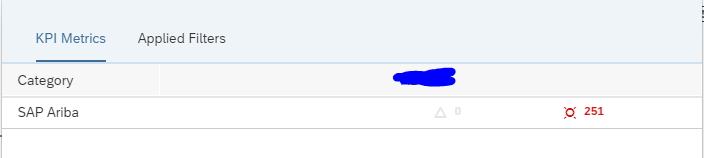
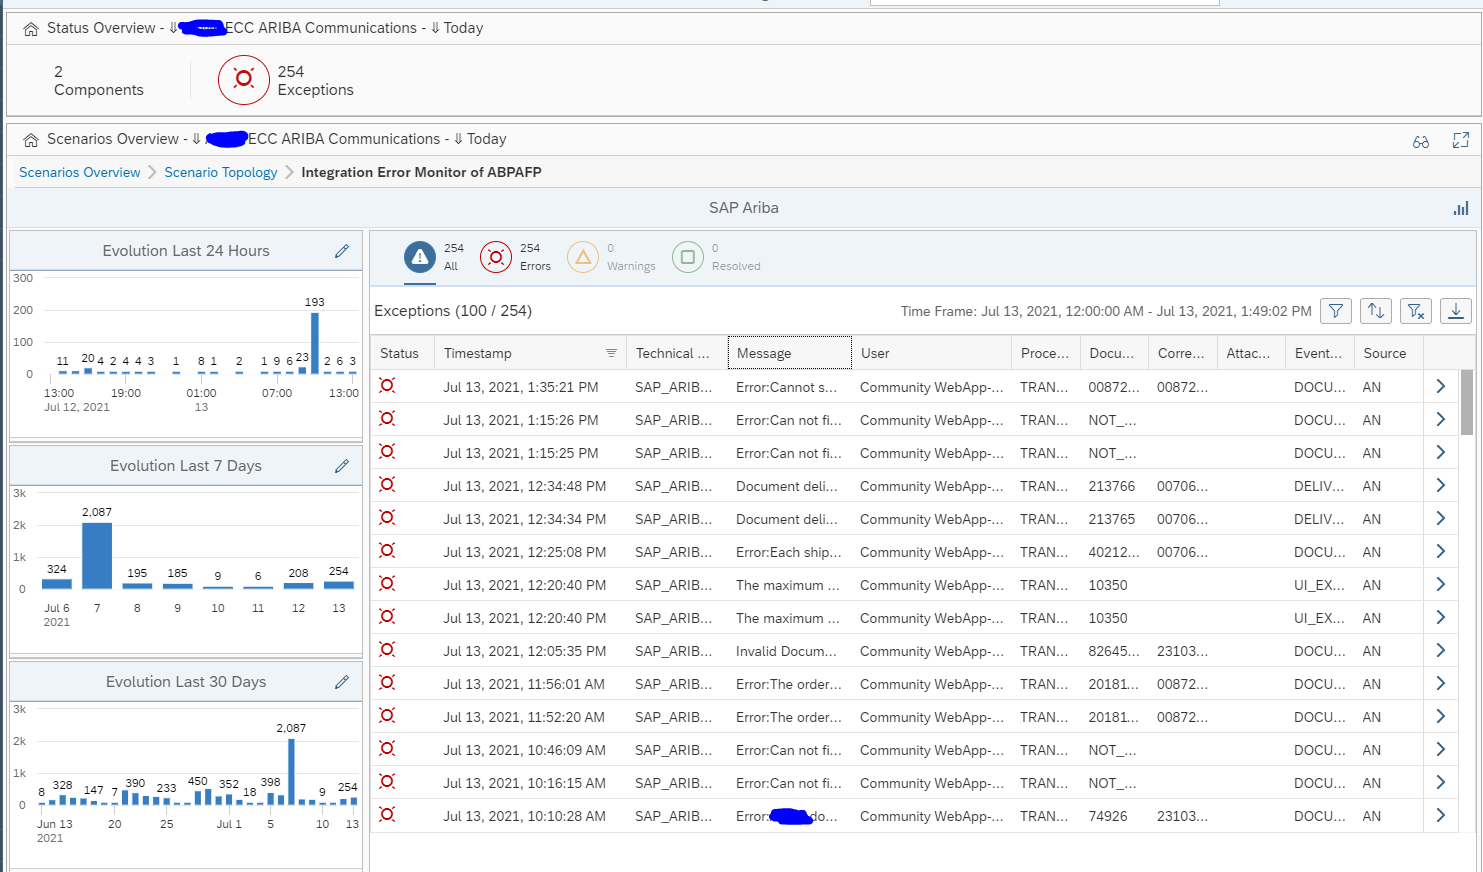
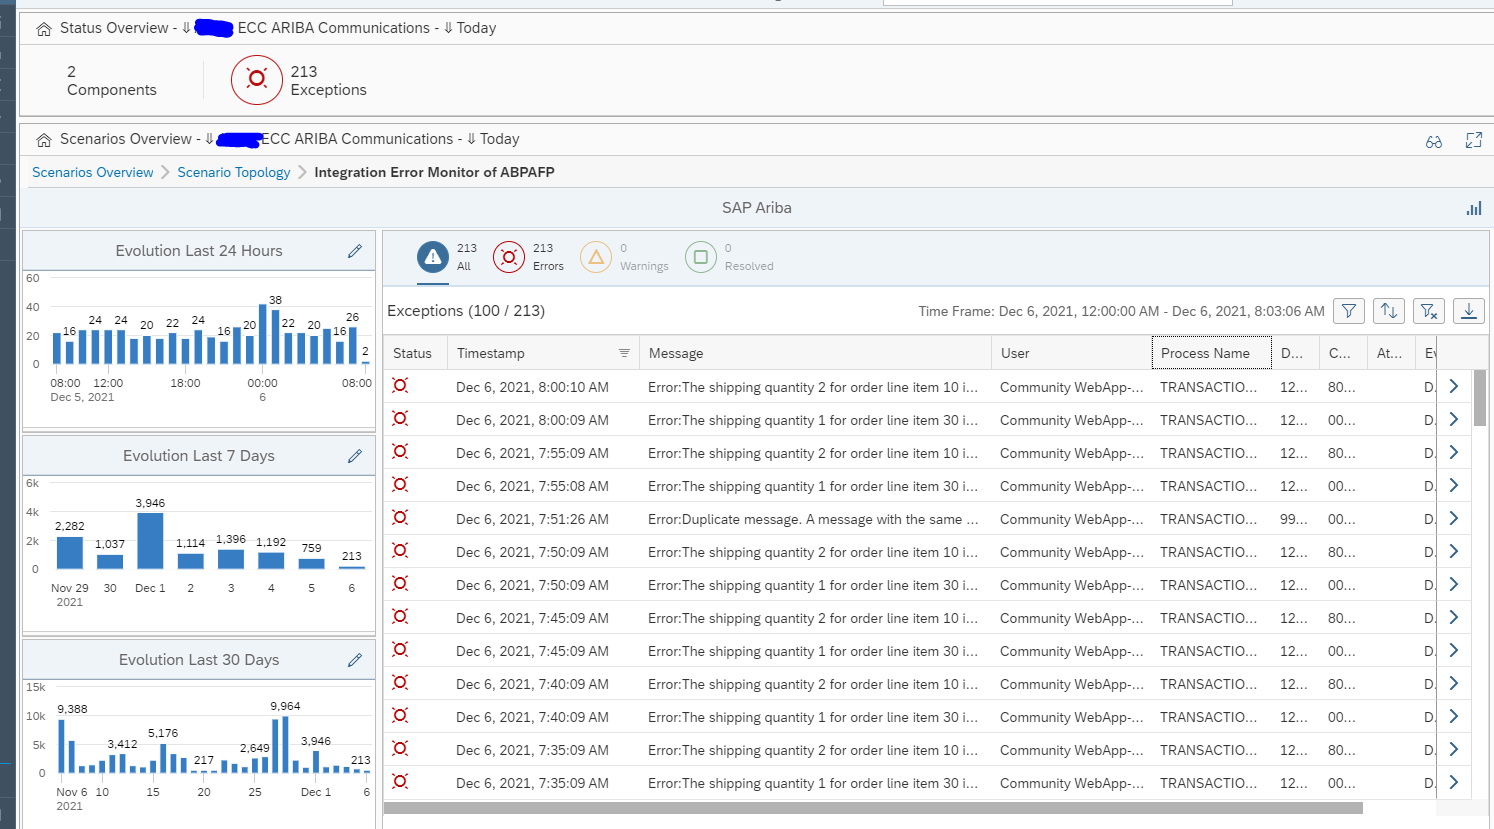
Click on the red errors number for the error overview:
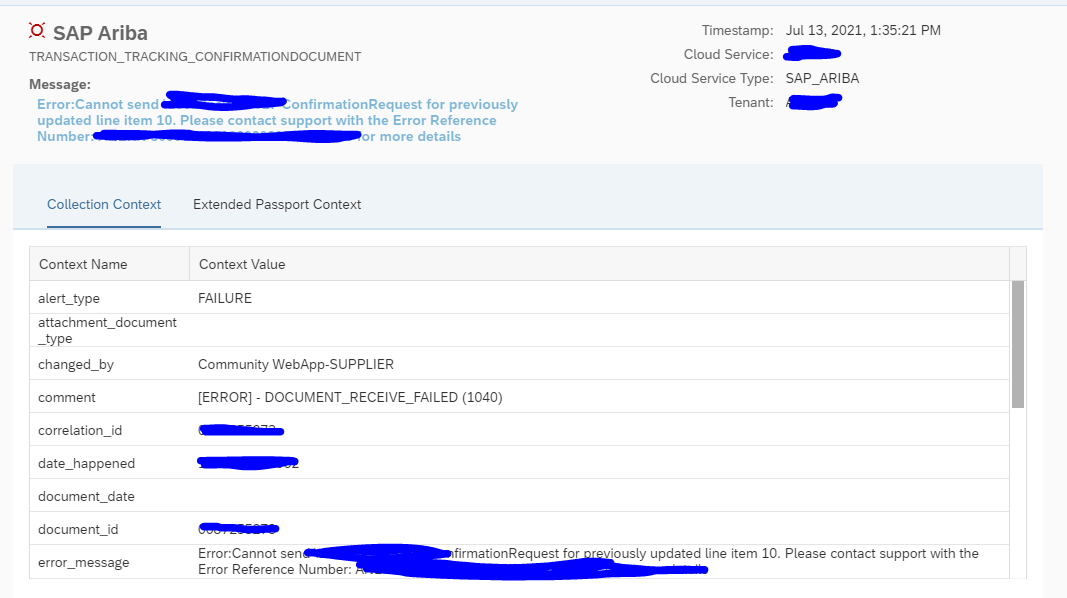
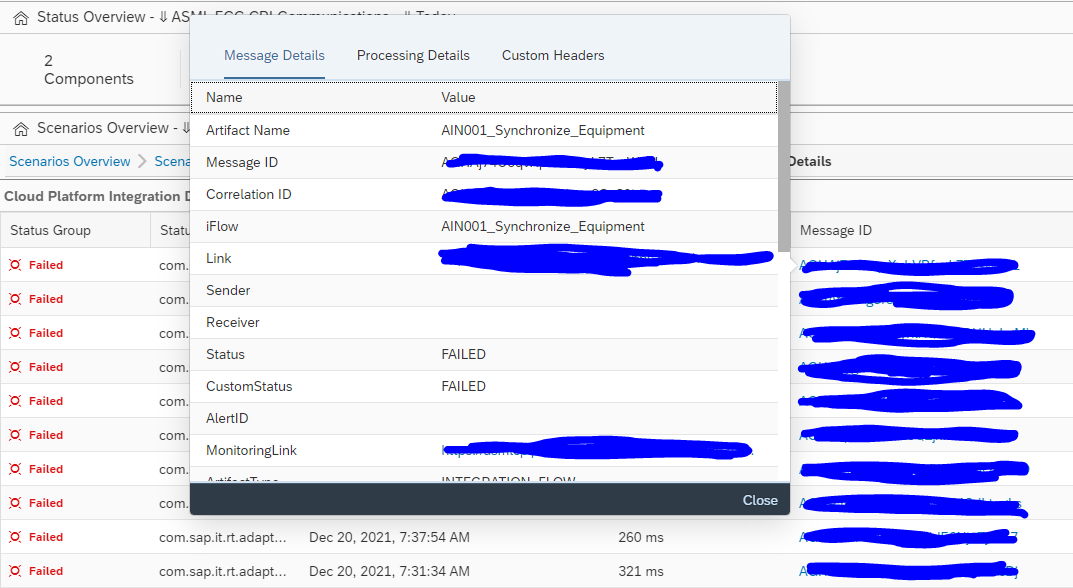
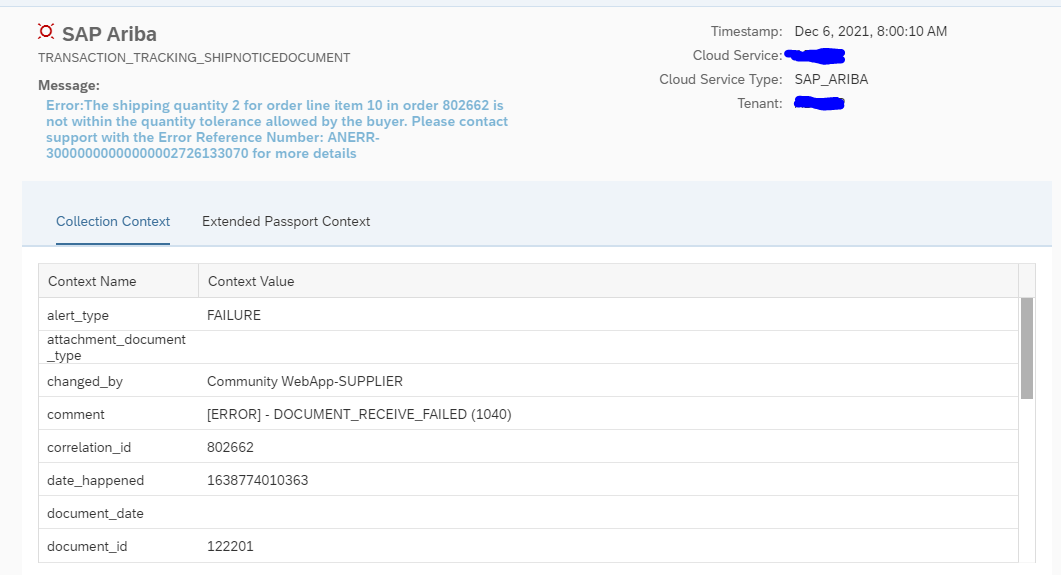
Click on specific error:
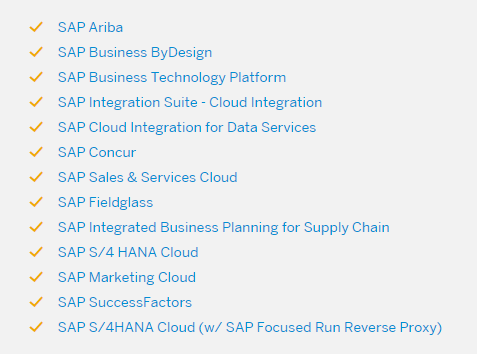
Supported cloud scenarios
Not all cloud products and scenarios of SAP are supported via SAP Focused Run Cloud monitoring. On the SAP Focused Run Expert Portal the following scenarios are currently published:
Read the scenario details carefully! Inside the details there might be less monitored than you were expecting.
CPI message monitoring
SAP Focused Run Cloud Monitoring can be used to monitor messages to and from the SAP BTP CPI solution. CPI stands for Cloud Platform Integeration.
End result of CPI message monitoring
The configuration of the scenario is described in the next chapter. We start explaining the end result.
Select the scenario and the overview tile appears:
Click on the card to go to the scenario topology:
Zoom into the overview screen of the errors:
And drill down to any specific error:
Set up of the CPI monitoring scenario
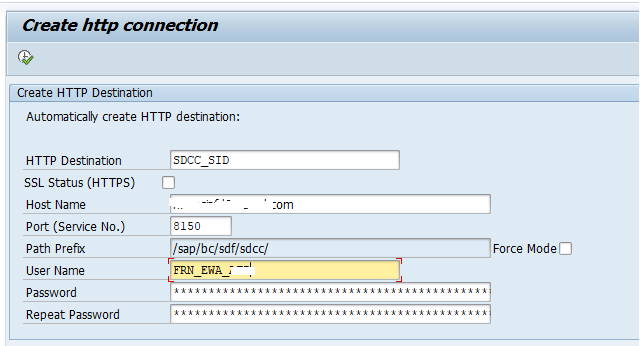
llow the steps from the SAP expert portal for CPI monitoring to setup the STRUST in SAP Focused Run for the CPI URL.
Validate in the SAP Focused Run ABAP stack that these two parameters are set in RZ11:
- icm/HTTPS/client_sni_enabled = TRUE
- ssl/client_sni_enabled = TRUE
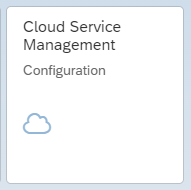
If this is done, go to the cloud setup FIORI tile:
Add a new end point for CPI:
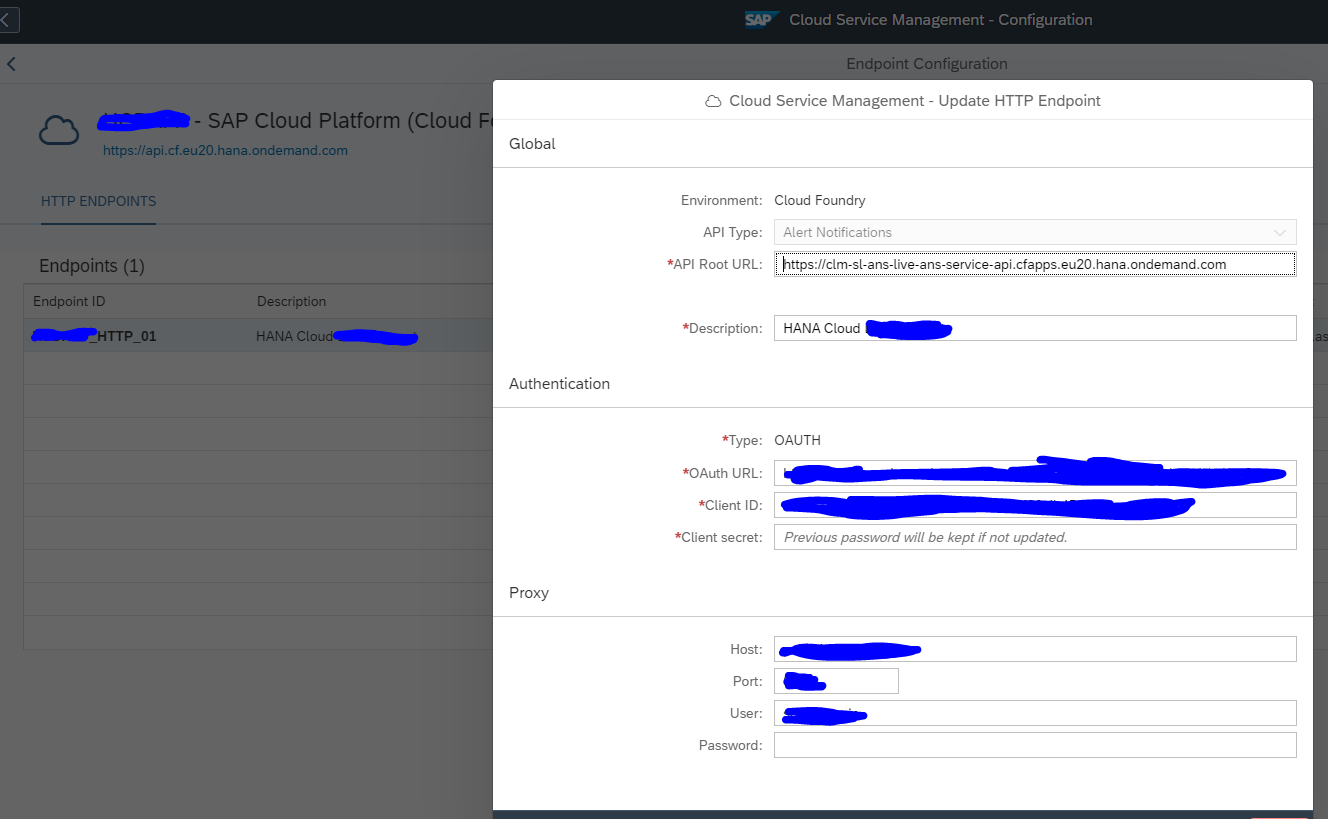
The application key, client ID and client secret will need to be provided by the basis person or functional consultant maintaining the CPI interface configurations on the BTP cloud. Depending on the security setup, a proxy is required as well.
After entering the details check the connection that connectivity is working as expected.
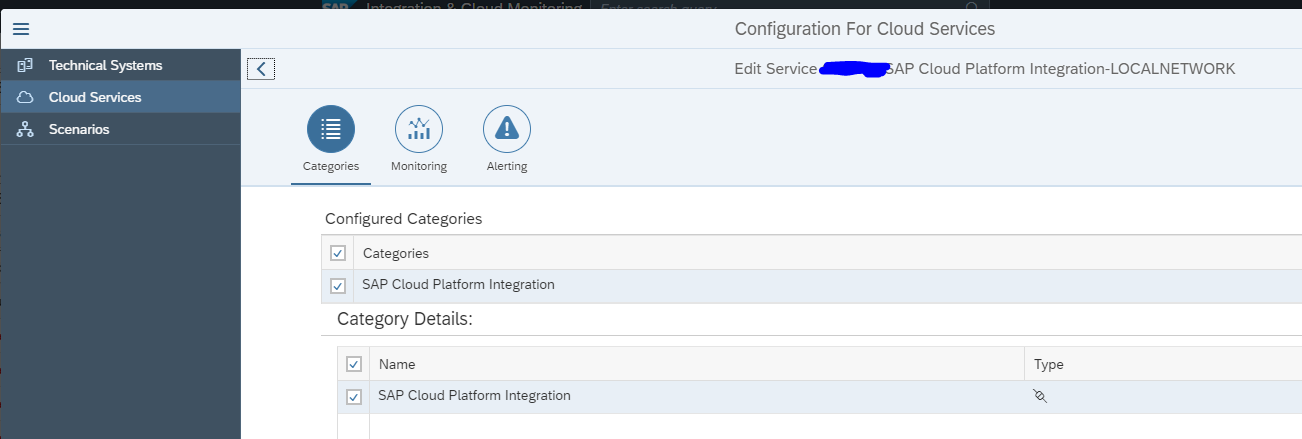
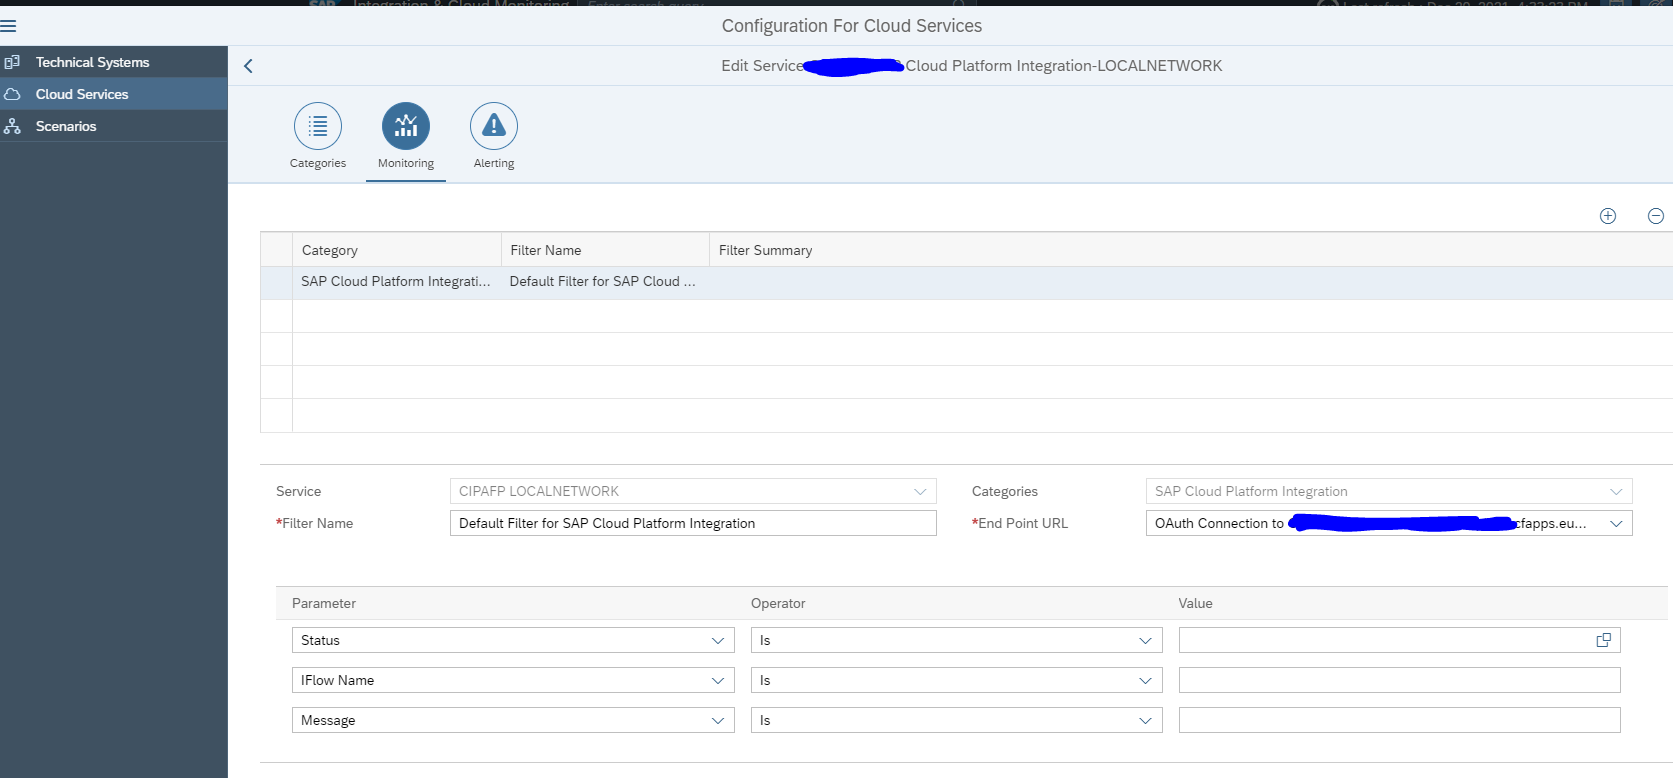
Now go to the configuration of the interface scenario and create a new cloud service for Cloud Platform Integration:
On the monitoring screen specify filters for specific IFlows if requiered:
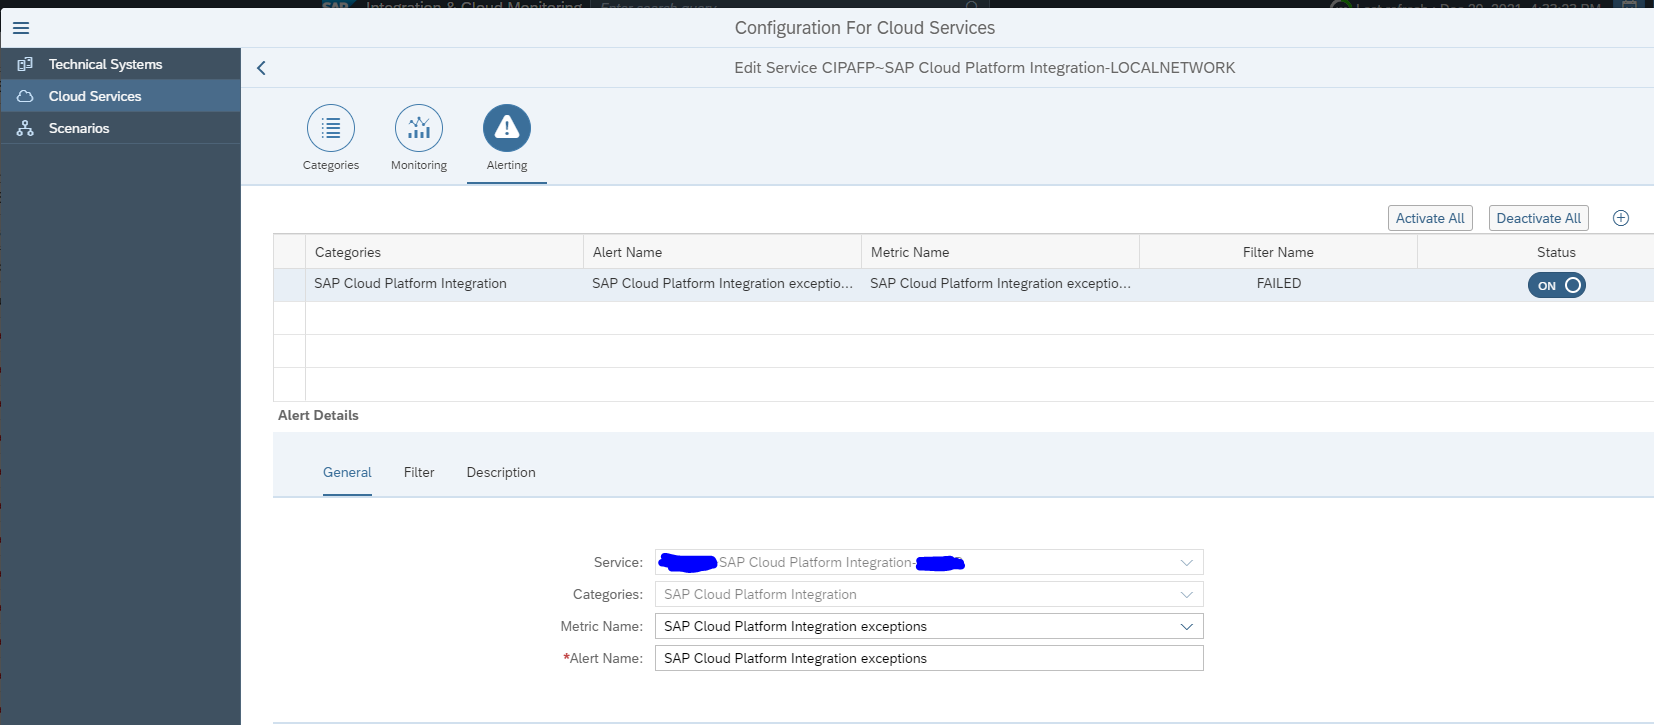
On the alerting tab you can set up any alerting wanted:
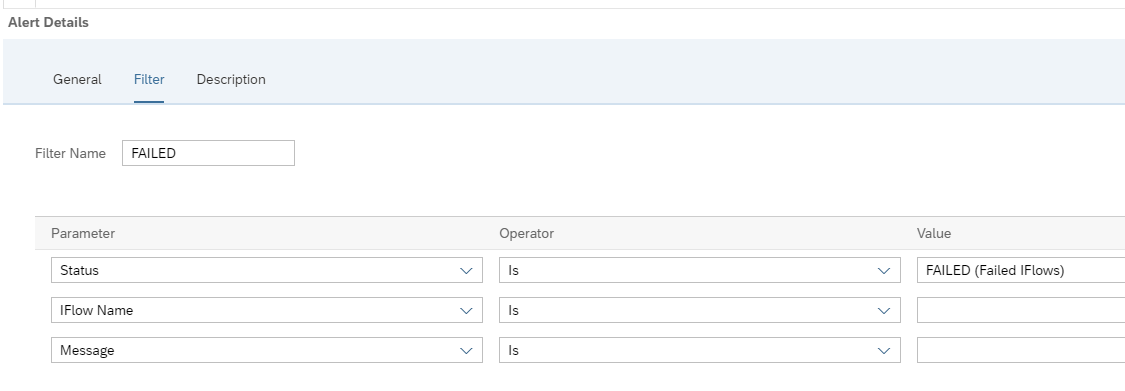
Set the filter for alerting (in this case all failed flows):
Assign alert receivers and make sure everything is saved and activated.
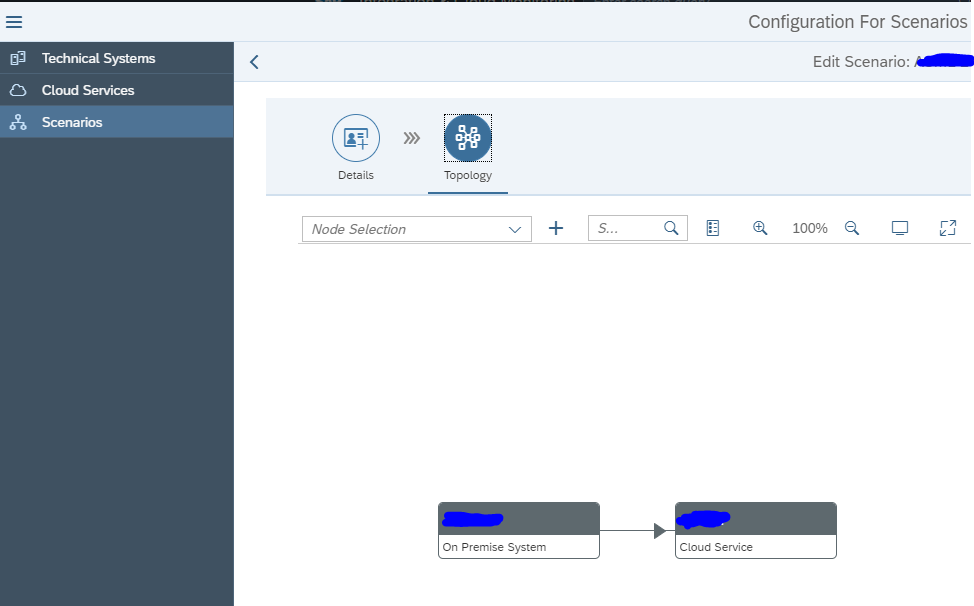
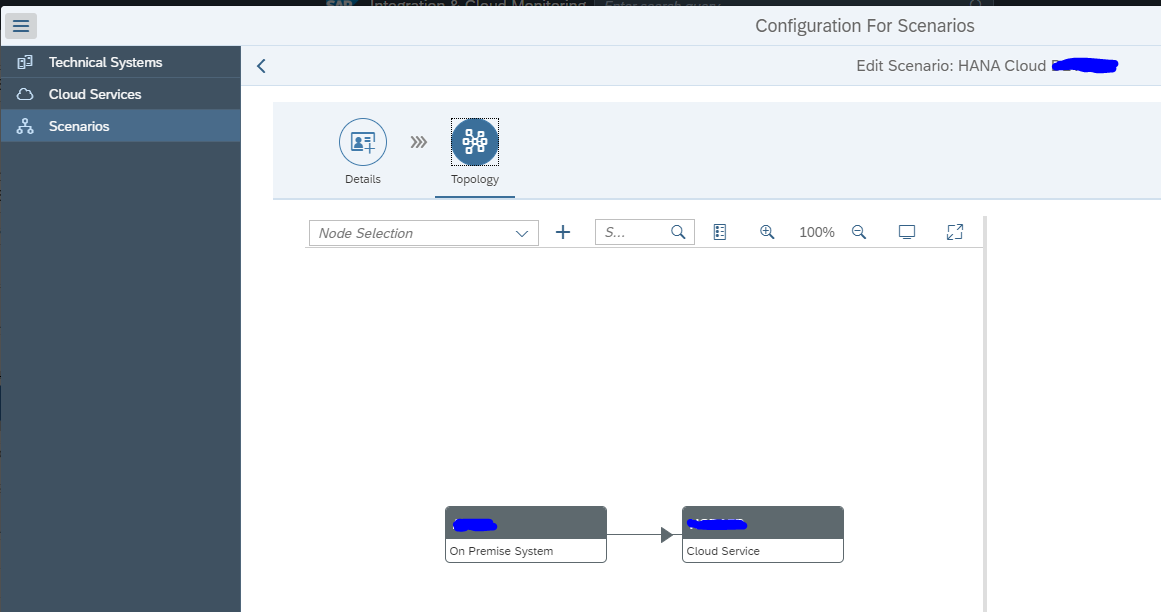
Now you can model the scenario graphically as well:
Cloud monitoring: Ariba
SAP Focused Run Cloud Monitoring can be used to monitor messages to and from the Ariba solution.
End result of Ariba cloud monitoring
The configuration of the scenario is described in the next chapter. We start explaining the end result.
Select the scenario and the overview tile appears:
Click on the card to go to the scenario topology:
Click on the red line to zoom into the communication error details:
Click on the message to zoom into the details:
Set up of the Ariba monitoring scenario
ollow the steps from the SAP expert portal for Ariba monitoring to setup the STRUST in SAP Focused Run for the Ariba URL.
Validate in the SAP Focused Run ABAP stack that these two parameters are set in RZ11:
- icm/HTTPS/client_sni_enabled = TRUE
- ssl/client_sni_enabled = TRUE
If this is done, go to the cloud setup FIORI tile:
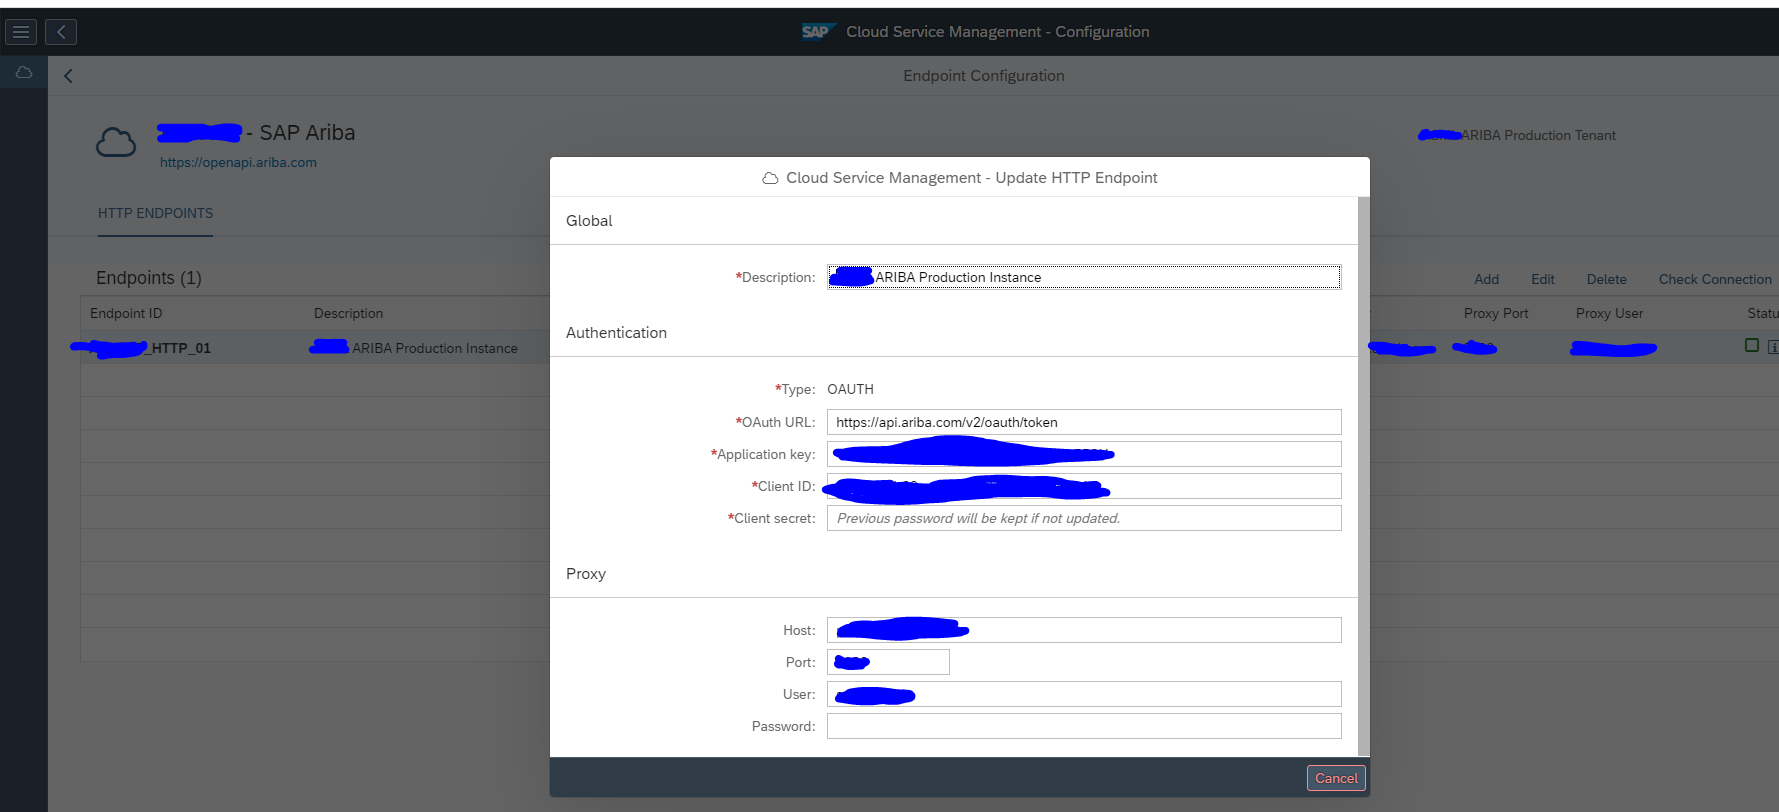
Add a new end point for Ariba:
The application key, client ID and client secret will need to be provided by the basis person or functional consultant maintaining the Ariba interface configurations on the Ariba cloud. Depending on the security setup, a proxy is required as well.
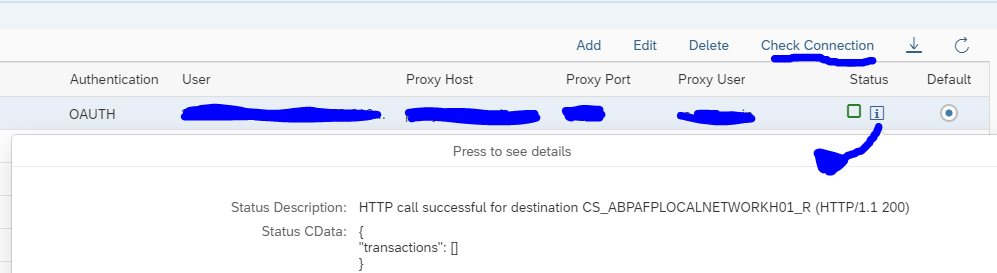
After entering the details check the connection:
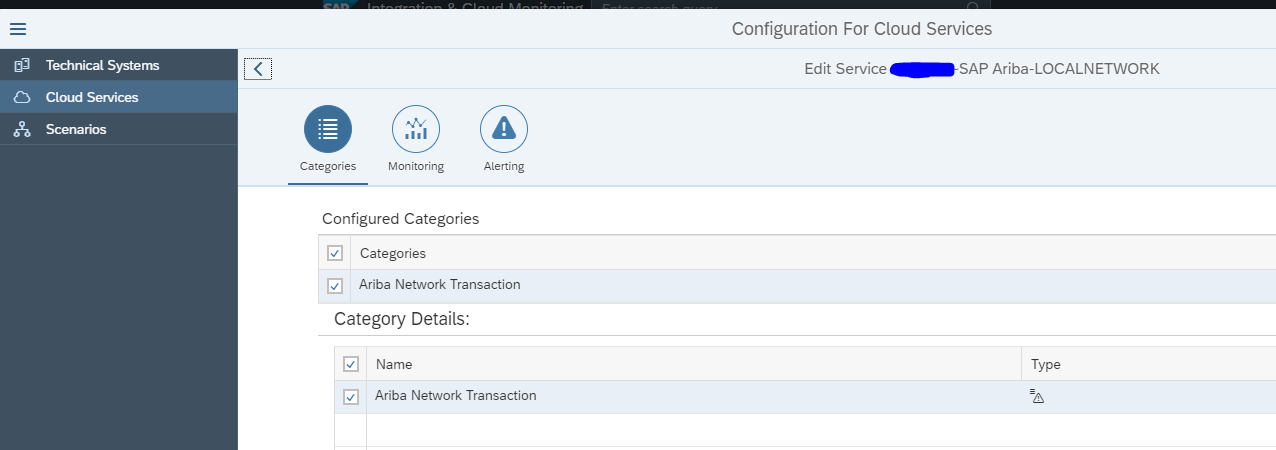
Now go to the configuration of the interface scenario and create a new cloud service for Ariba Network Transaction:
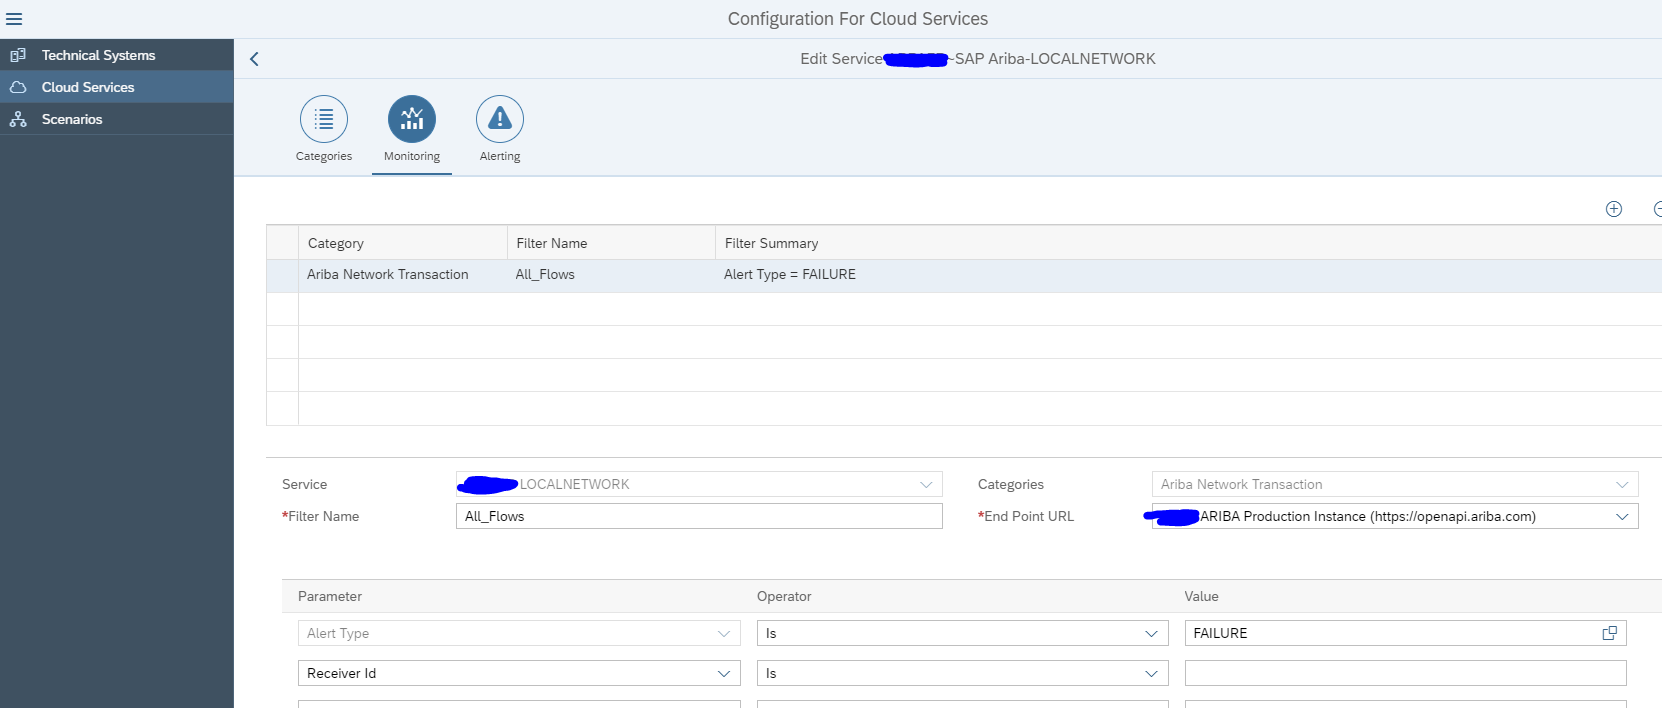
On the Monitoring tab connect to the end point create above and set the wanted filters:
If you want, you can also set up alerting in the third tab.
Save and activate the setup.
Now you can model the scenario graphically as well:
Alert notification from BTP
The BTP platform has a function called Alert Notification. This is a generic function that can be used to send alerts. It can be used to send alerts from applications, but also to send alerts from the HANA Cloud database.
SAP Focused Run can pick up these alert notifications form the BTP platform. From there Focused Run can be used to further relay the alert to notification teams.
Setup of the scenario
First you need to prepare your BTP environment to allow SAP Focused Run to collect data from the Alert Management application from your tenant and subaccount. This will give you the URL, client ID and client secret (be careful this is only shown once). To do this, follow the steps on the SAP Focused Run expert portal in this link.
For the setup of the scenario in SAP Focused Run, go to the FIORI tile for cloud setup:
Set up the OAUTH end point:
After the setup save the details and test the connection.
Now this end point can be used in the scenario setup.
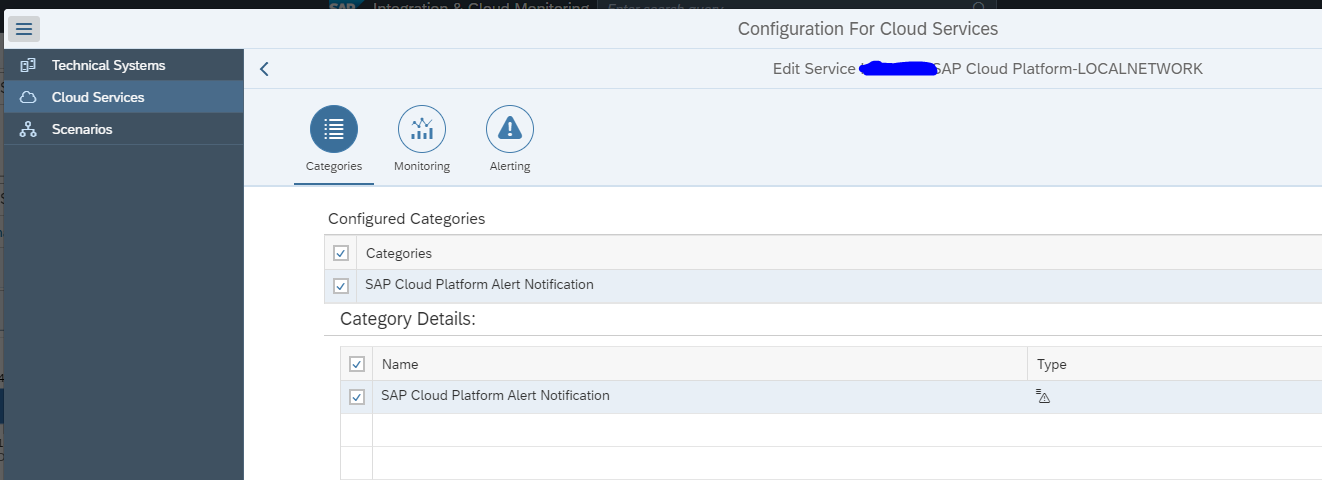
In the Scenario configuration create the Cloud Service and select the SAP Cloud Platform Alert Notification Service:
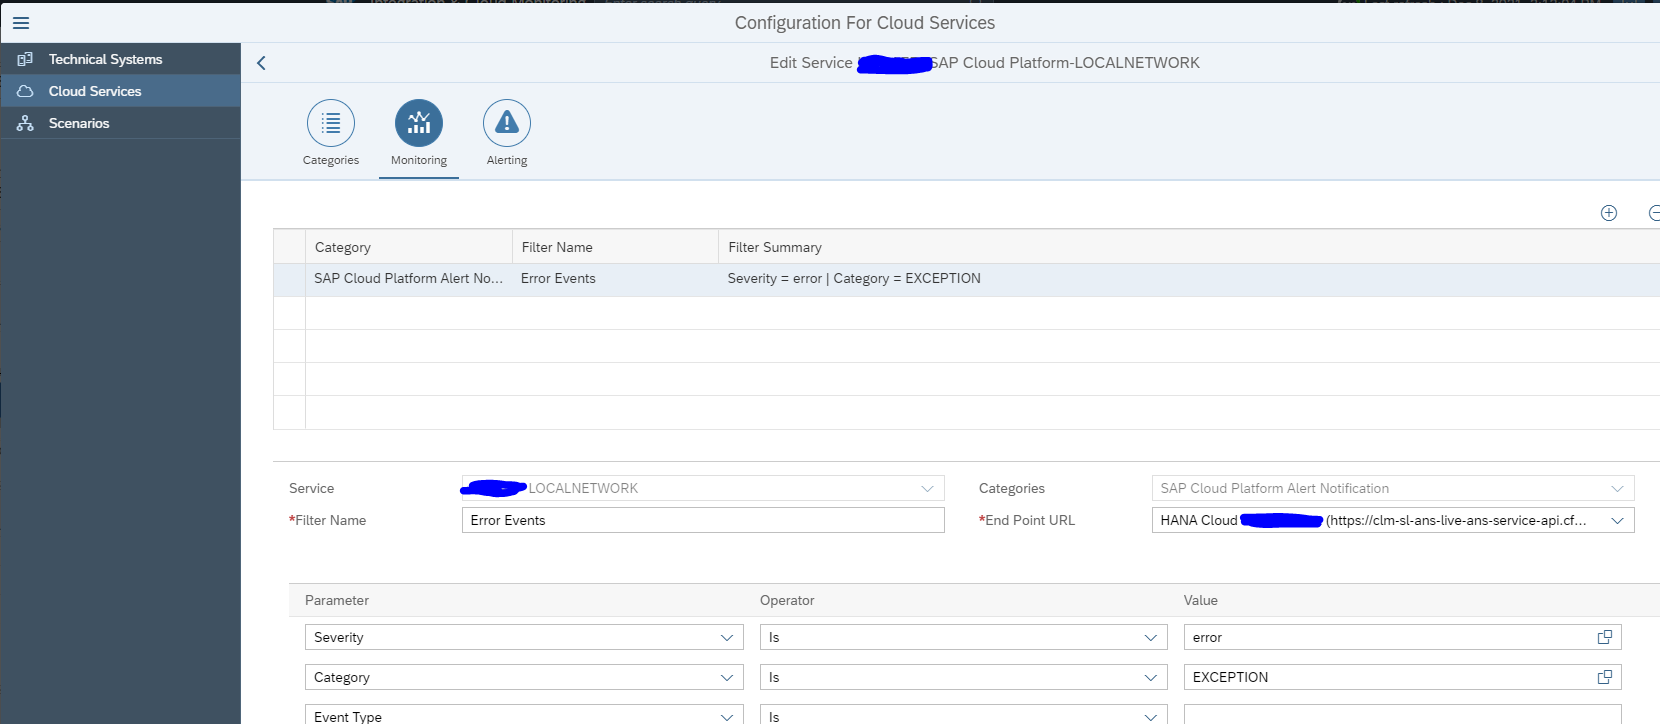
In the monitoring details set the Endpoint you just created and filter on the events:
In the third tab Alerting you can set up the alerts if wanted.
Save and activate.
In the scenario modelling you can now use an on premise system and the Cloud Service you set up above to model a graphical scenario:
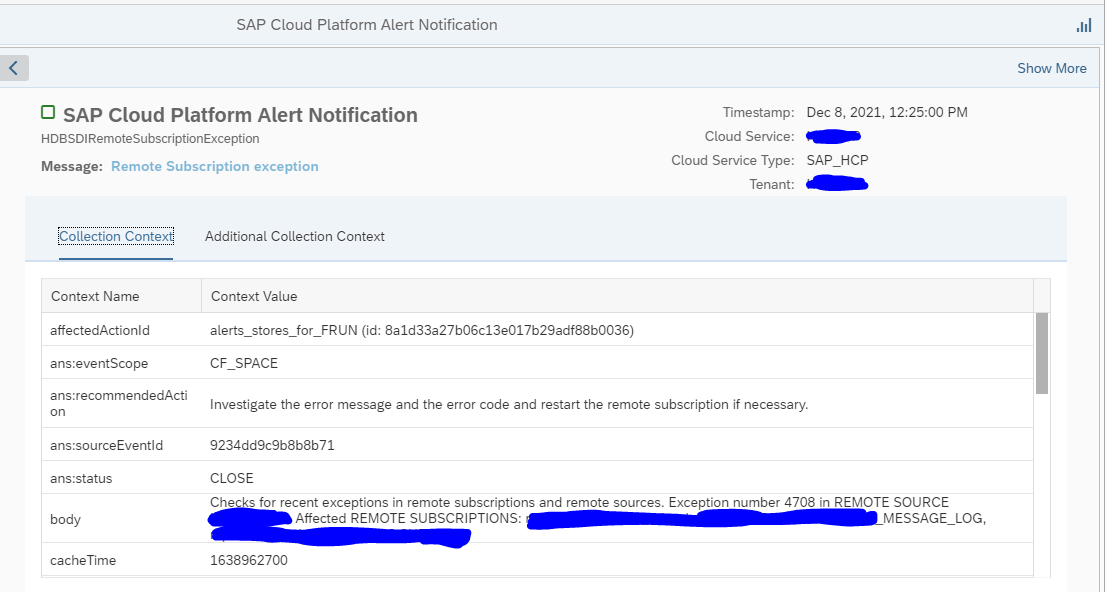
End result of alert notification from BTP
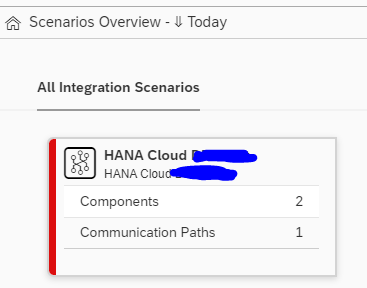
Select the configured scenario:
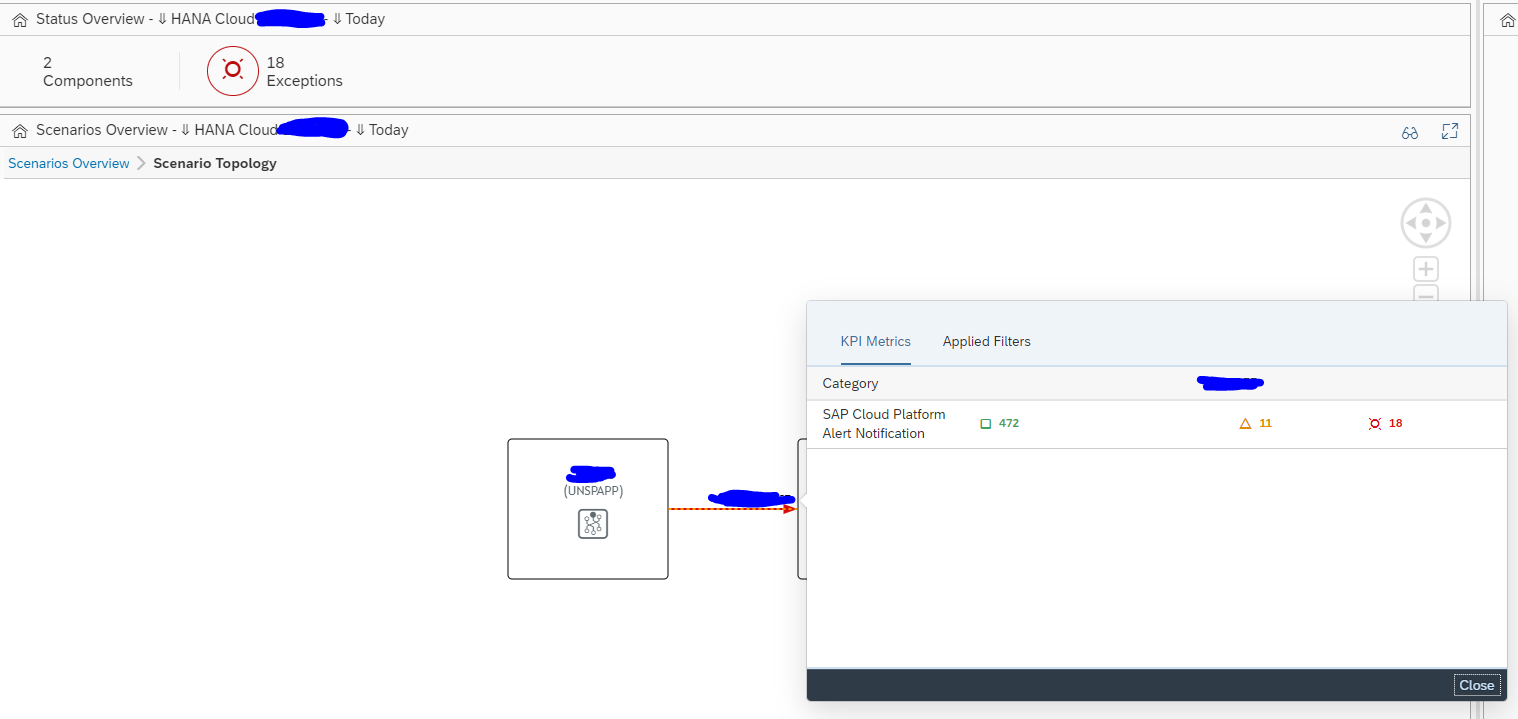
In this case we have setup the alert notification for HANA Cloud. Click on the card tile for details, and click on the interface line:
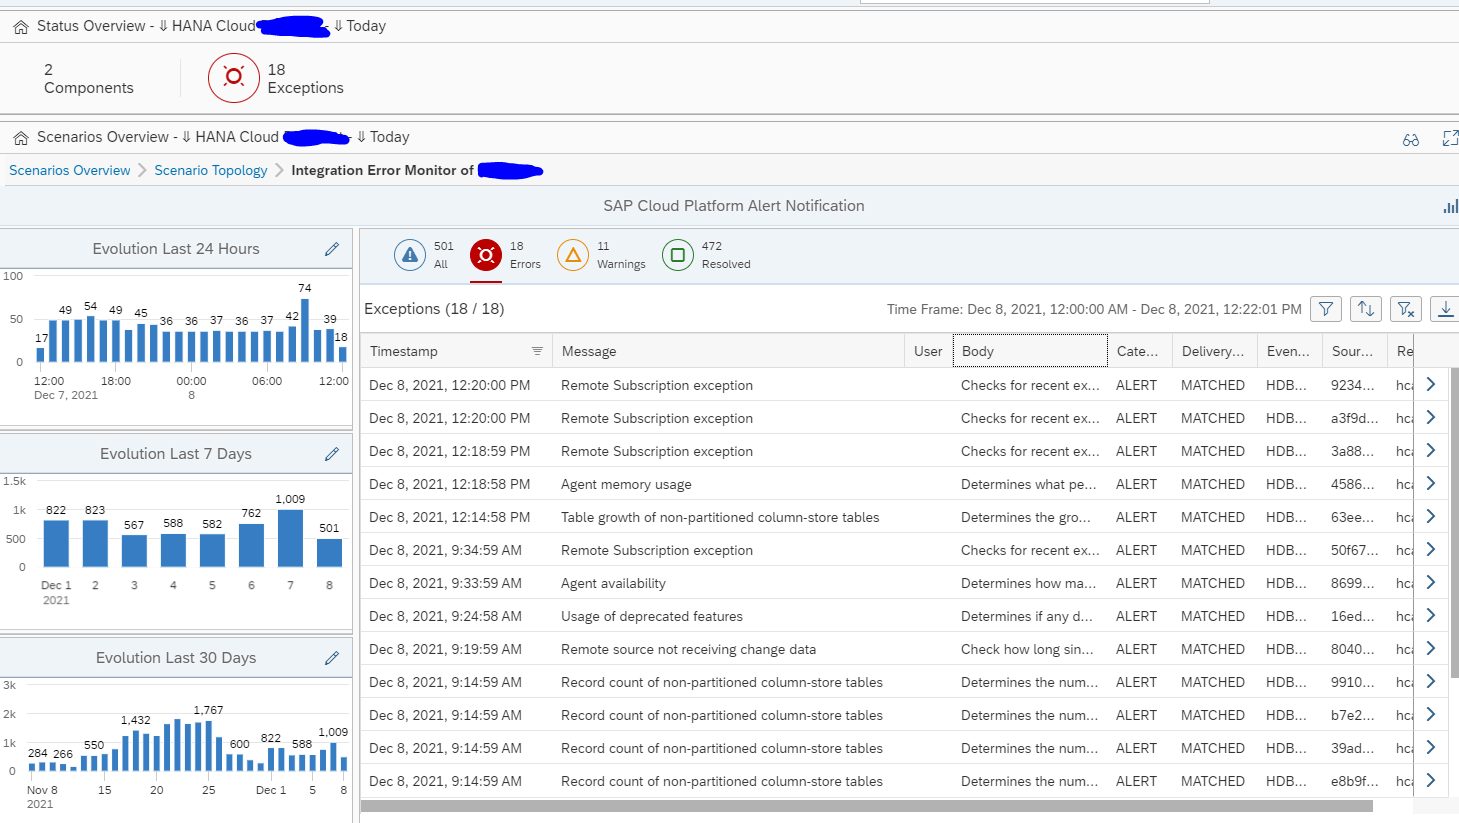
Now select the errors and the overview screen opens:
Click on a single line to go to the specific error details:
<< This blog was originally posted on SAP Focused Run Guru by Frank Umans. Repost done with permission. >>