When protecting SAP landscape with SCN encryption on GUI and RFC, there are 2 parameters that can block all not-encrypted traffic: snc/only_encrypted_rfc and snc/only_encrypted_gui.
Before setting these parameters, you first want to know which interfaces and GUI connections.
Logging settings
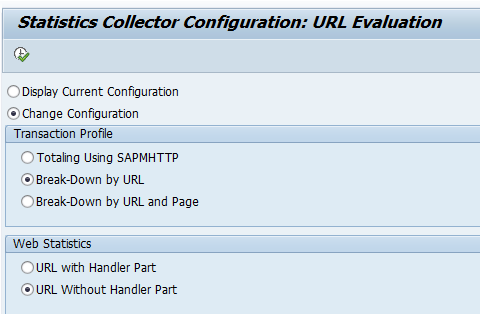
To enable the logging, setup in SAP audit log transaction SM20 (or RSAU_CONFIG) the BUJ event for non-encrypted communication:
Next to this set RZ10 parameter snc/log_unencrypted_rfc to value 2 to also log the unencrypted RFC’s.
Warning: if you have many RFC's and start to encrypt them, this event can generate massive amounts of logging. Consider to switch on temporarily to log limited amount of time to get the first work list.
Audit log results for unencrypted RFC and GUI
Use transaction SM20 or RSAU_READ_LOG and select event BUJ.
Unencrypted RFC looks like this for ABAP to ABAP:
And for external RFC to ABAP:
In the details you can find the source IP address.
Unencrypted GUI usage looks like this:
In the Terminal Name column you can find the desktop/laptop of the user still using unencrypted GUI.
Maintaining SAP HANA systems requires regular housekeeping activities, and one of the critical components is the HANA Cleaner. Monitoring its activity ensures that log cleanup and housekeeping jobs are running as expected.
In this blog, it is explained how we implemented HANA Cleaner monitoring in SAP Focused Run (FRUN) using custom metrics via template maintenance, without requiring custom scripts. This approach leverages standard FRUN capabilities and provides a scalable and maintainable monitoring solution.
Solution Overview
The objective of this monitoring setup is:
Track the execution of HANA Cleaner jobs
Detect inactivity or failure scenarios
Alert operations teams proactively
We achieved this using:
Custom Metric based on File Monitoring
FRUN Template Maintenance
Diagnostic Agent (push) data collection
How It Works
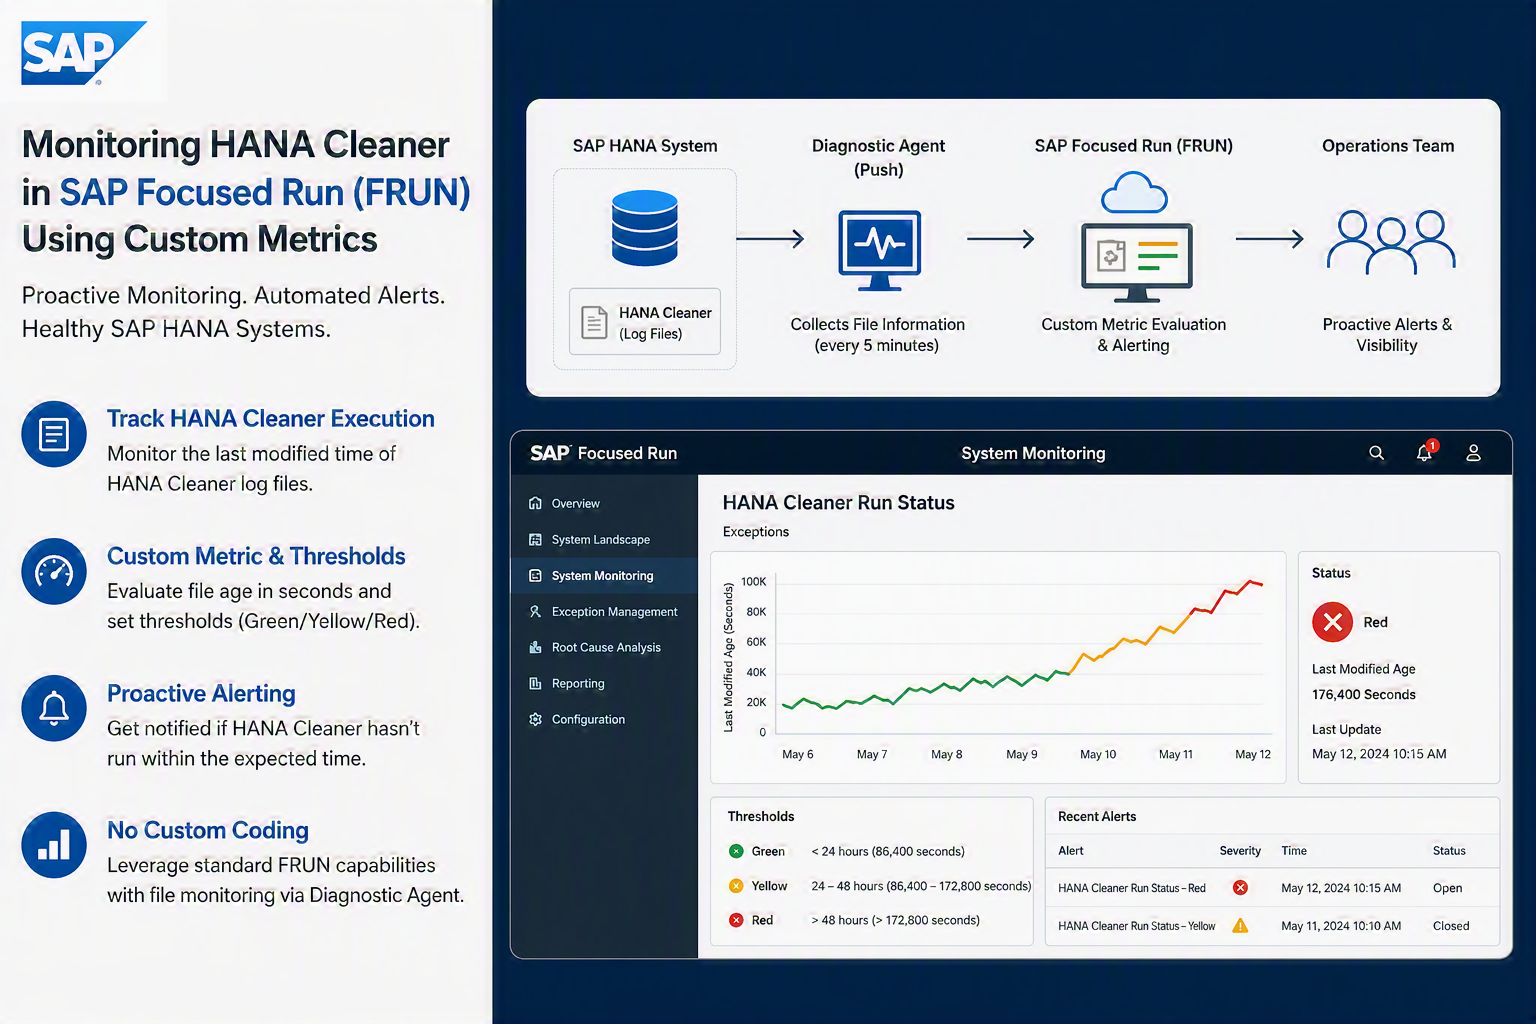
The monitoring logic is simple but effective:
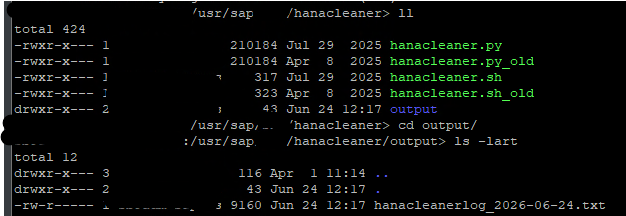
The system monitors the last modified timestamp of HANA Cleaner log files
A custom metric evaluates this timestamp continuously
If no update is detected beyond a defined threshold (e.g., 2 days), an alert is triggered
This ensures immediate visibility into any issues with the HANA Cleaner process.
Implementation Details
Step 1: Create Custom Metric in FRUN
Navigate to:
Advanced System Management → System Monitoring → Template Maintenance
Create or enhance a metric such as:
HANA Cleaner Run Status
Category:
Exceptions
Step 2: Configure Data Collection
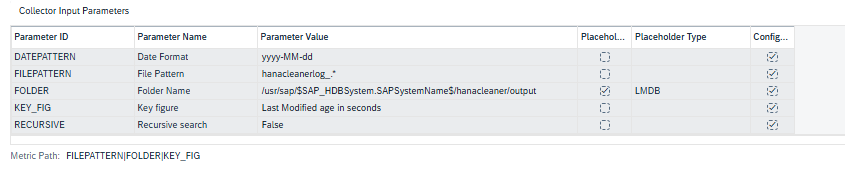
From the screenshot setup, the following configuration is used:
✅ This configuration ensures the system monitors the latest file modification time in the HANA Cleaner output directory.
Step 4: Define Metric Logic
The key figure:
Last Modified Age in Seconds
This indicates how long it has been since the log file was updated.
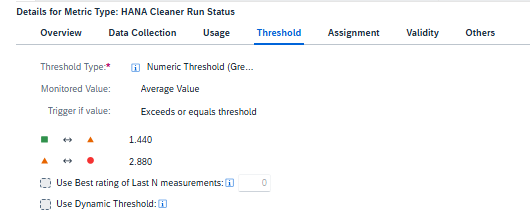
Step 5: Threshold Configuration
Define thresholds based on your operational requirements.
Example:
Condition
Threshold
Green
< 24 hours
Yellow
24–48 hours
Red
> 48 hours
This ensures alerts are triggered if HANA Cleaner hasn’t executed in expected time.
Step 6: Assign Metric to Template
Assign the custom metric to:
Relevant HANA systems
Both Production and Non-Production landscapes
This ensures full coverage across your environment.
Monitoring Output
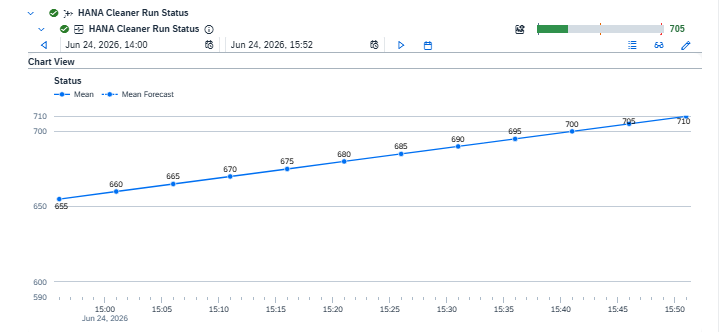
Once configured, FRUN displays:
Historical trend of HANA Cleaner activity
Status indicators (Green/Yellow/Red)
Alerts in case of inactivity
From your reference screenshot:
The metric appears under Exceptions
A graph shows activity progression
Alerts are triggered if thresholds are breached
System Monitoring
(Optional) Root Cause Analysis
Coverage
This setup can be implemented:
Across the entire HANA landscape
For all S/4HANA or standalone HANA systems
In both:
Production
Non-Production environments
Advantages of This Approach
No Custom Coding Required Uses standard FRUN capabilities Can be applied across multiple systems via templates Frequent monitoring (every 5 minutes) Detects failures before business impact Simple file-based monitoring logic
Key Learnings & Best Practices
Always ensure correct file path and pattern
Validate that Diagnostic Agent has access to directory
Fine-tune thresholds based on:
HANA Cleaner job frequency
Business requirements
Use template-based rollout for consistency
Conclusion
Monitoring housekeeping activities like HANA Cleaner is critical for maintaining system health. By leveraging FRUN custom metrics and file monitoring, we can implement an efficient, scalable, and proactive monitoring solution.
This approach eliminates the need for custom scripts while fully utilizing standard SAP monitoring capabilities.
When we cannot call our own function modules properly, we do deserve a short dump (program LSZA0F34):
Spaceship BERID, MRP area, has adventures (program LATPCFA6):
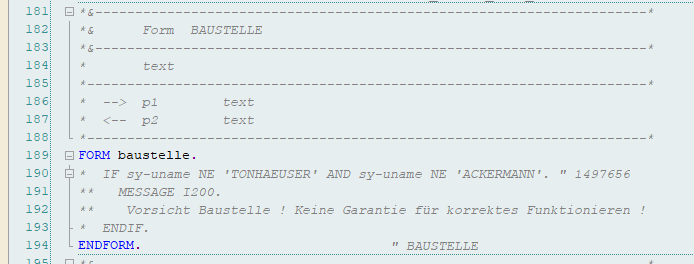
Program LSHI0F02 has road construction (Baustelle):
Trigger an error or end up in FI hell (program LWOST_CR_IMG01FNG):
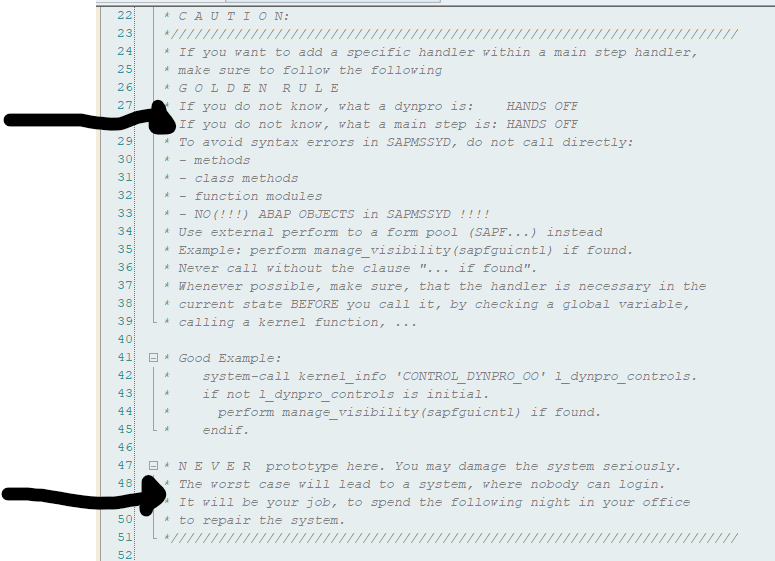
A nice golden rule: do not touch coding if you don’t know what you are doing, and if you do it is night work for you in the office to repair it (program SAPMSSYD):
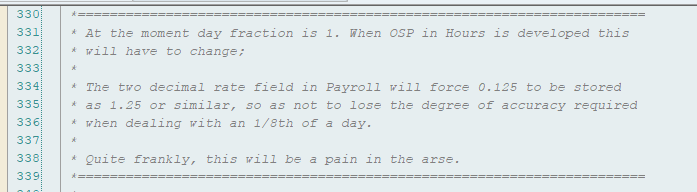
It will be painful (program RPCMSAG0PBS_FORMS):
Program RSORAF01 show life is sometimes terrible:
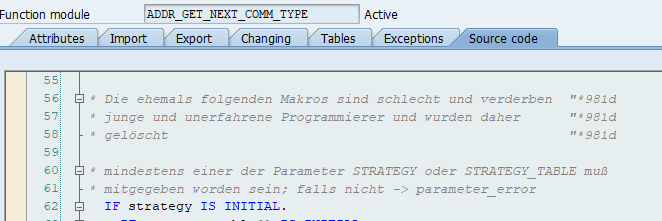
Complaints in function module ADDR_GET_NEXT_COMM_TYPE about junior programmers:
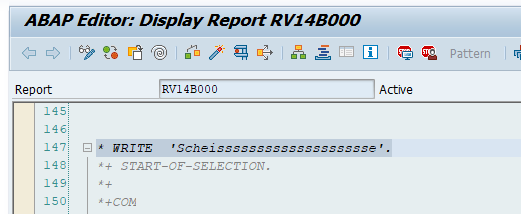
Some commented out Scheisse (shit in German) in program RV14B000:
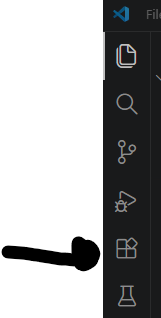
SAP ABAP on Eclipse will be replaced with ABAP on visual studio (background is explained in this blog). Developments in the RAP framework and AI Joule will be done in ADT-VS. If you are looking for Eclipse ADT installation, read this blog. Both Eclipse ADT and ADT-VS require the ABAP backend installation of the ADT tools, which is the same for both and described in this blog.
Installation and connection to backend
Frequently asked questions blog refers to the formal help.sap.com page on ADT for visual studio code.
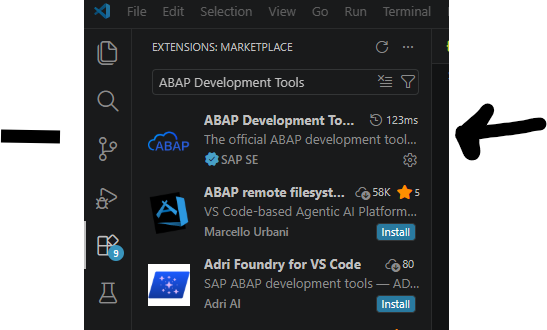
Search for the ABAP Development tools and install them:
4. Wait for the installation to finish and restart the Visual Studio
5. To add an ABAP destination, click in the menu View and select Command Pallette, and key here ABAP: New Destination
6. In the popup select on the right hand side the + button:
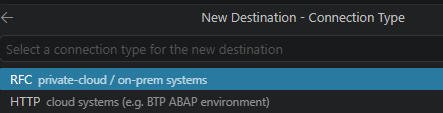
7. Select RFC to backend or HTTP to cloud system:
If you take RFC, the popup will show entries from your SAP GUI.
8. Enter User ID, password, client (be careful here: default it will give you 000, this is NOT what you want), language and password if SSO is not setup
Using the studio
On the left hand side the connections are visible. Right click on any and select the option Logon to Destination:
Rest is same as ADT. Do realize that not all editors are yet working in Visual Studio.
Background references
ABAP AI Joule: read this blog, and this blog. Do realize AI ABAP Joule is licensed and not free of use.