This blog will explain how to archive SD invoices via object SD_VBRK. Generic technical setup must have been executed already, and is explained in this blog.
Object SD_VBRK
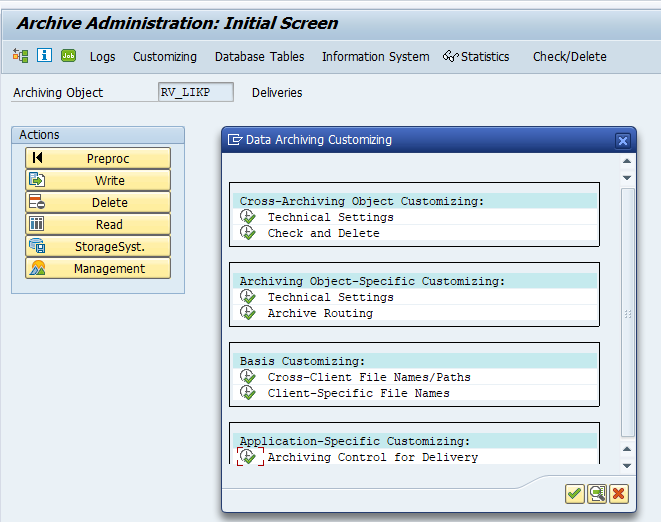
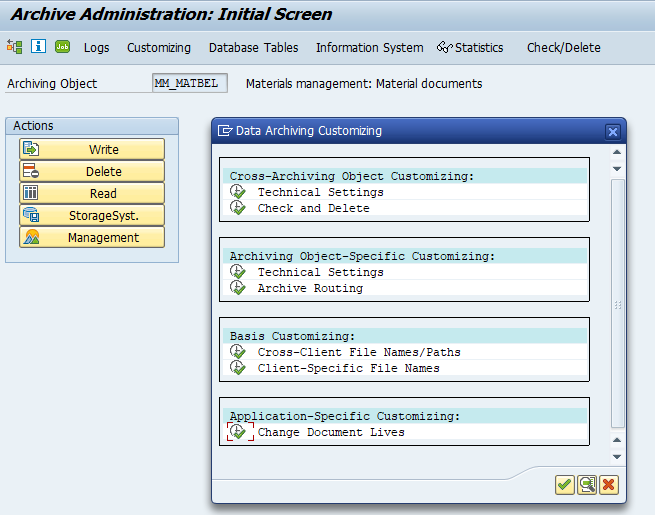
Go to transaction SARA and select object SD_VBRK.
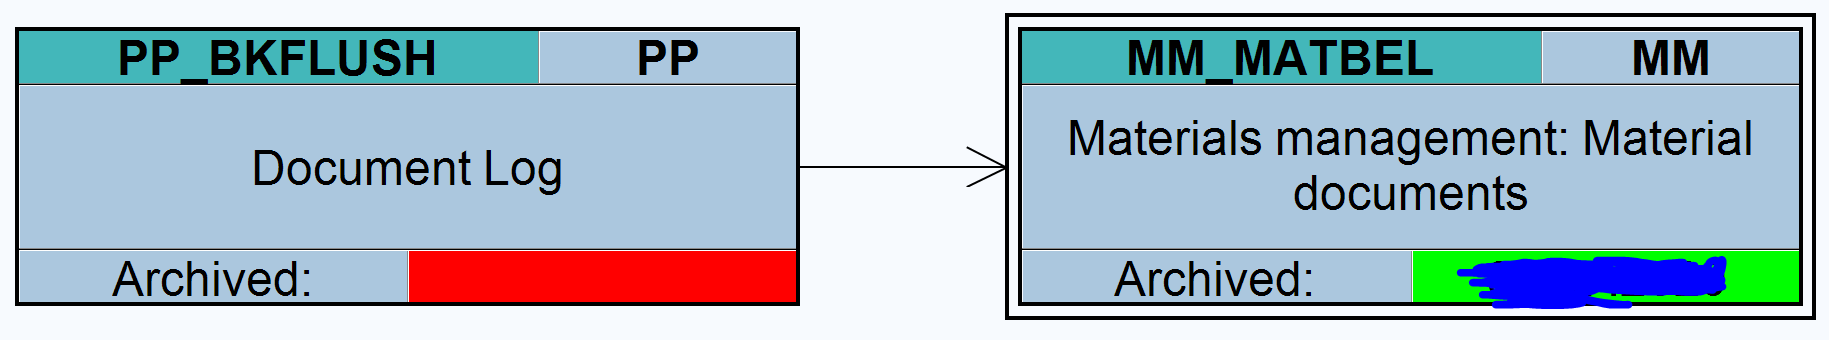
Dependency schedule:
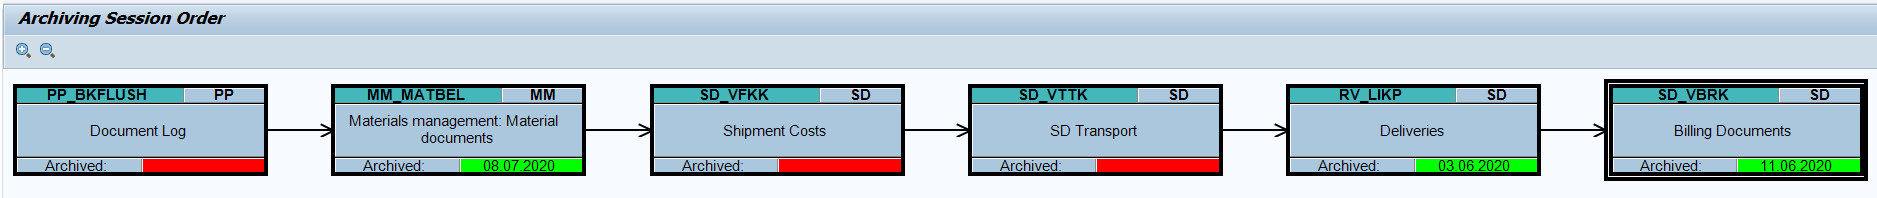
In case you use production planning backflush, you must archive those first. Then material documents, shipment costs (if in use), SD transport (if in use) and deliveries (if in use).
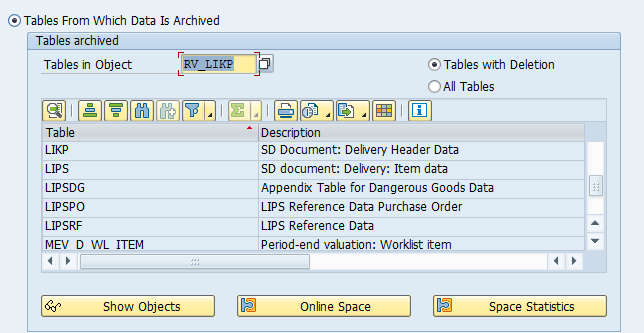
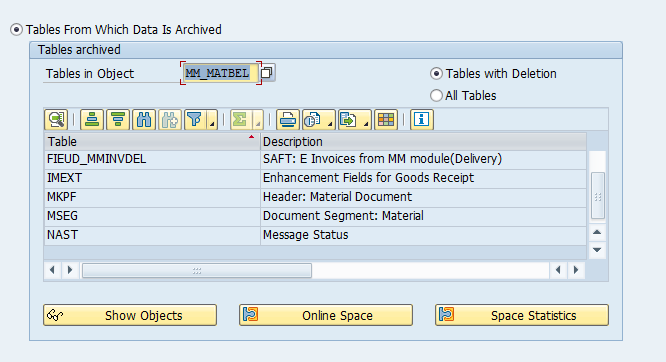
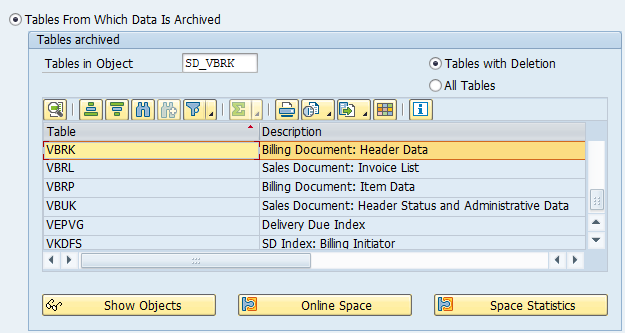
Main tables that are archived:
- NAST (for the specific records)
- VBFA (for the specific records)
- VBOX (SD Document: Billing Document: Rebate Index)
- VBPA (for the specific records)
- VBRK (invoice headers)
- VBRP (invoice line items)
- VBUK (invoice status)
Technical programs and OSS notes
Preprocessing program: S3VBRKPTS
Write program: S3VBRKWRS
Delete program: S3LIKPDLS
Read program: S3VBRKAU
Relevant OSS notes:
- 488970 – Archivability criteria for billing docs S3VBRKWR/S3VBRKPT
- 2025547 – S3VBRKPTS – document not complete (Document Not Archivable Due to BADI Add-On Archiving Check)
- 2846307 – Error “No archiving control maintained for this document” occurs during archiving preprocessing
- 2901832 – Unable to archive rejected scheduling agreement
- 3024179 – Archiving Control Has Not Been Maintained
- 3034883 – There is no sales order stock check during DELETE stage in SD archive process
- 3125902 – Log of rejected invoices shows invoice multiple times
- 3165687 – Incorrect job log for S3VBRKPTS
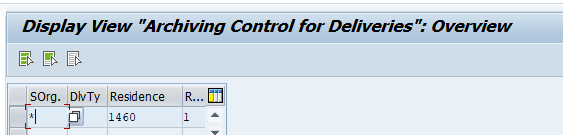
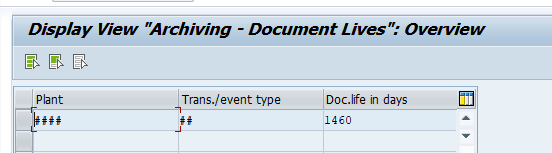
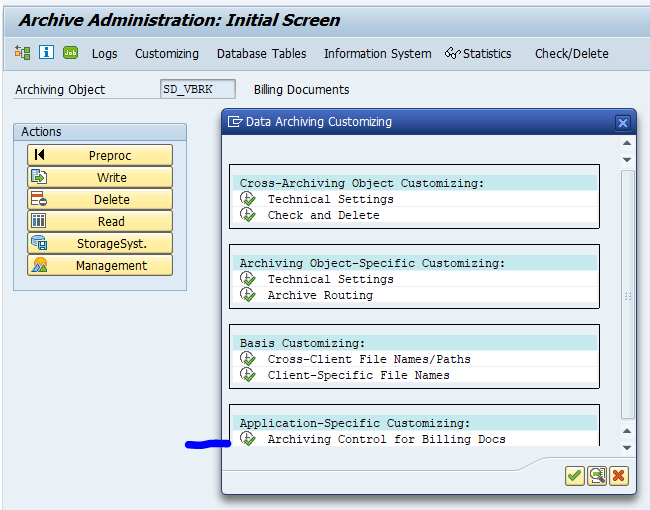
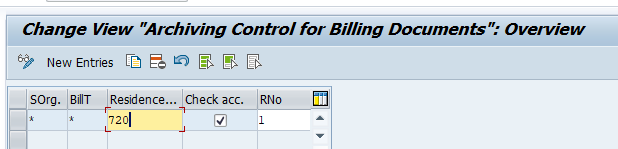
Application specific customizing
In the application specific customizing for SD_VBRK you can maintain the document retention time settings:
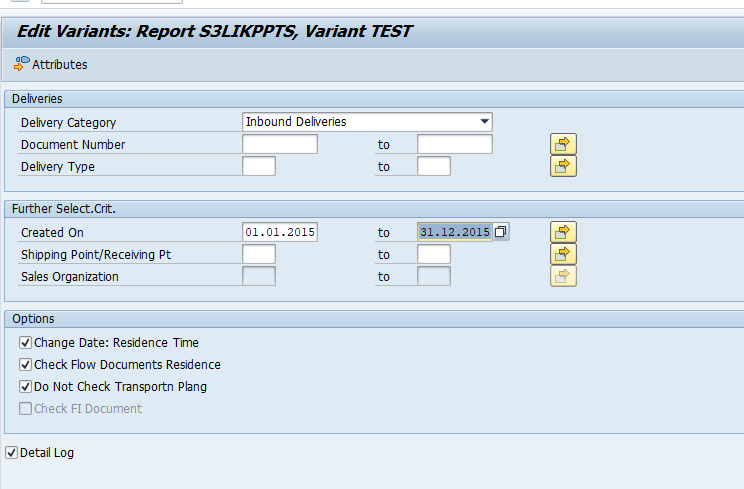
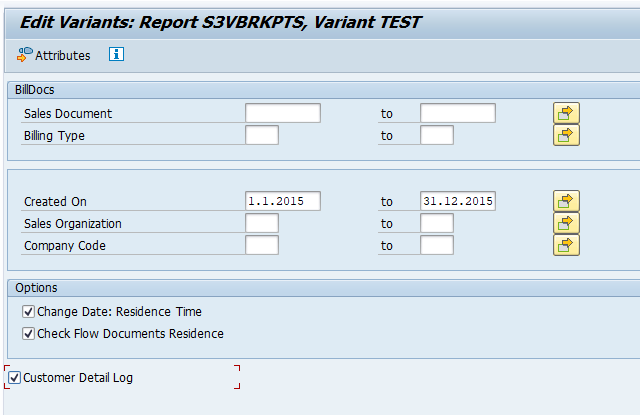
Executing the preprocessing run
In transaction SARA, select SD_VBRK. In the preprocessing run the documents to be archived are prepared:
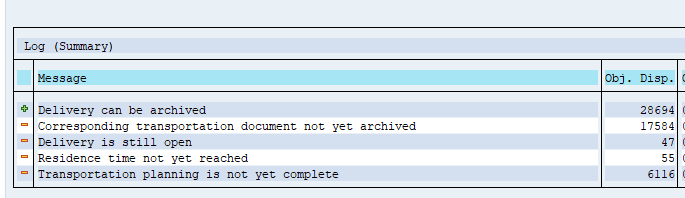
Check the log for the results:
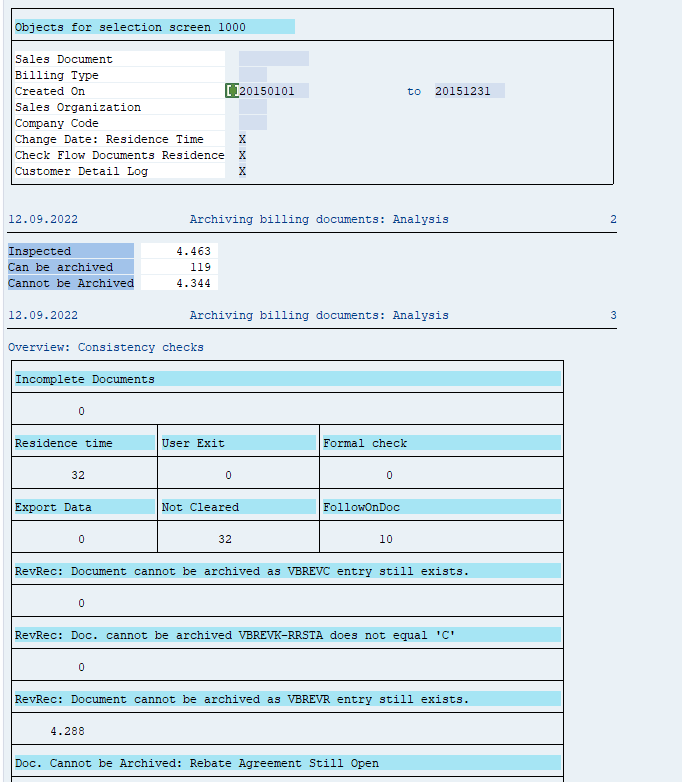
Typically SD_VBRK will yield 30 to 70% documents that can be archived.
Executing the write run and delete run
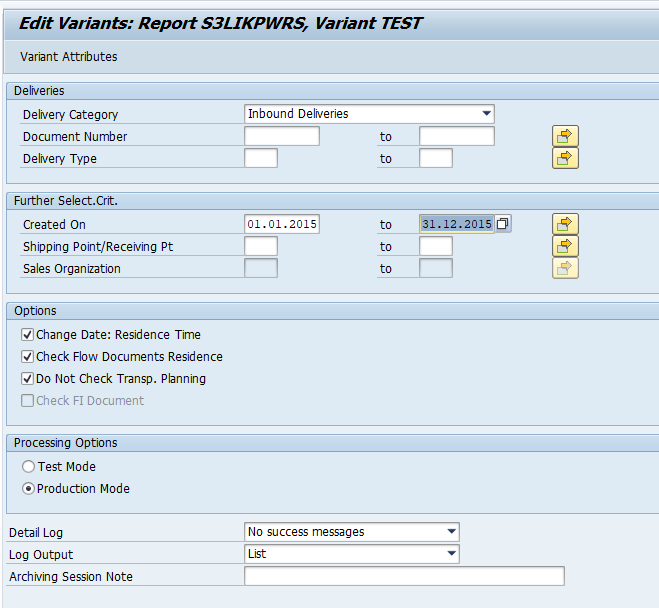
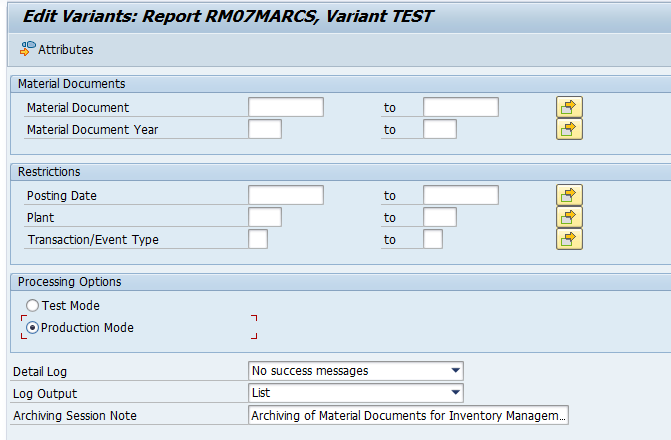
In transaction SARA, SD_VBRK select the write run:
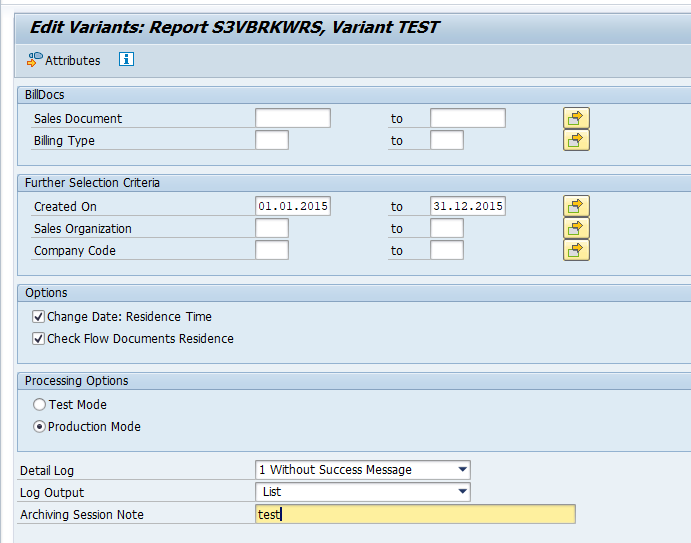
Select your data, save the variant and start the archiving write run.
Give the archive session a good name that describes sales organization/shipment point and year. This is needed for data retrieval later on.
After the write run is done, check the logs. SD_VBRK archiving has average speed, but not so high percentage of archiving (up to 40 to 90%).
Deletion run is standard by selecting the archive file and starting the deletion run.
Data retrieval
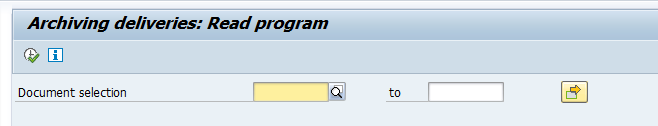
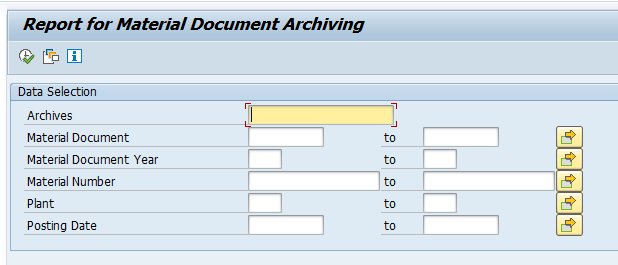
Start the data retrieval program and fill selection criteria:
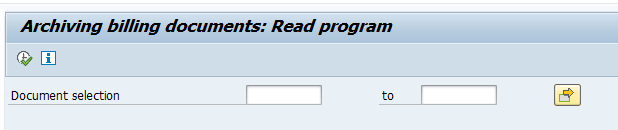
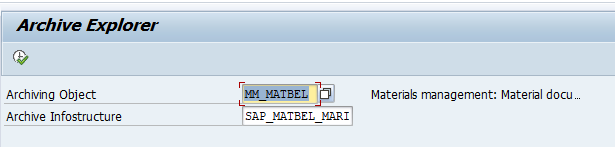
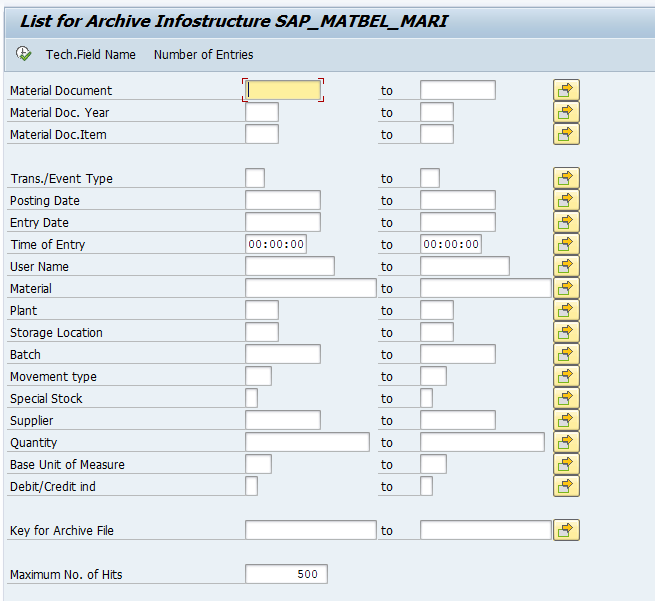
In the second screen select the archive files. Now wait long time before data is shown.
For faster retrieval, setup data archiving infostructures SAP_SD_VBRK_001 and SAP_SD_VBRK_002. These are not active by default. So you have to use transaction SARJ to set them up and later fill the structures (see blog).