This blog will explain how to archive customer and vendor master data via objects FI_ACCRECV and FI_ACCPAYB. Generic technical setup must have been executed already, and is explained in this blog.
Most use of this archiving is when customers and vendors are created wrongly, to get them deleted from the system.
The below is mainly focusing on traditional ECC system. In S4HANA system both customers and vendors are integrated as business partners. For archiving sections of business partners for customer and / or vendors, read OSS note 3321585 – Archiving for Business Partner and Customer / Suppliers.
If you also want to archive/delete the LFC1 and KNC1 tables, also implement the FI_TF_DEB and FI_TF_CRE archiving objects.
Object FI_ACCRECV (customers)
Go to transaction SARA and select object FI_ACCRECV (customers).
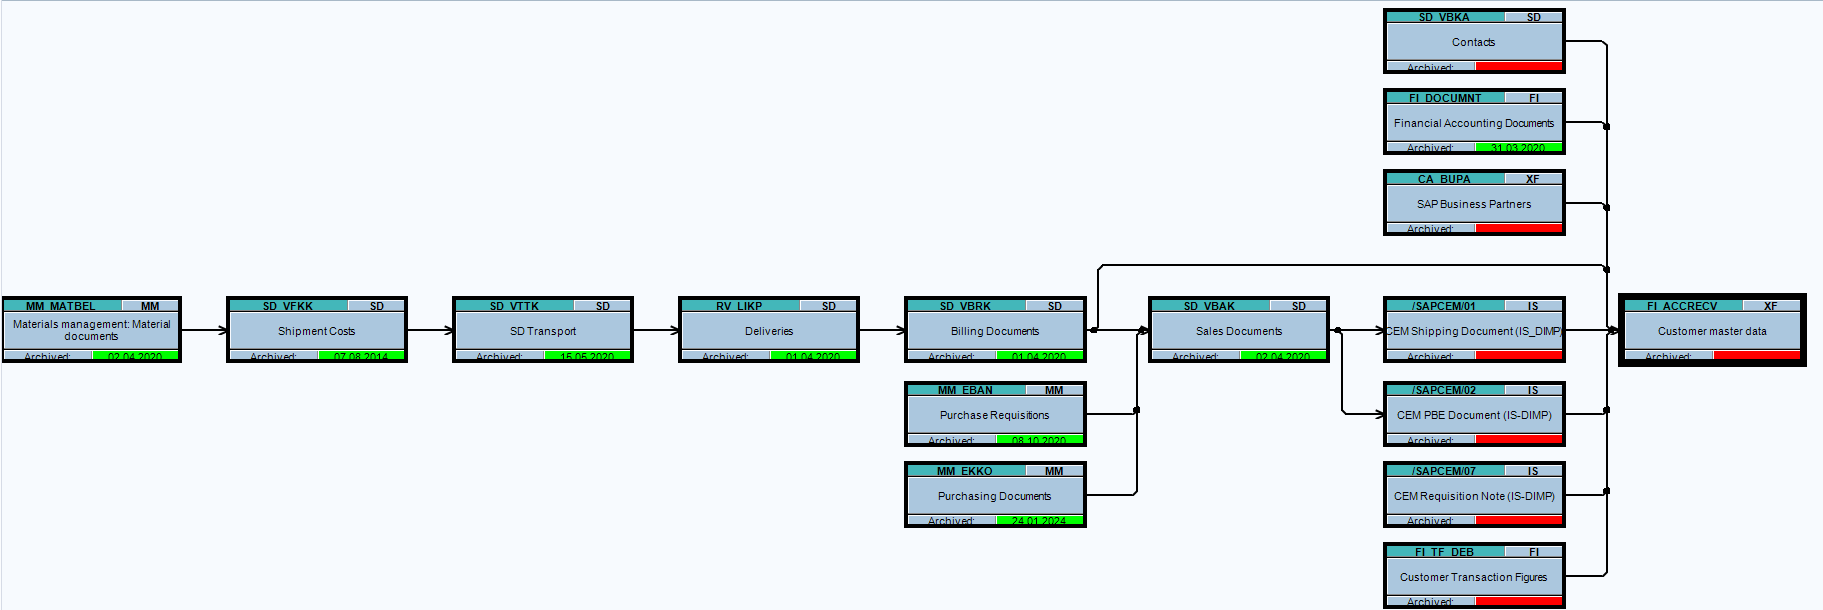
Dependency schedule:
A lot of dependencies. Everywhere a customer number is used in an object. This makes it almost impossible to archive a customer master record. But still: it can be done to delete wrongly created master data if no transaction data is created yet.
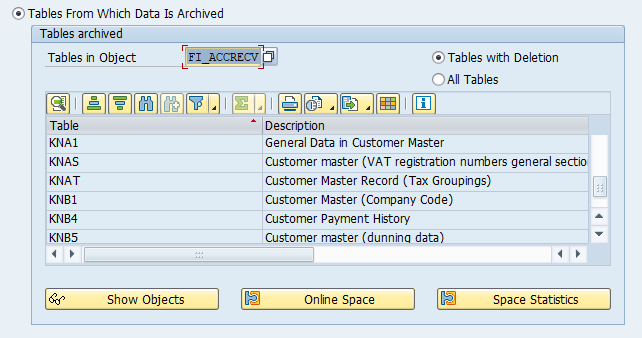
Main tables that are archived:
- KNA1: General customer master data
- KNB1: Company code specific customer master data
Object FI_ACCPAYB (vendors)
Go to transaction SARA and select object FI_ACCPAYB (vendors).
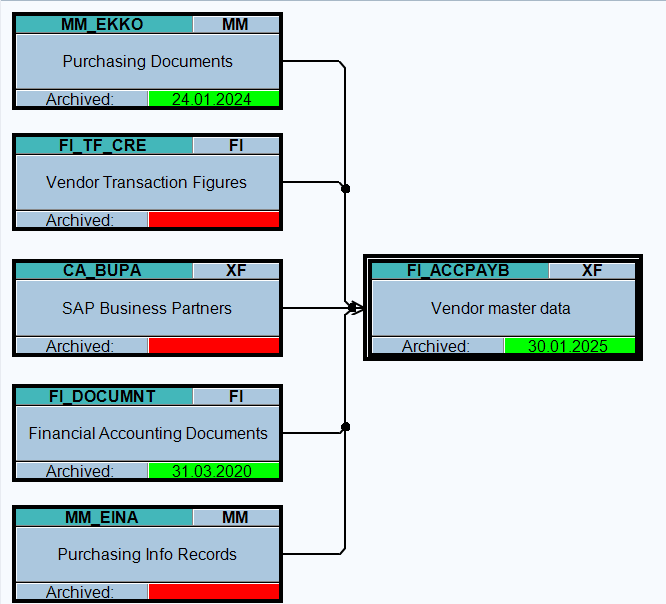
Dependency schedule:
Quite some dependencies. Everywhere a customer number is used in an object. This makes it almost impossible to archive a vendor master record. But still: it can be done to delete wrongly created master data if no transaction data is created yet.
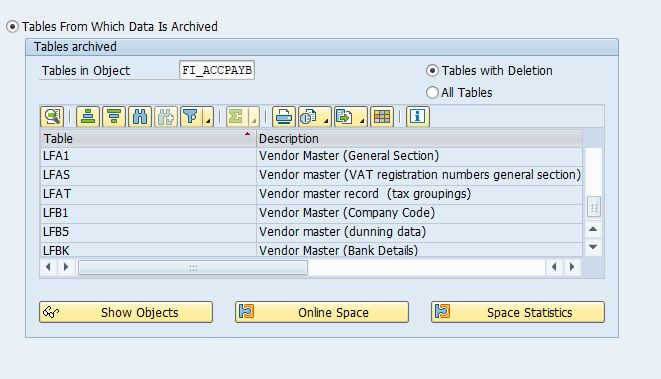
Main tables that are archived:
- LFA1: General vendor master data
- LFB1: Company code specific vendor master data
Technical programs and OSS notes
Write program customers: FI_ACCRECV_WRI
Delete program customers: FI_ACCRECV_DEL
Write program vendors: FI_ACCPAYB_WRI
Delete program vendors: FI_ACCPAYB_DEL
Relevant OSS notes:
Application specific customizing
There is no application specific customizing for customer and vendor archiving. You can use XD06 for customer master deletion flag setting and XK06 for vendor master deletion flag setting.
Executing the write run and delete run Customers
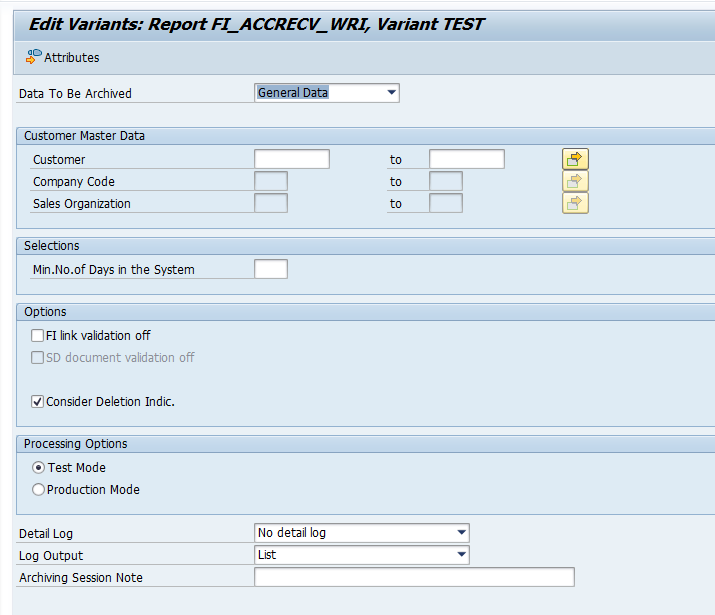
For customers: in transaction FI_ACCRECV select the write run:
Important is the consideration of the validation links and the deletion indicator. Customer deletion indicator flag can be set with transaction XD06.
Select your data, save the variant and start the archiving write run.
There is a sequence inconsistency. The online help has sequence FI, SD, general. The OSS note 788105 - Archiving FI_ACCRECV has sequence SD, FI, general.
You have to do the run three times: for FI, SD and general.
Deletion run is standard by selecting the archive file and starting the deletion run.
Executing the write run and delete run Vendors
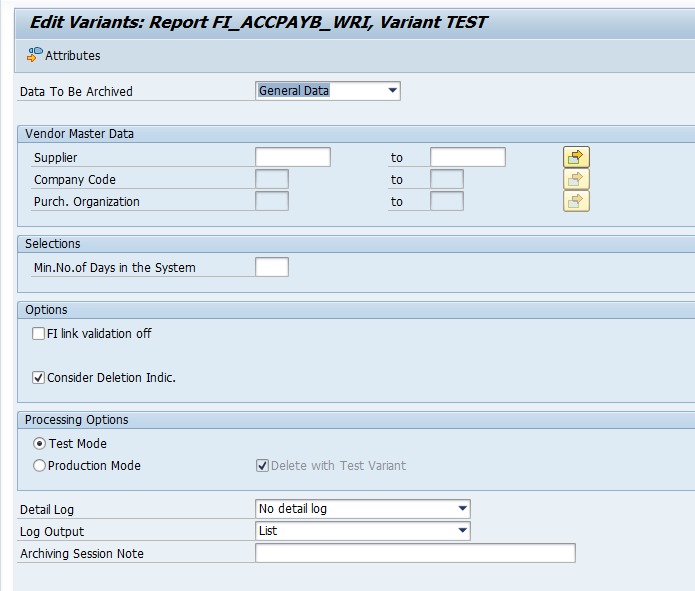
For customers: in transaction FI_ACCPAYB select the write run:
Important is the consideration of the validation links and the deletion indicator. Vendor deletion indicator flag can be set with transaction XK06.
Select your data, save the variant and start the archiving write run.
You have to do the run three times: for FI, MM and general. A sequence is not given in OSS note, nor in online help.
Deletion run is standard by selecting the archive file and starting the deletion run.