FIORI app support is a nice tool. With the tool, you can get support on app issues.
The tool can help with:
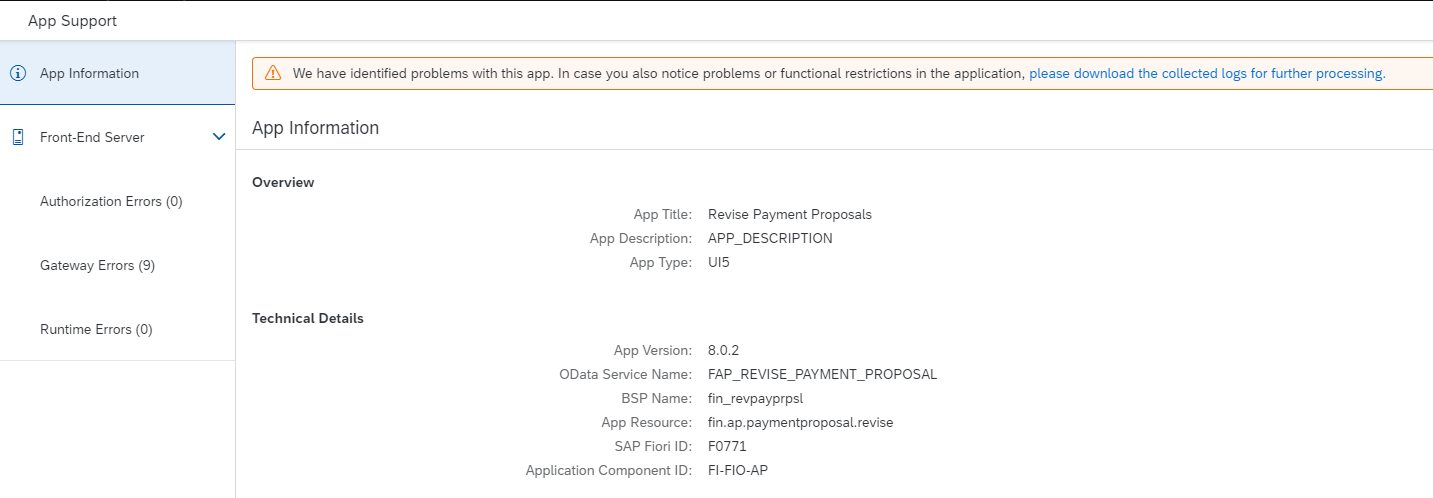
- Getting specific version information for a FIORI app
- Checking if the SICF services are active
- Checking if the ODATA services are active
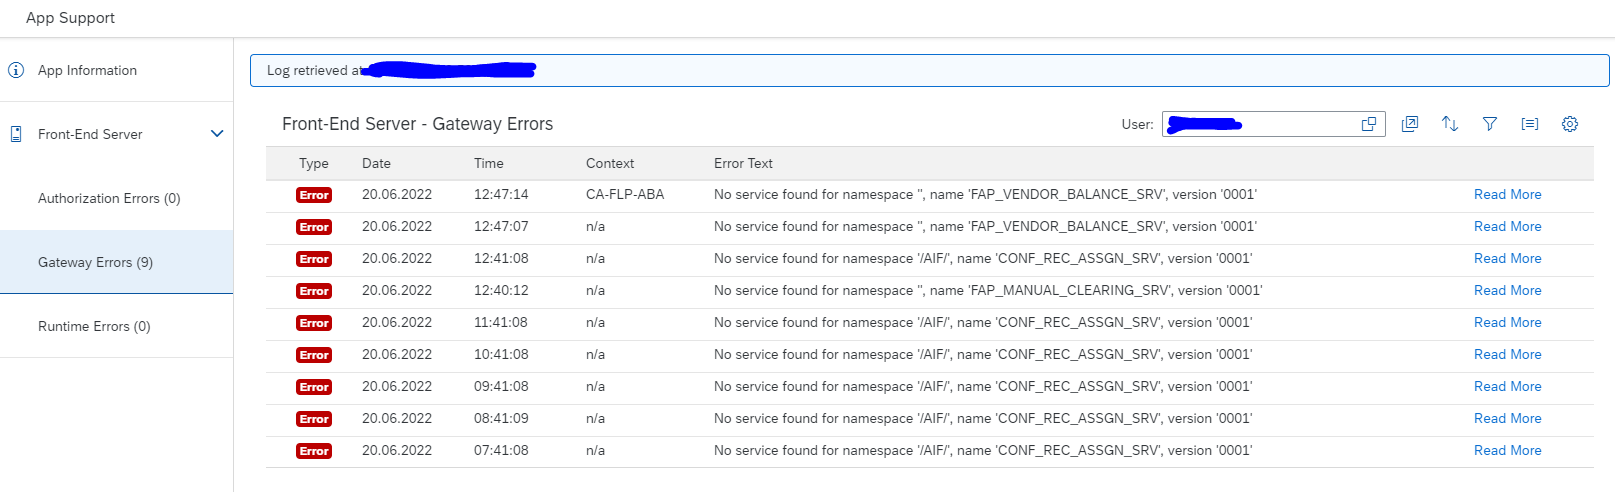
- Checking for authorization errors
This blog will explain these topics and will explain how the setup of the function works.
How to use the FIORI app support
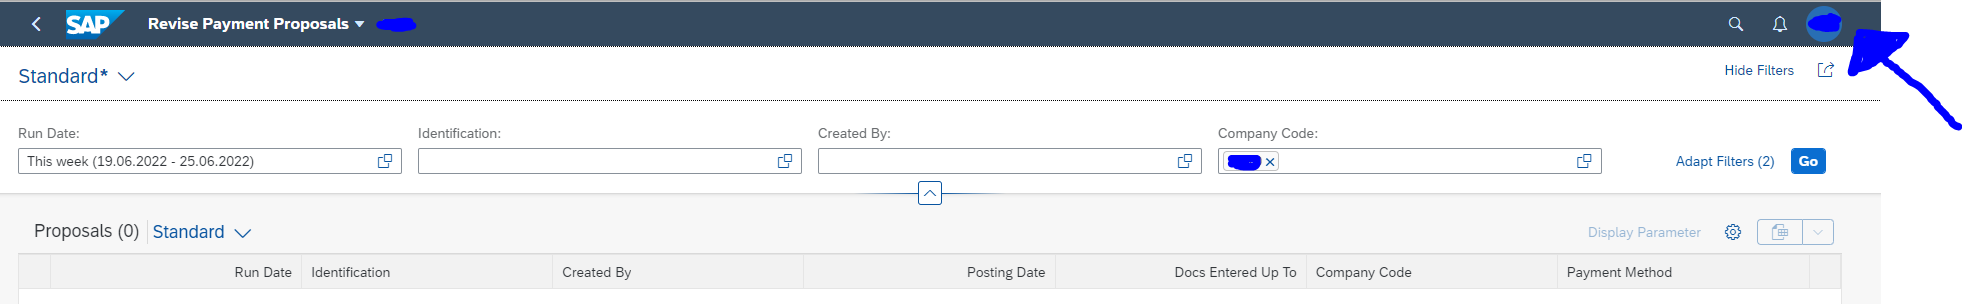
In any FIORI app (not the main launchpad), click on your person icon:
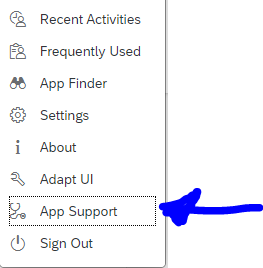
And open the app support from the menu:
Now the app support screen will first open with the version information:
Clicking on Front end server shows the front end server status for this app:
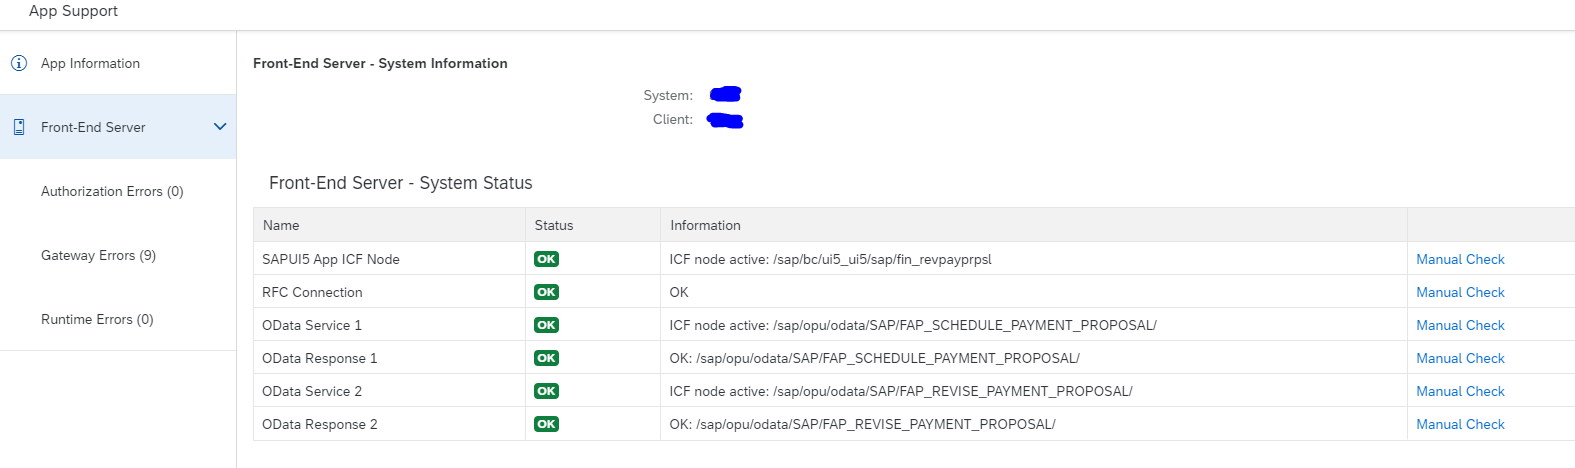
In this case you can already see there are issues with the backend:
You can download the logs by pressing the Download Logs button:
By clicking on all the checks and logs, you can quickly detect where any issue of the FIORI application might be.
How to setup the FIORI app support
FIORI app support needs to be setup. First activate these 2 SICF services;
- /default_host/sap/bc/bsp/sap/sui_flp_app_sup
- /default_host/sap/bc/ui5_ui5/sap/sui_flp_app_sup
And activate this ODATA service: sui_flp_app_sup_srv.
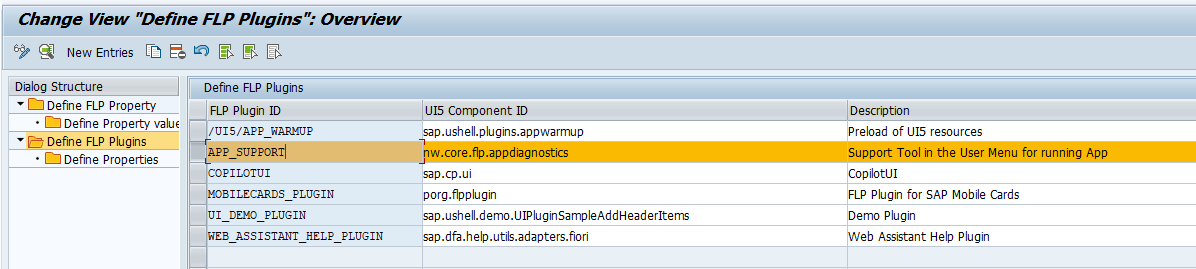
Start transaction /UI2/FLP_CONF_DEF to check this entry is present (and if not present, create it):
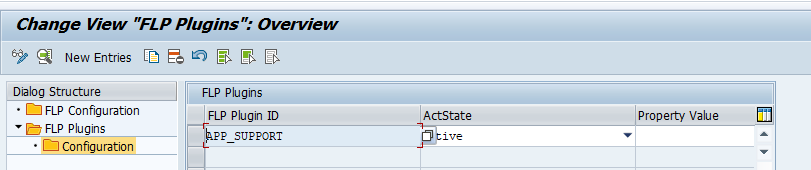
Now use transaction /UI2/FLP_CUS_CONF to check that this entry is set to active. If not, create the entry and set it to active:
Another option is via business catalog.
For both methods: read the SAP help file.
SAP references and OSS notes
SAP blog on FIORI app support: link.
Help file on App support: link.