The database table is the object to store data in the database. It is built of data elements.
Database table creation
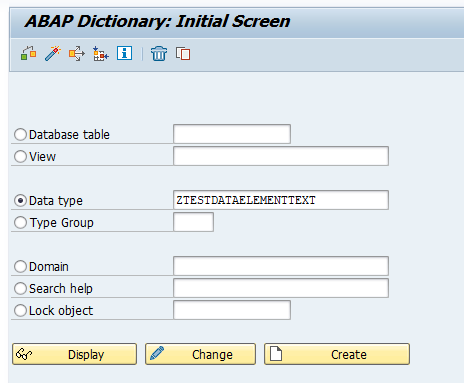
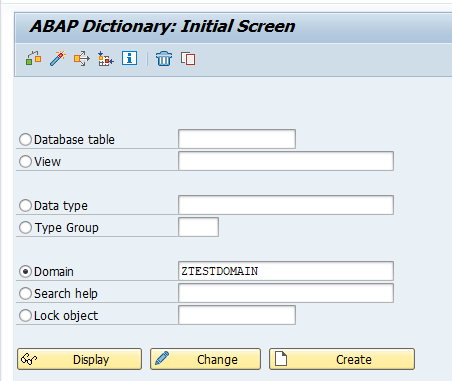
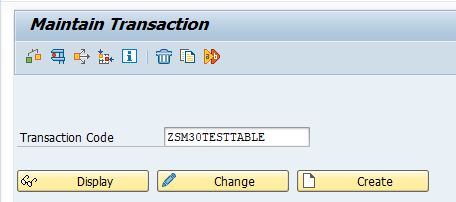
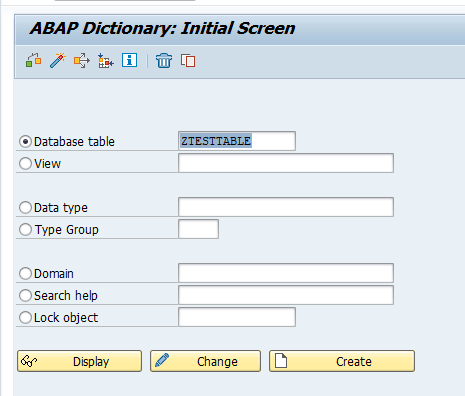
To create a database table start transaction and choose the option Database table, enter your name, and press create:
Set delivery class
On the delivery and maintenance tab you have to choose the type and maintenance mode:
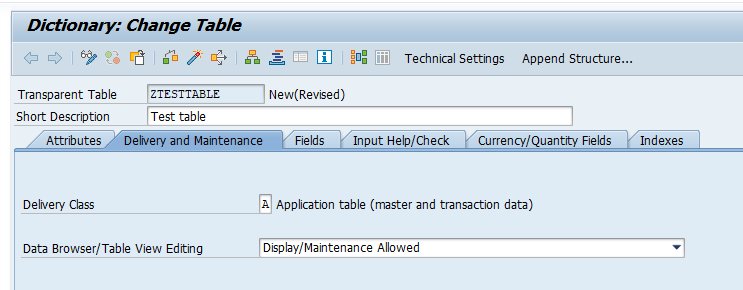
For Delivery Class there are 2 main options:
- A for application data (most used)
- C for customizing data
Customizing data is meant for tables that are maintained by IT and are setup in the development system and transported to production. New entries in these tables will ask for a transport request. Maintenance on production is normally not possible, since production systems are closed for customizing changes.
For Data Browser/Table View Editing, you can set how the system should respond when your table is using in SE16 (table content display) and SM30 (table maintenance). Choose the option that meets your business needs.
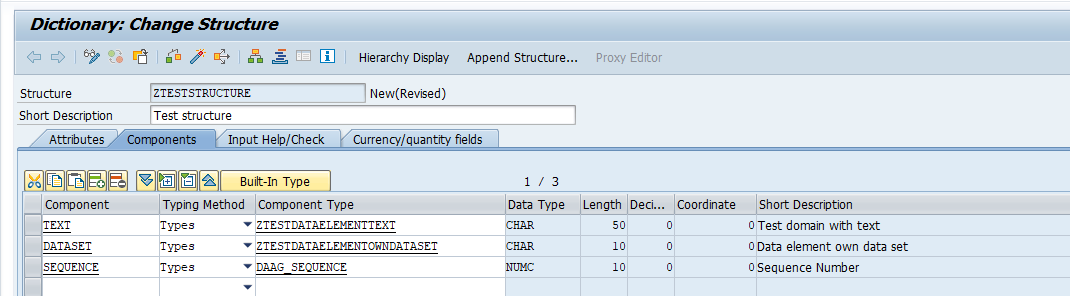
Add the field list
In the table field list add the fields for your table:
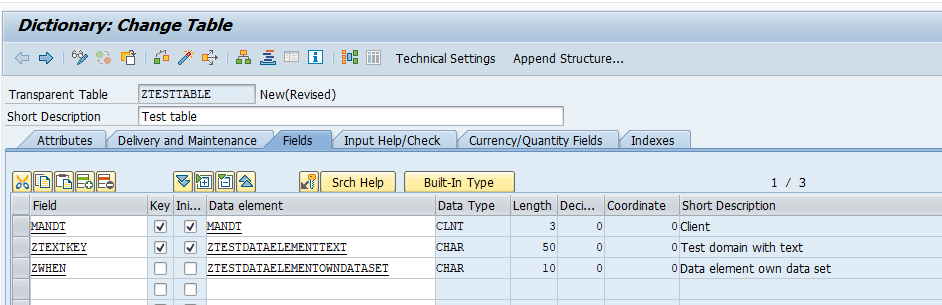
Important here: the first field is always the key field MANDT with type MANDT. MANDT is the field for the client.
In the example above we have taken a second field and marked it as key field (in the Key column).
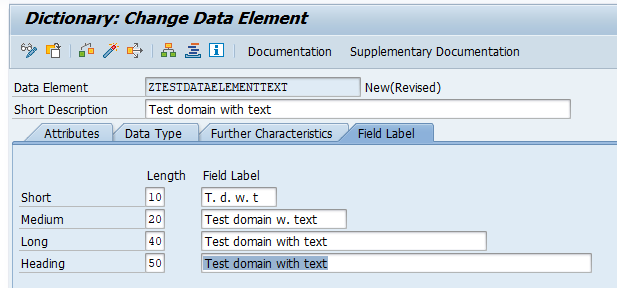
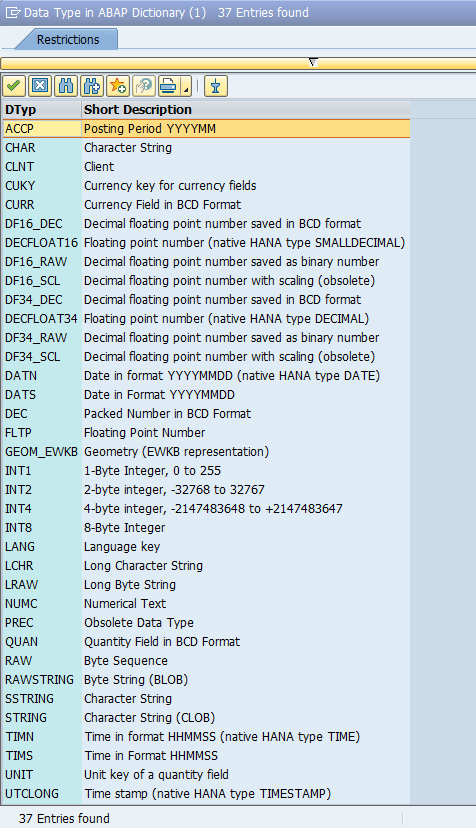
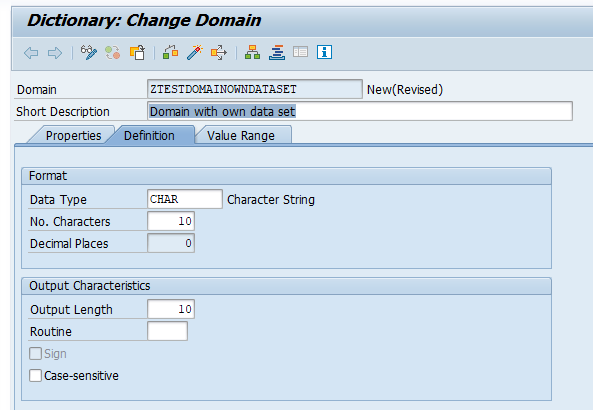
Per field you create, you have to gave a table name and a reference to a Data element. You can refer to a standard SAP data element or an own created data element.
Set technical settings
Finally you need to set the technical properties of the table by clicking the Technical Settings button:
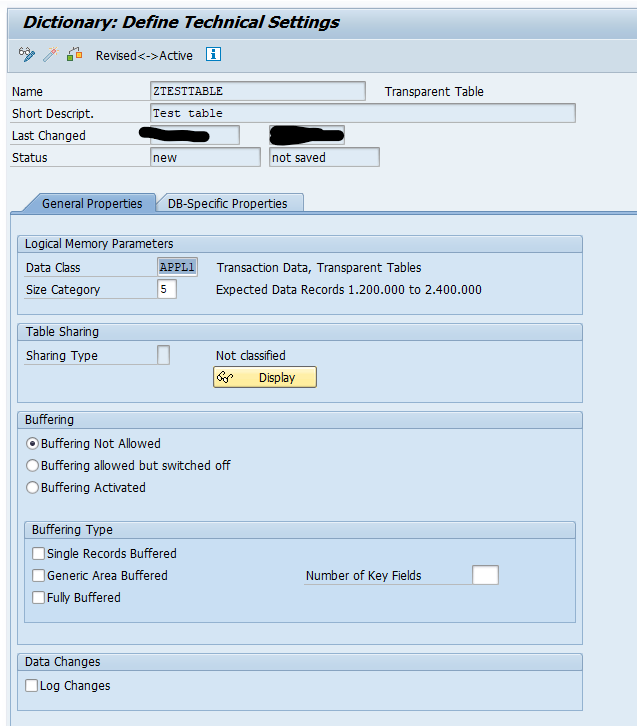
The data class indicates the intended use of the table (master data, transactional data, configuration data, etc.).
The size category indicates the amount of anticipated records in a productive system.
Buffering can be set if needed (see this blog for details on table buffering). Only switch this on when you know what you are doing.
If the flag Log Changes is ticked, all table changes are stored in table logging. For all details on table logging, read this blog.
Only switch on when really needed and only for small configuration tables. If done on large application data tables, the basis administrator will be cross at you for blowing up the application logging table volume.
Assign authorization group
This is technically an optional step, but highly advisable to avoid security issues and rework.
Choose menu option Utilities/Assign Authorization Group to come to this screen:
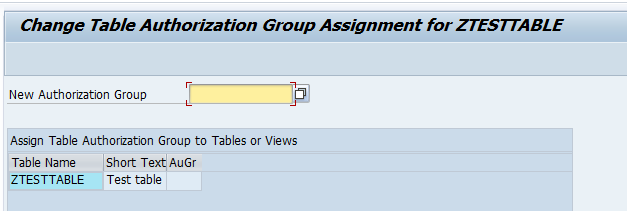
Select the correct authorization group from the list in the field New Authorization Group. There is no execute button, but you have to press Save now to assign it.
Final activation
Now Save the table, check and Activate. Table is ready for use.
Table maintenance generator
If you want to maintain data in your table in SM30, you need to use the table maintenance generator. In SE11 go to change mode of your table and select the menu option Utilities and then Table Maintenance Generator to reach this screen:
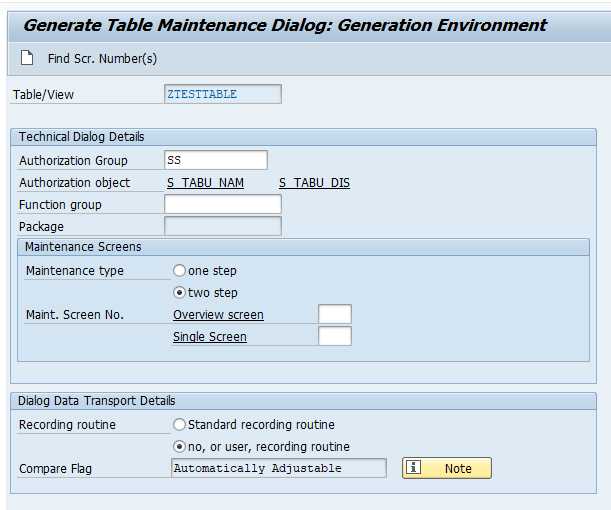
Assign the function group in which the table maintenance is stored.
For simple tables assign one step simple procedure and for screen use screen number 9000.
If your table is a master data table, keep the no recording routine. For new Z customizing tables do choose the Standard recording routine (basically the system will now force the entry to be saved in a transport).
Then use the Create button to generate the maintenance objects.
SM30 can now be used to maintain the content of the table.
Expert part
Issues with table maintenance generator: