The integration and cloud monitoring function of SAP Focused Run consists of 2 main functions:
- Interface monitoring between SAP systems
- Cloud monitoring between on premise and cloud SAP products (see blog)
This blog will give an overview of the interface monitoring between SAP systems.
Questions that will be answered in this blog are:
- How does the interface monitoring in SAP Focused Run look like?
- How much details and history can I see in SAP Focused Run interface monitoring?
- How can I enable my systems for interface monitoring?
- How do I set up a scenario to monitor?
- How do I setup alerting for an interface scenario?
- How do I setup Idoc monitoring?
- How do I setup ODATA monitoring?
- How do I setup qRFC monitoring?
- How do I setup webservice monitoring?
- How do I setup RFC monitoring?
- How do I setup SLT monitoring?
Interface monitoring
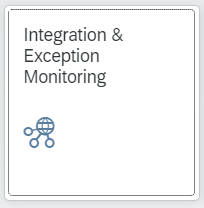
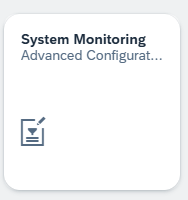
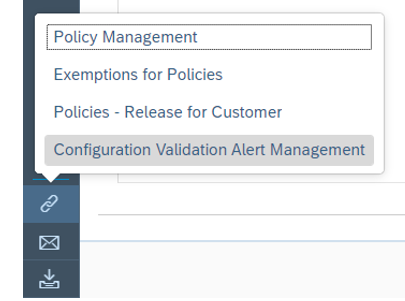
To start the interface monitoring click on the Fiori tile:
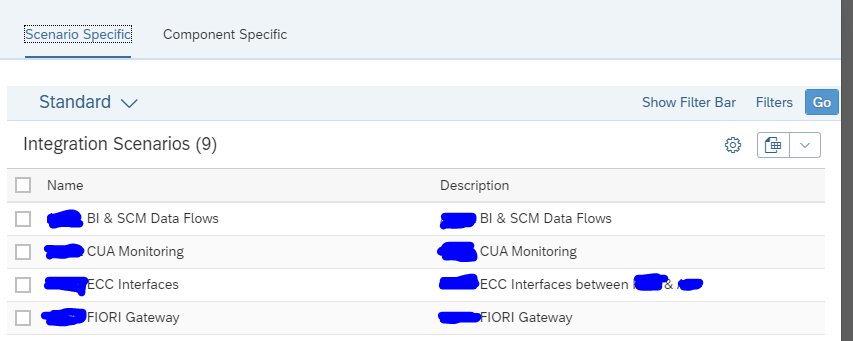
In the next screen you now select one or multiple integration scenario’s:
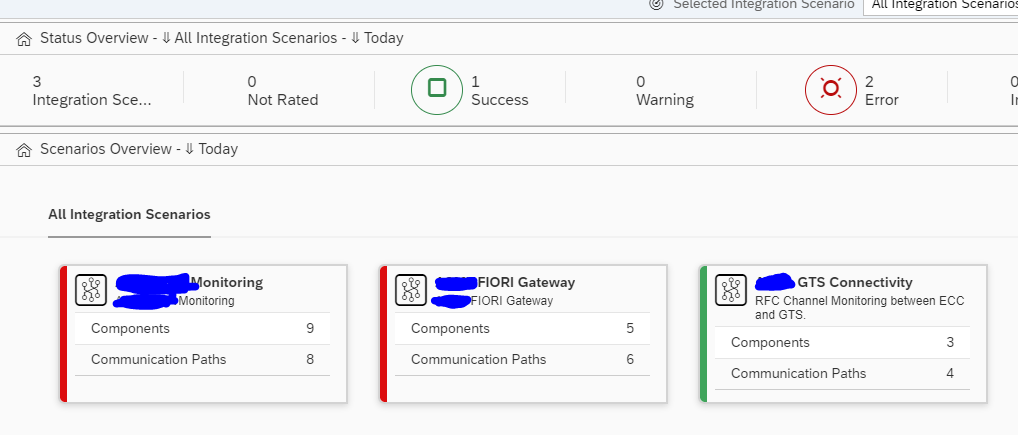
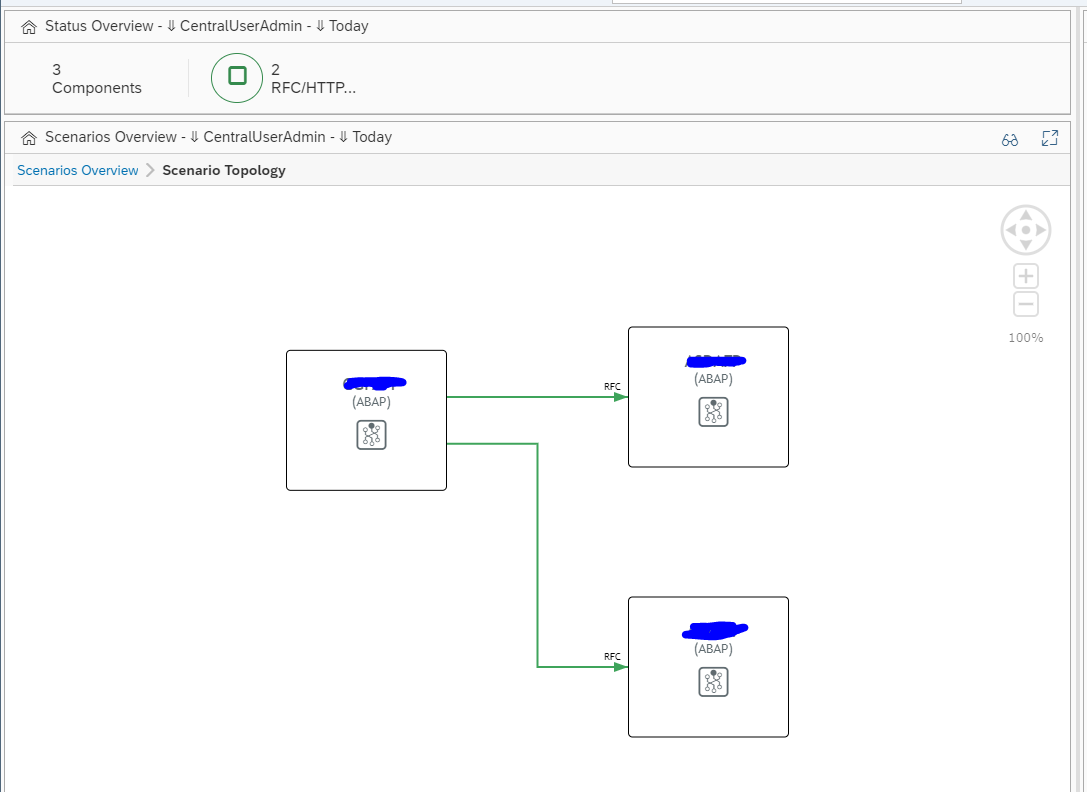
Then you reach the scenario overview screen:
You can immediately see with the red colored scenario’s that there is an issue.
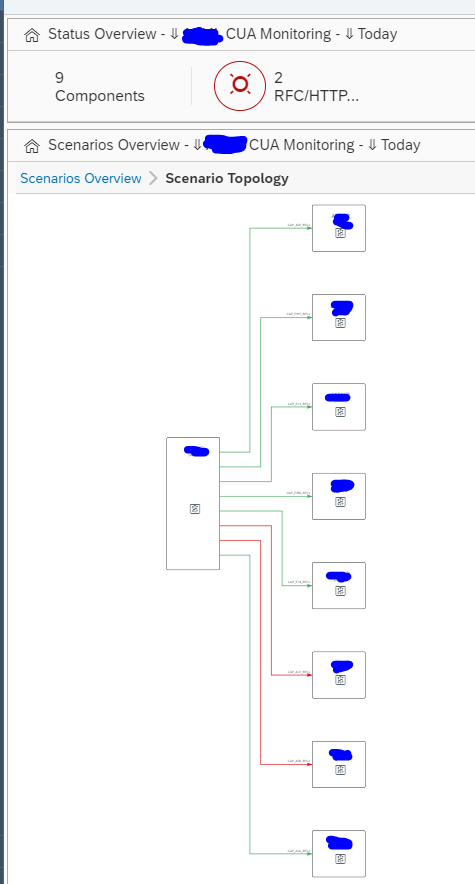
Click on the red scenario to open the details of the scenario topology:
The topology indicates most of the interfaces are correct. To see the detailed issue, click on the red line:
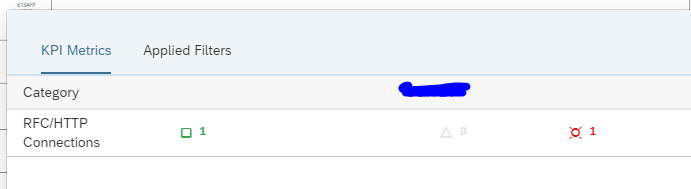
Click on the red error for the details:
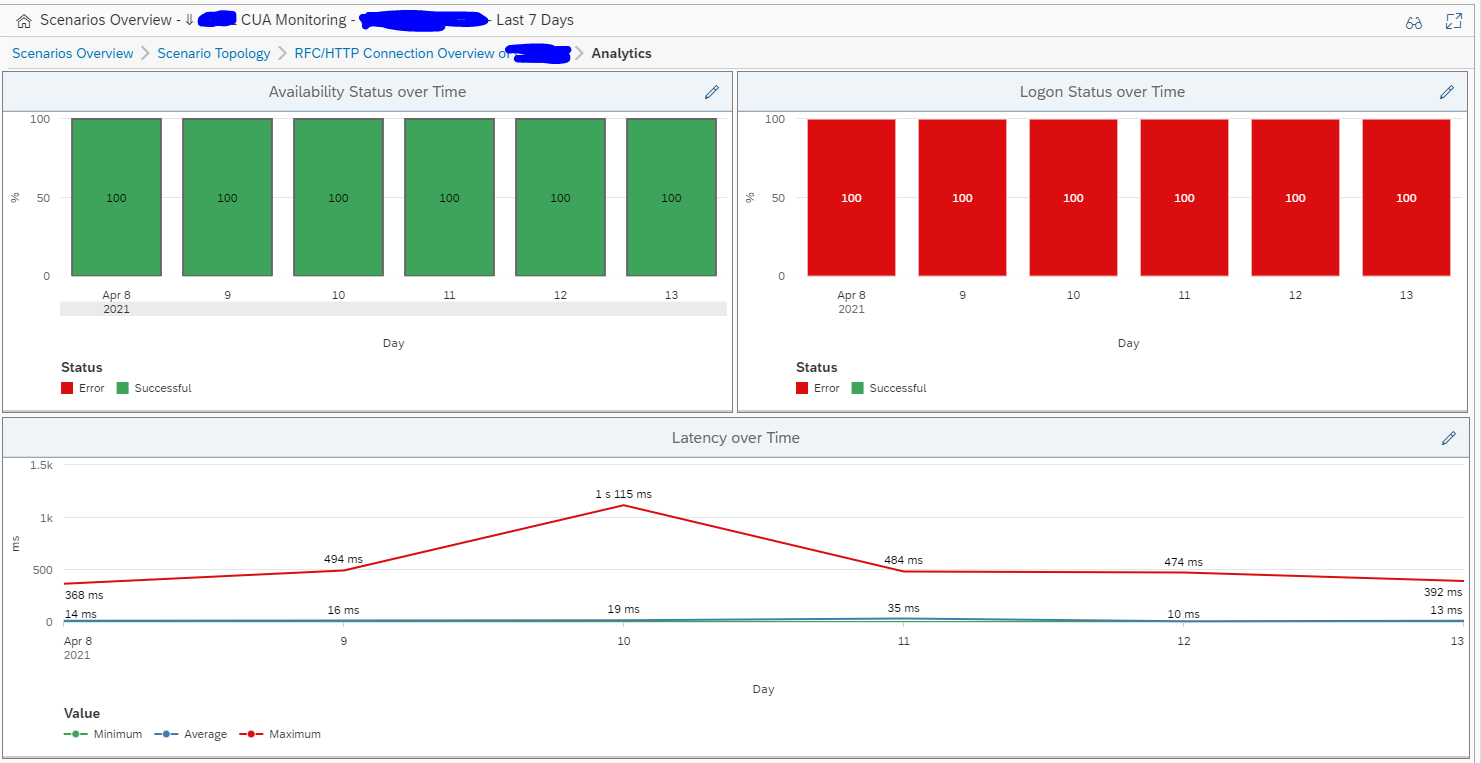
On the right side of the you can click on the Dashboard icon to get an historical overview:
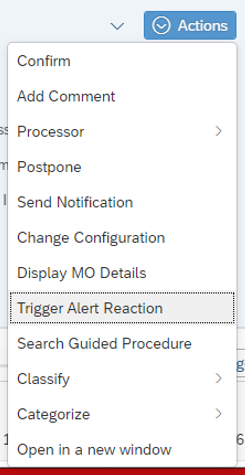
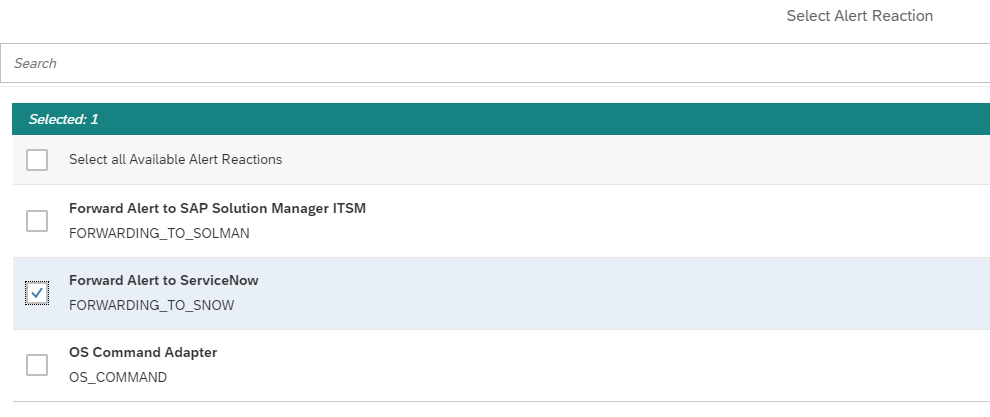
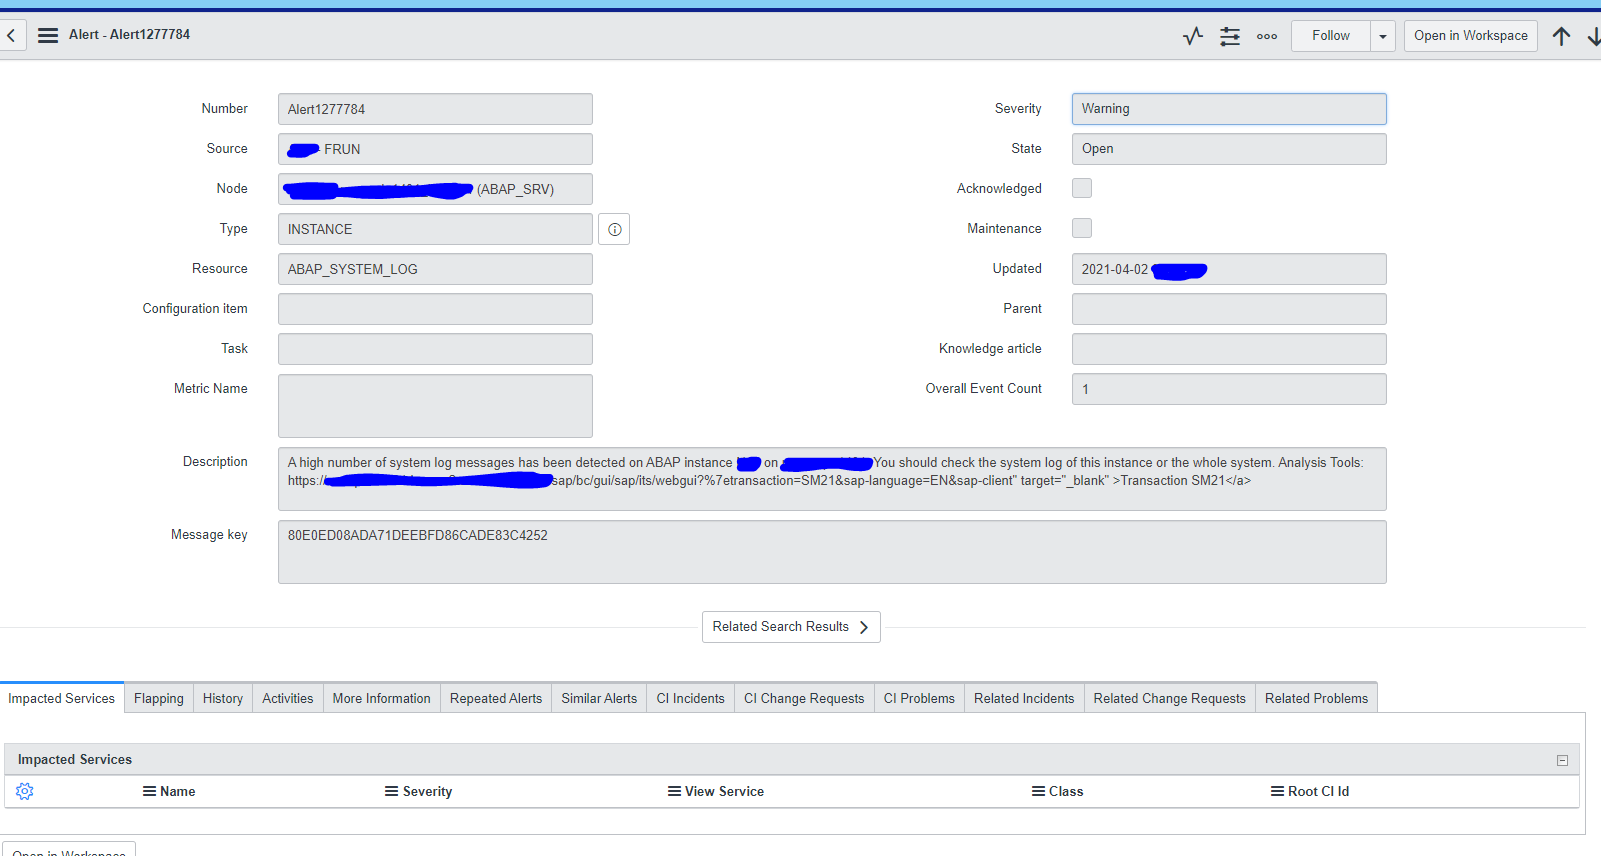
Link with alert management
Interface errors can be the trigger for an alert in the Alert Management function.
Technical scenario setup
e concept for interface monitoring is unfortunately a bit confusing at first.
There are 2 main things to remember:
- Systems data collection and alerting: this is where the action happens
- Graphical representation: this is where you make it visible
Unfortunately this means you have to do lot of double work.
Set up systems
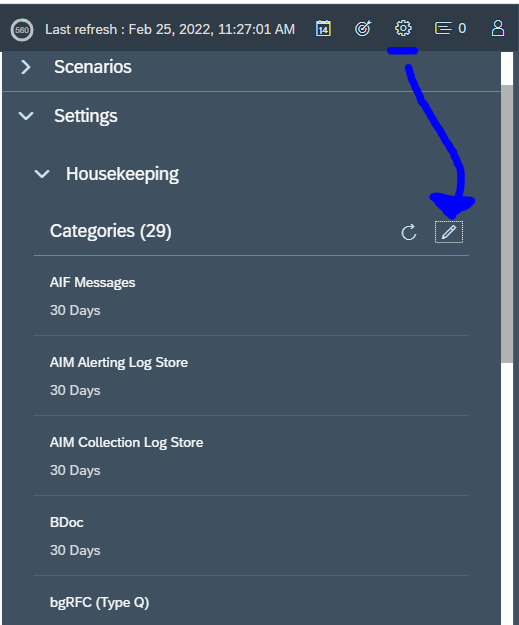
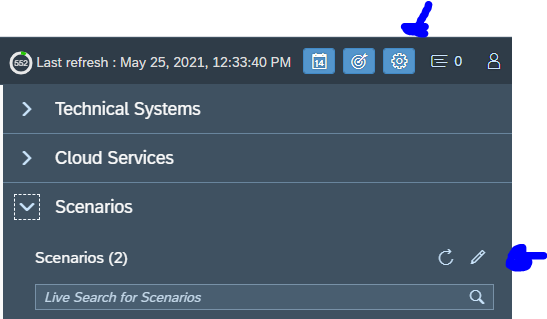
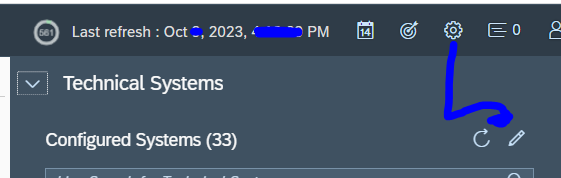
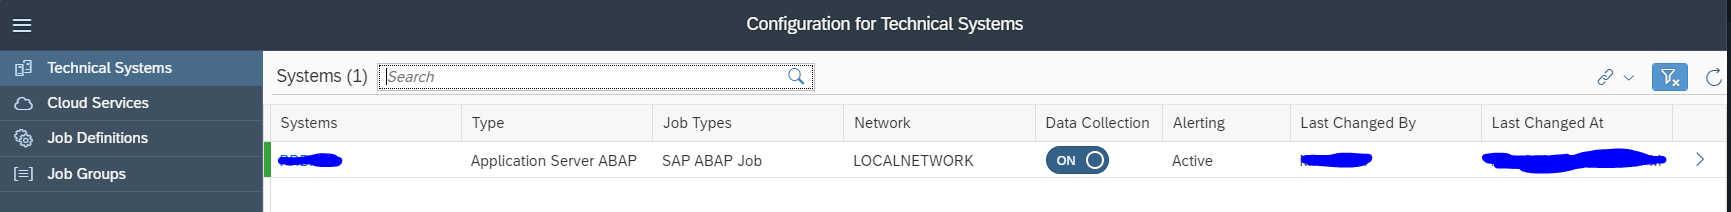
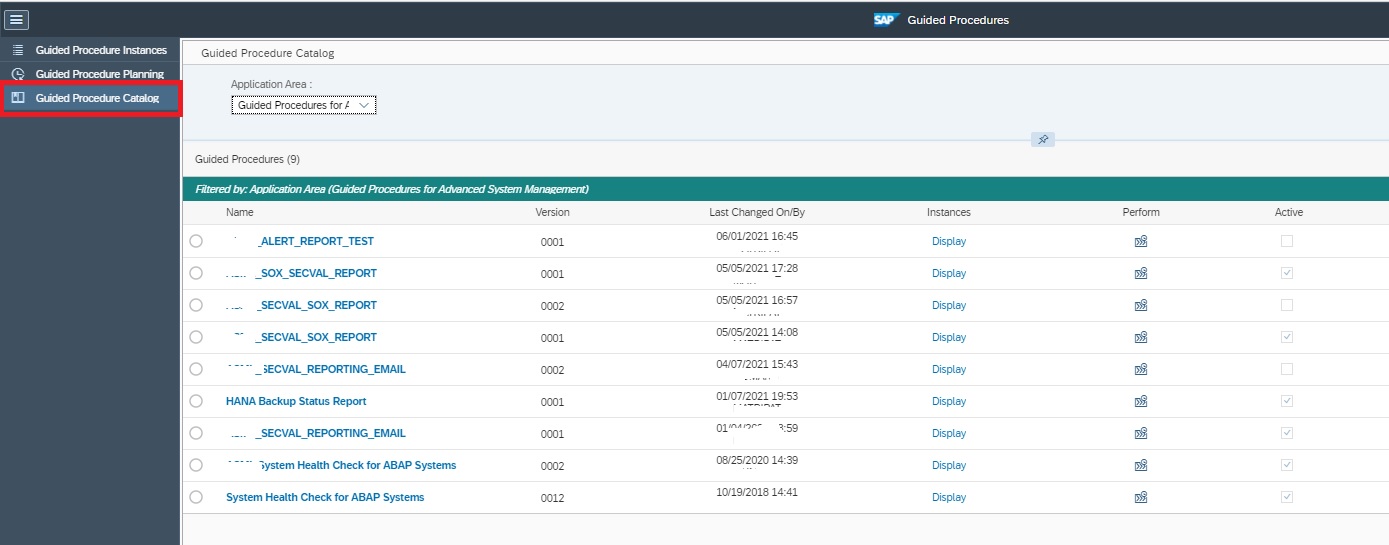
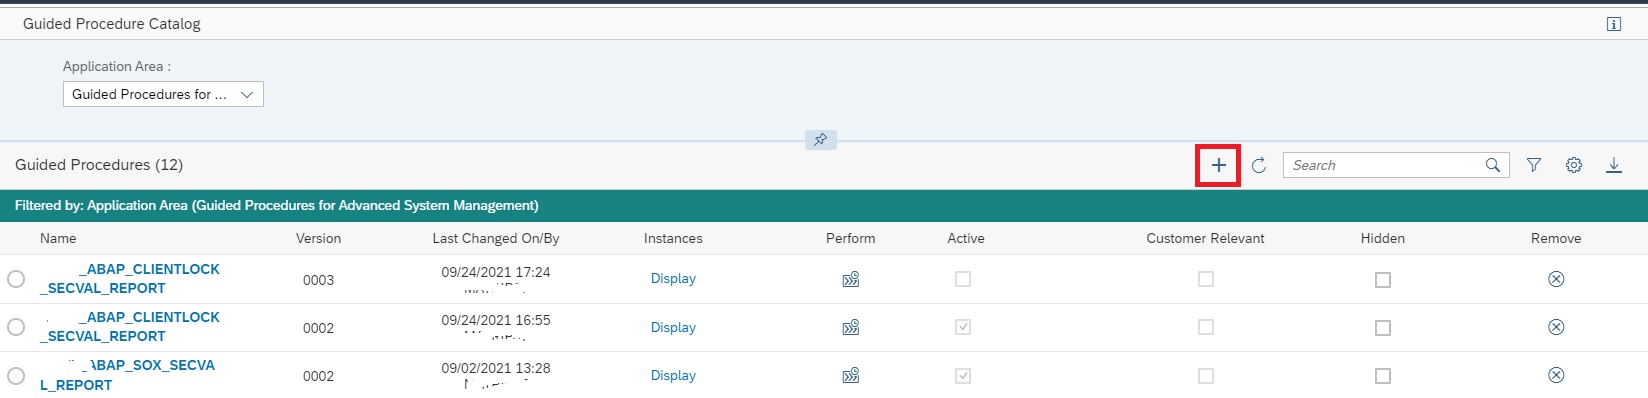
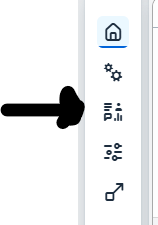
Go to the Integration and cloud monitoring Fiori tile. On top right click on the configuration icon to change or add a scenario:
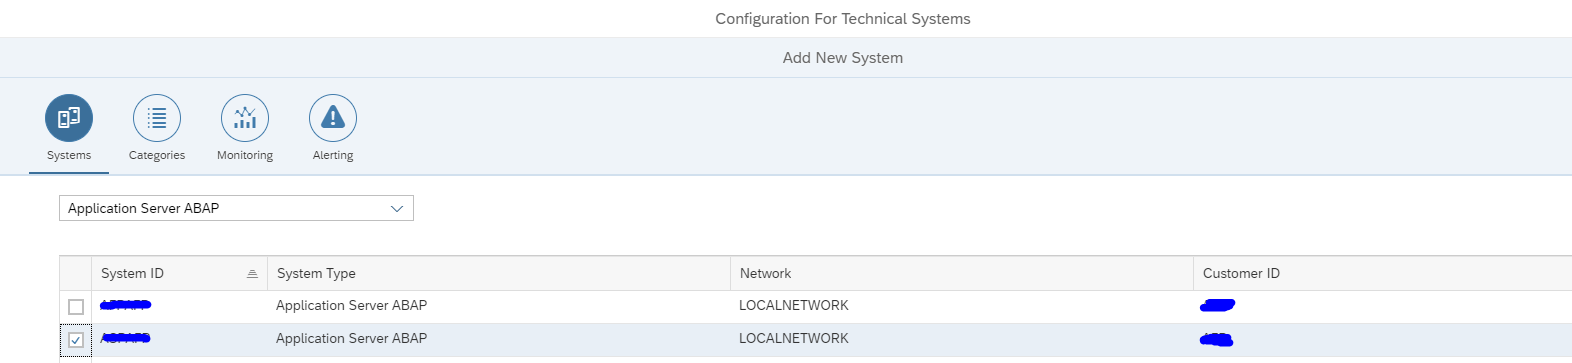
First add the systems:
Select the system:
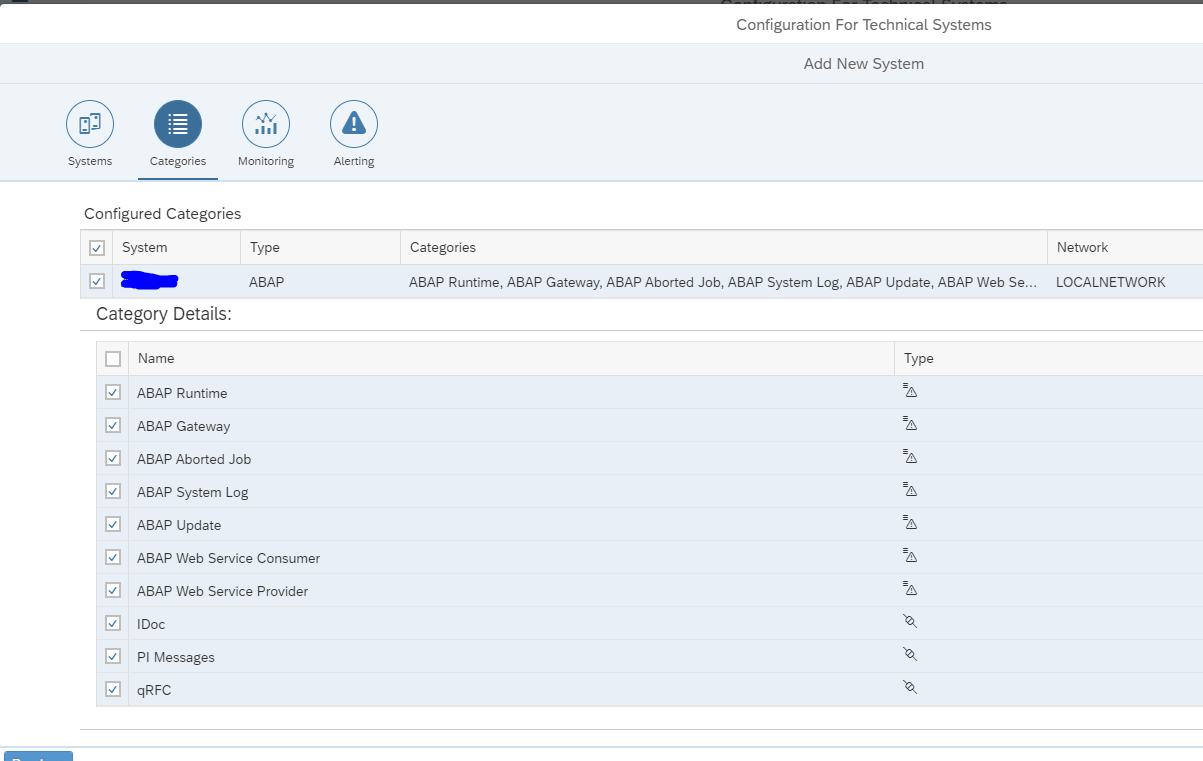
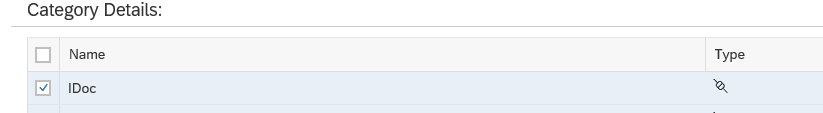
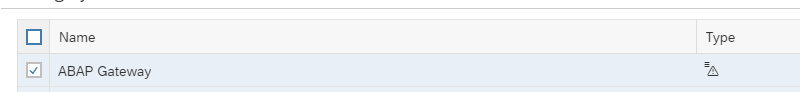
Select the configuration categories:
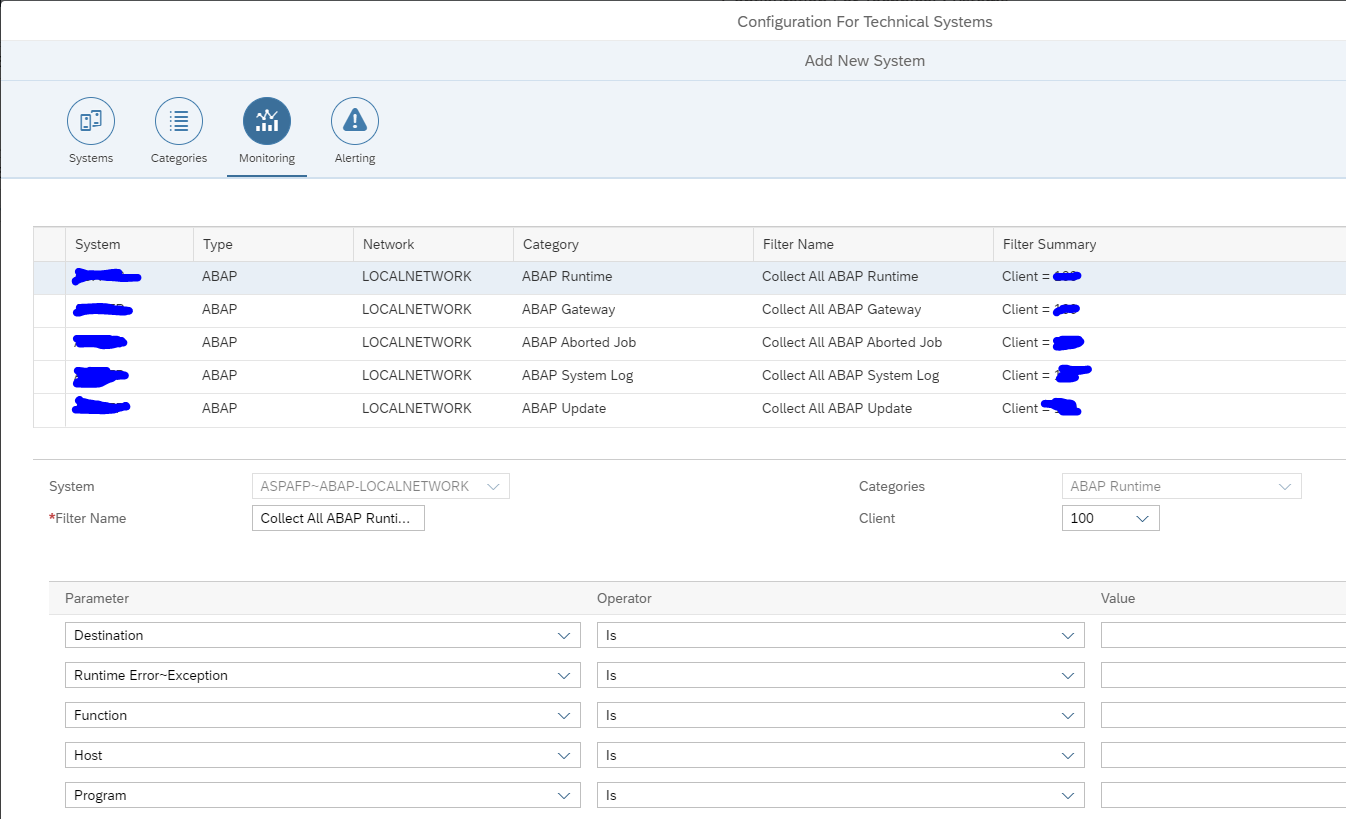
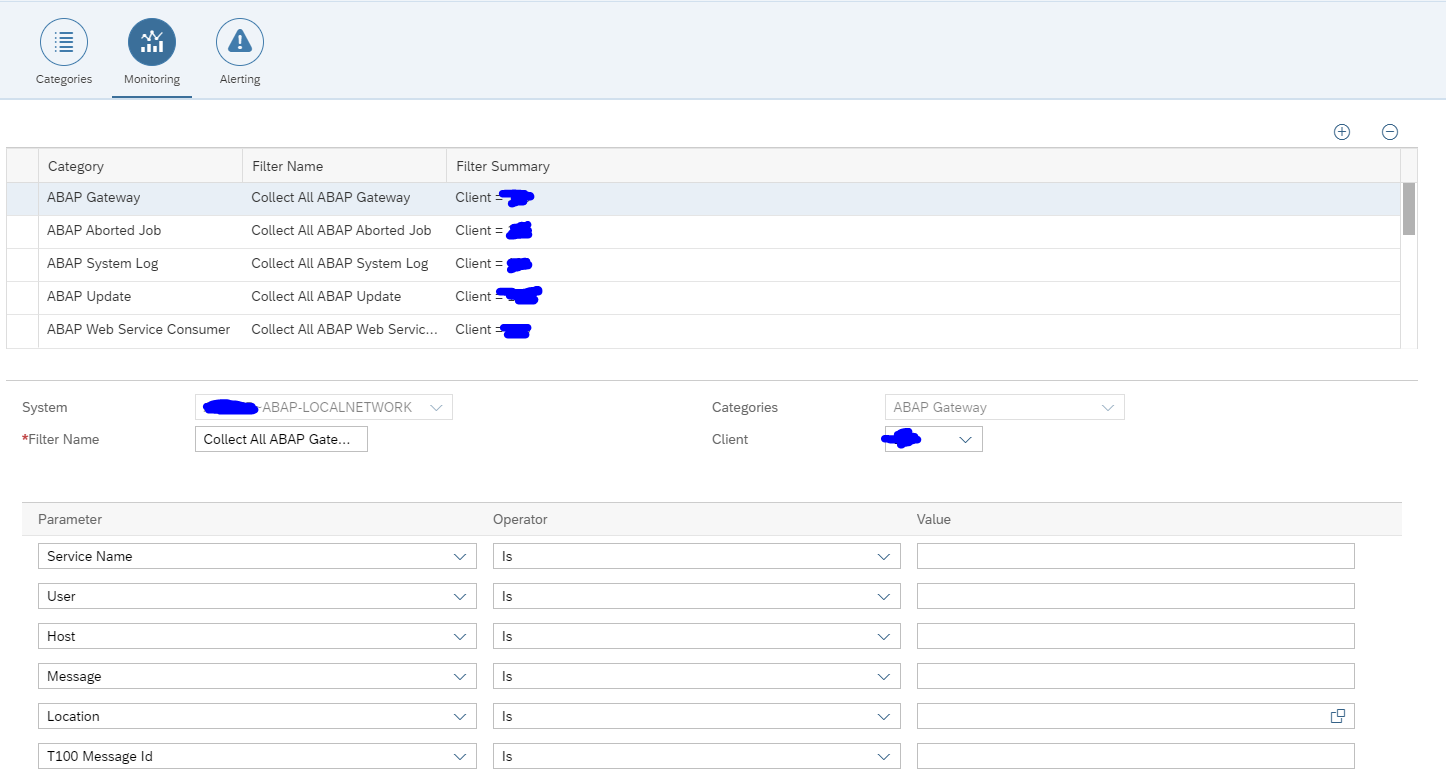
Select the monitoring:
Here you must add the connections you want to monitor.
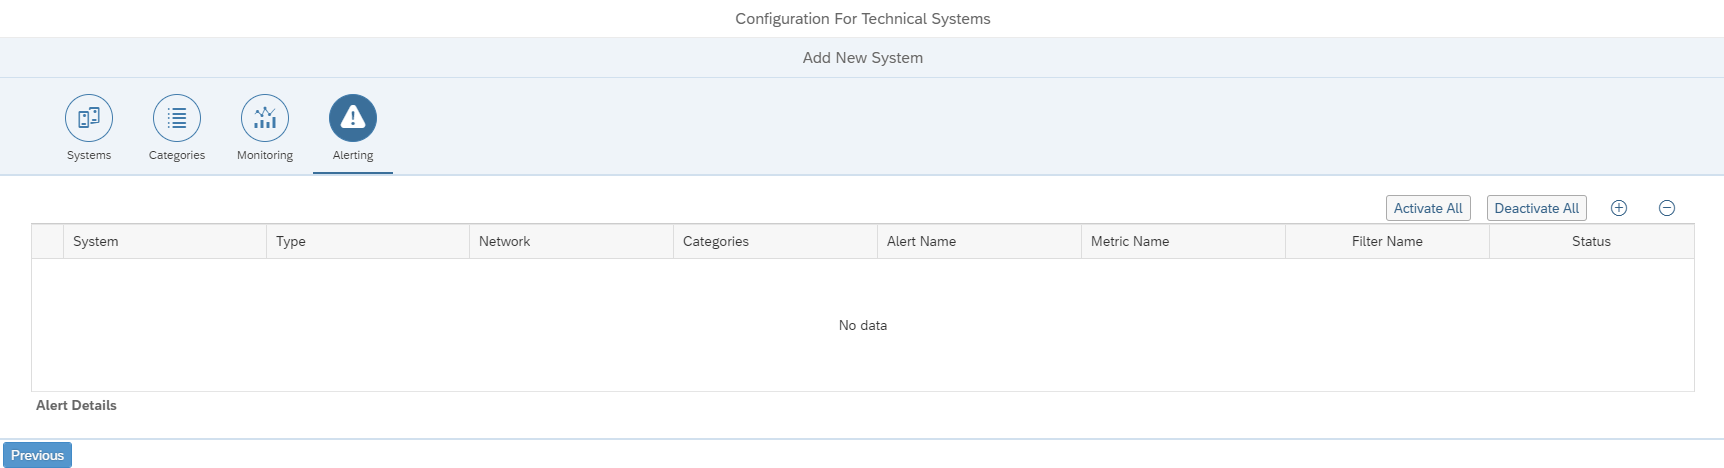
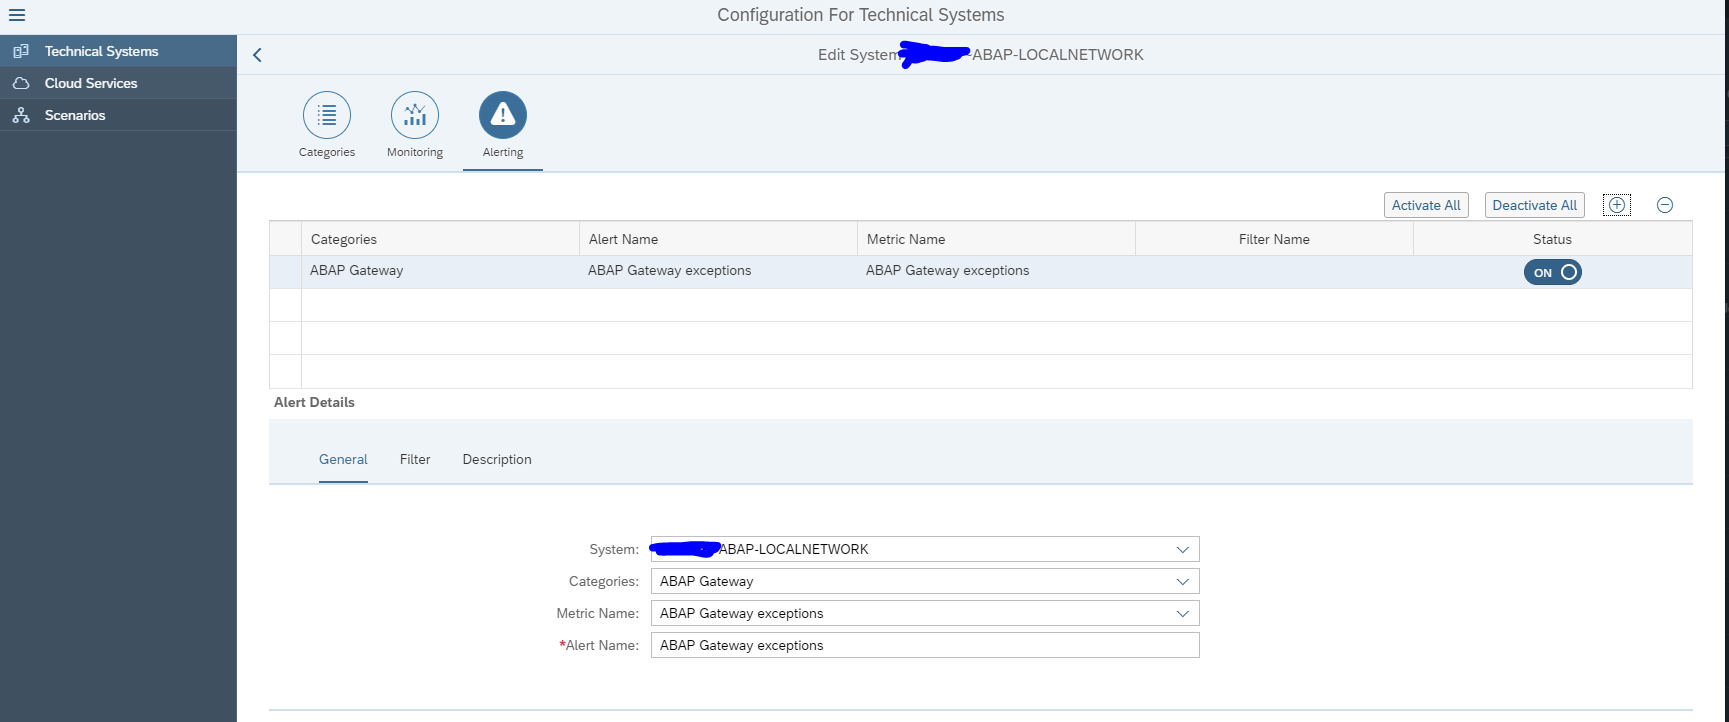
The alerting configuration is empty initially:
We will fill this later if we want alerts for a specific interface connection.
Save this system and repeat for the rest of the systems.
The system determines the actual data collection and actual alerting. The system can be re-used in multiple scenarios.
Scenario configuration
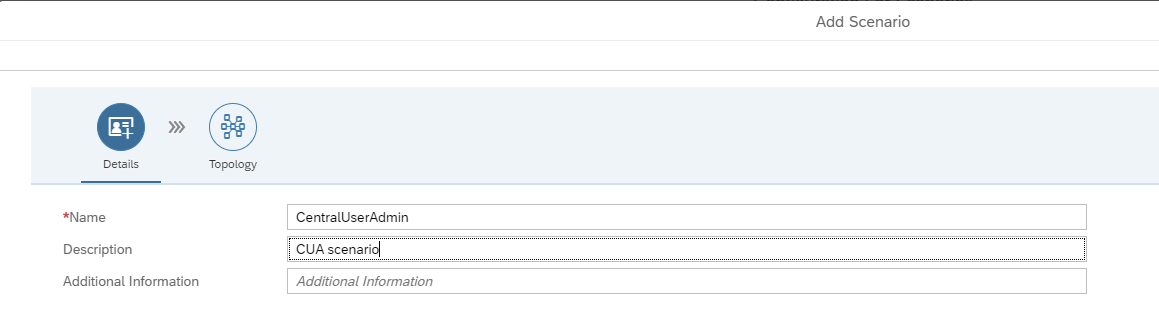
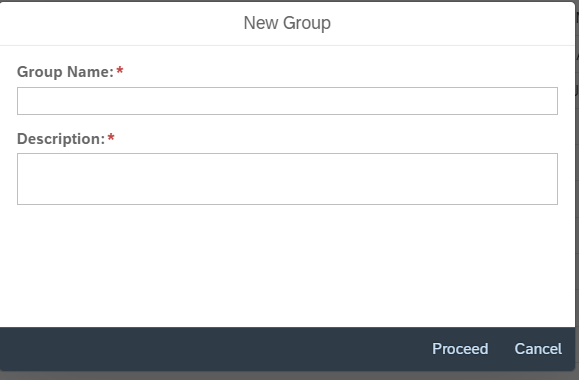
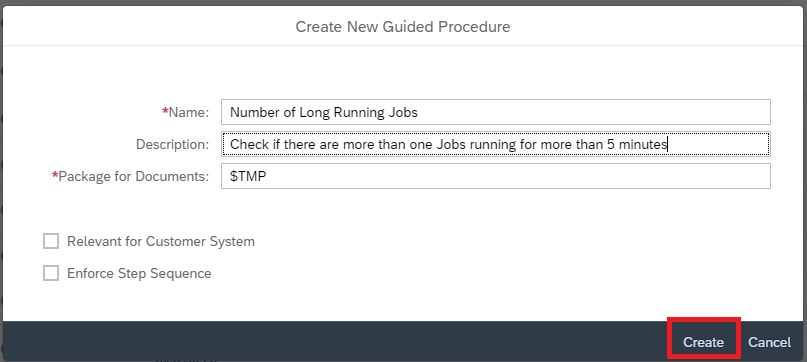
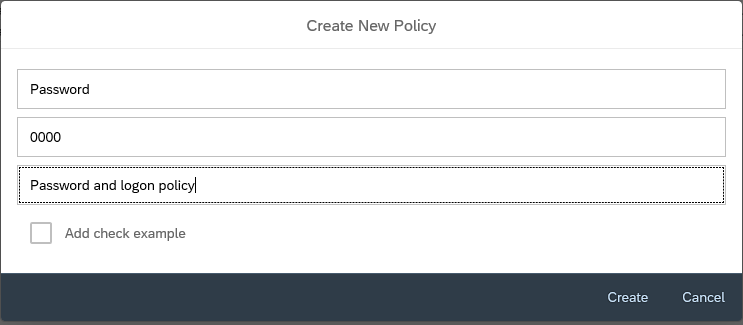
On the configuration screen now add the new scenario. Add a name and description for the scenario:
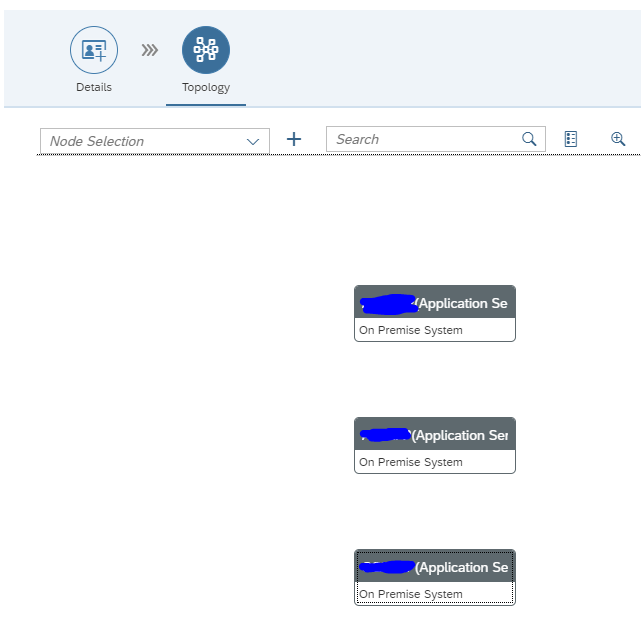
In the topology screen now add the systems in the drop down for Node Selection and use the + icon to add them to the screen:
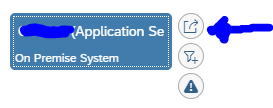
Now select the source system (we will have 1 CUA central and 2 child systems) and select the Action box:
Select Add link to and then select the system.
Now add a filter to the link by clicking on the line:
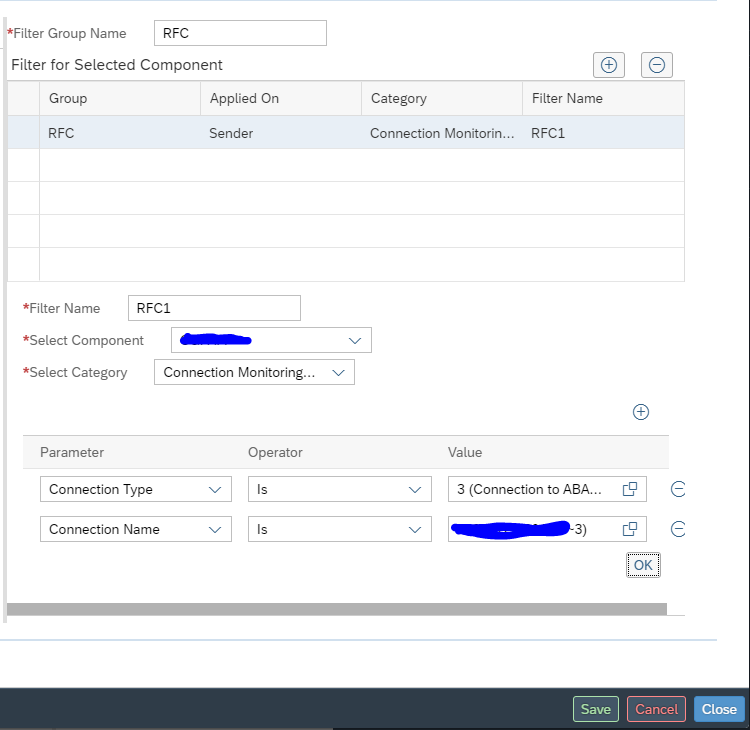
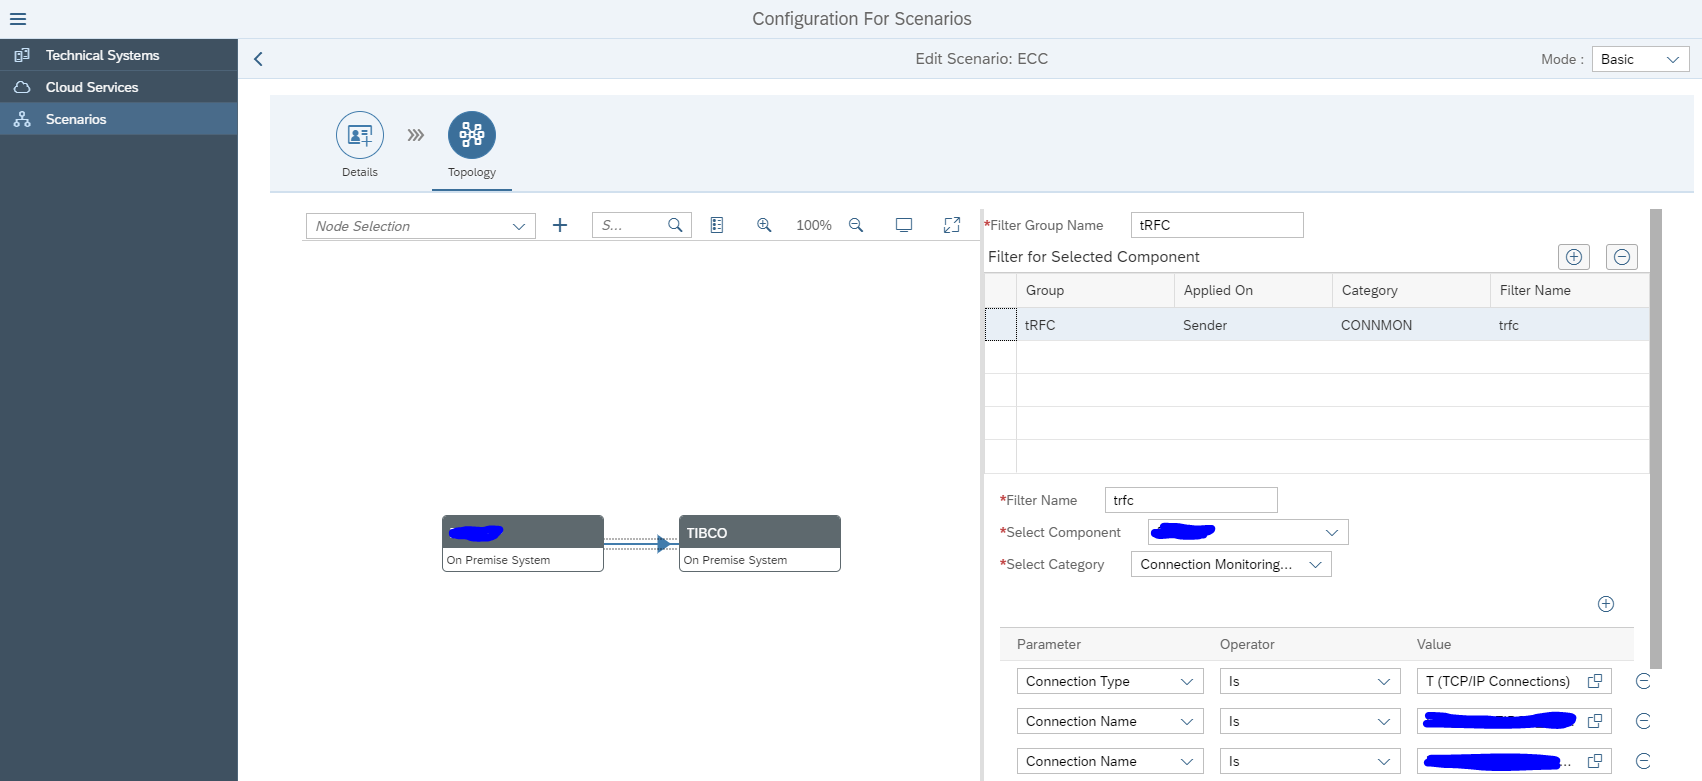
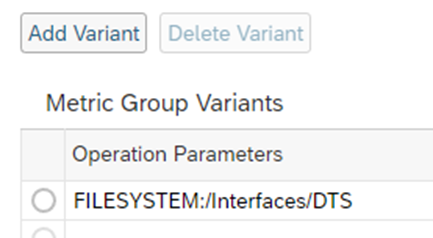
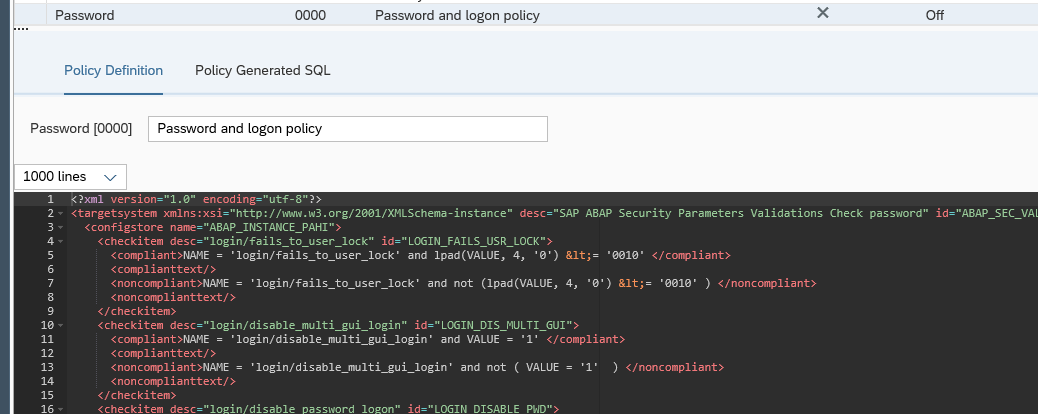
In the dialog screen on the right now add the details:
Start by giving the group a name. Now add the filter. Give the filter a name (in this case RFC1). Select the central component and the category (in this case Connection monitoring SM59). Now add the RFC connection type (3) and connection name to be monitored.
Very important here: press Ok first to transfer the data. Only then press Save. Otherwise your data is lost. SAP UI is not ok for this area.
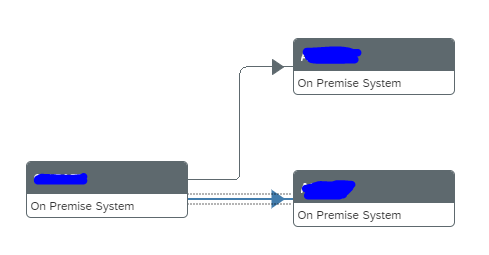
Repeat for the second scenario. The end result is that the dotted lines are replaced by straight lines:
Then Save.
The scenario is active now:
Reminder: you did have to add the same information in the system level as well in the Technical System as well: this will perform the data collection itself. If this is not done, then the scenario overview will show grey results for missing data collection.
The scenario is used to make the interfaces graphically visible.
Adding alert
When you have monitored the scenario long enough to see it is stable, the next step is to setup alerting so you get notified in the central alert inbox.
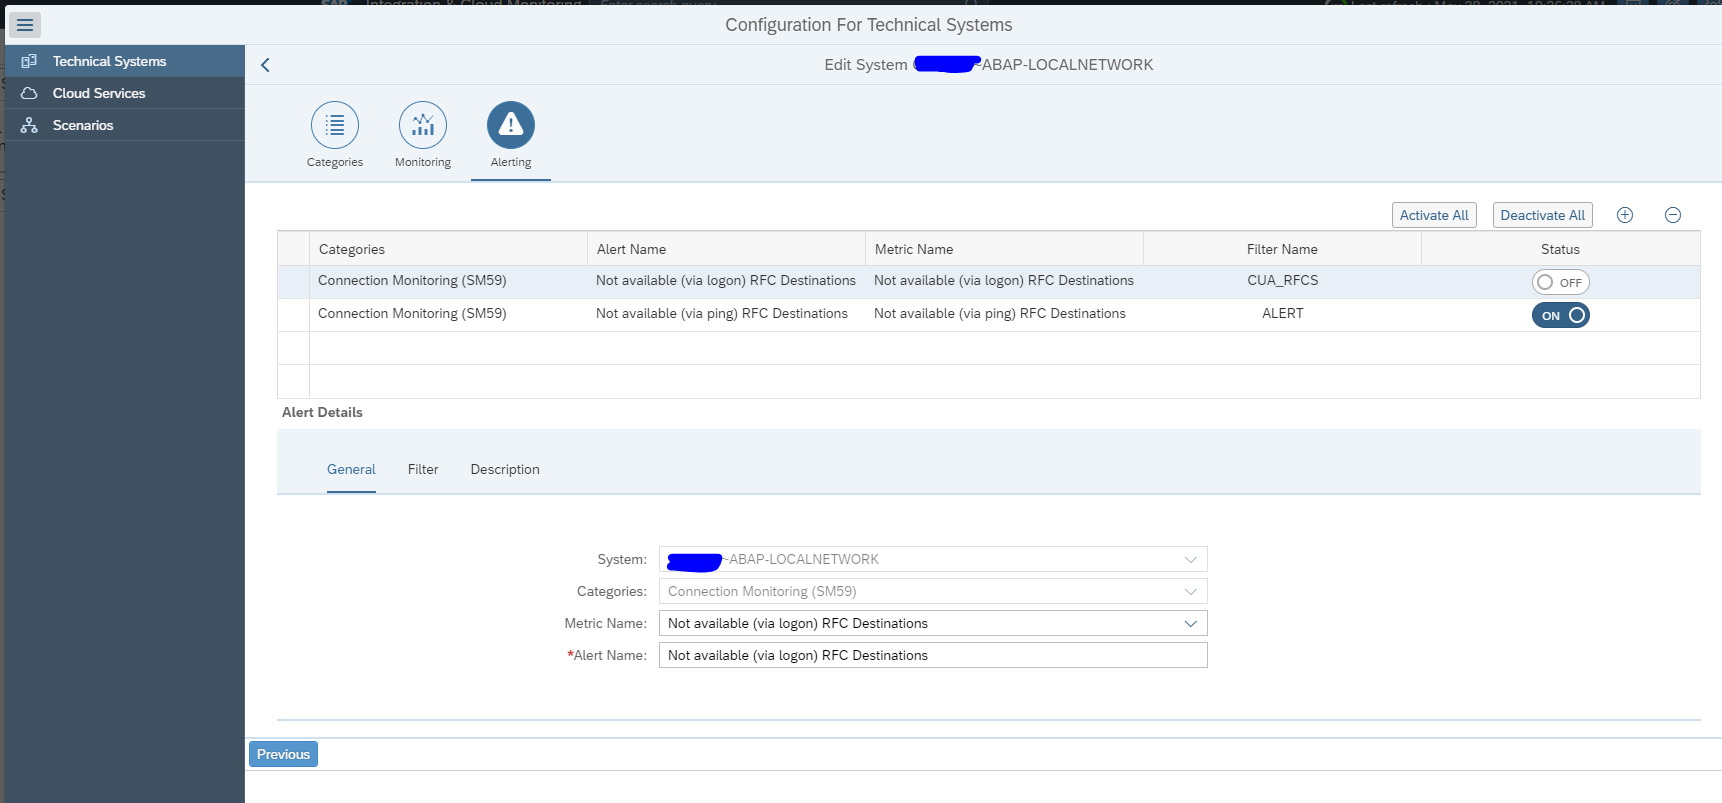
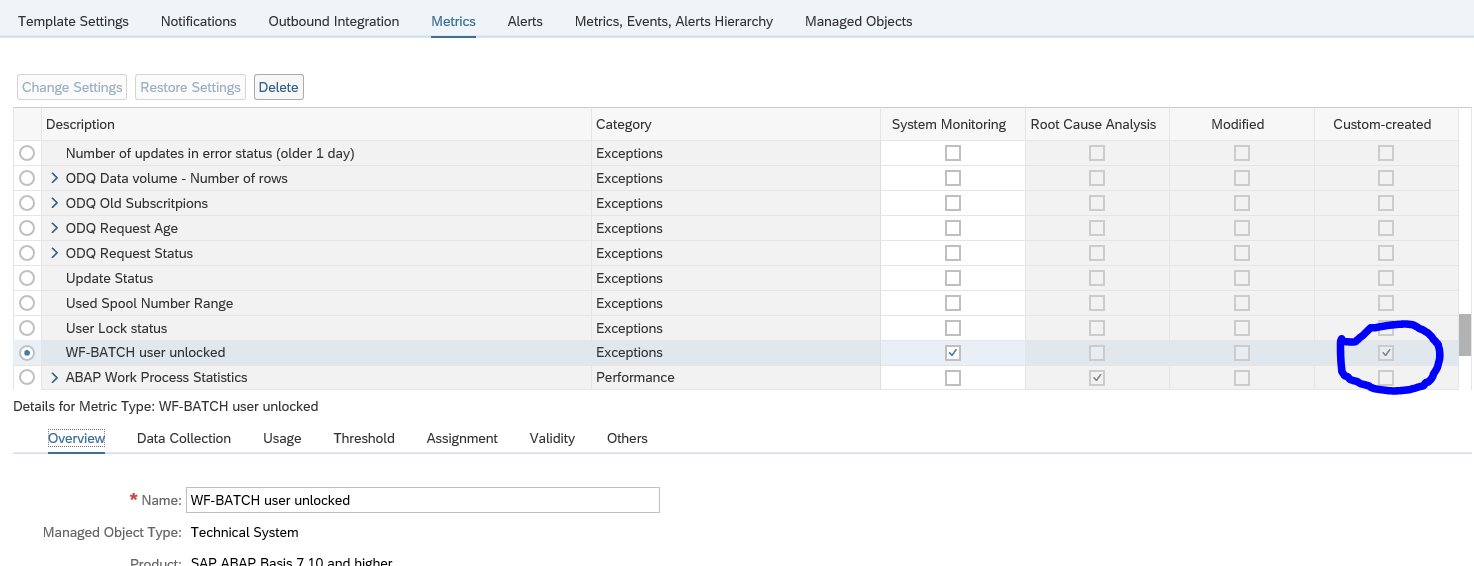
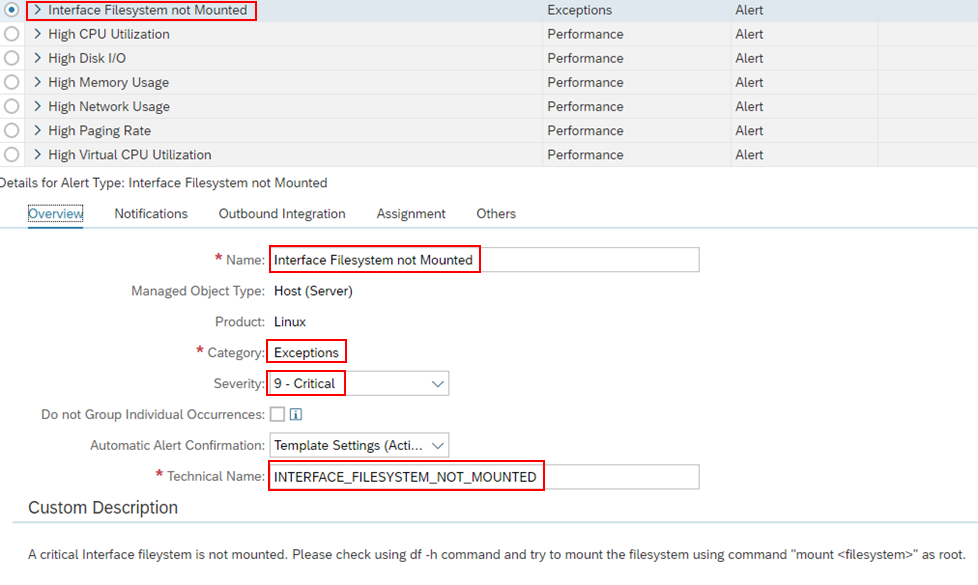
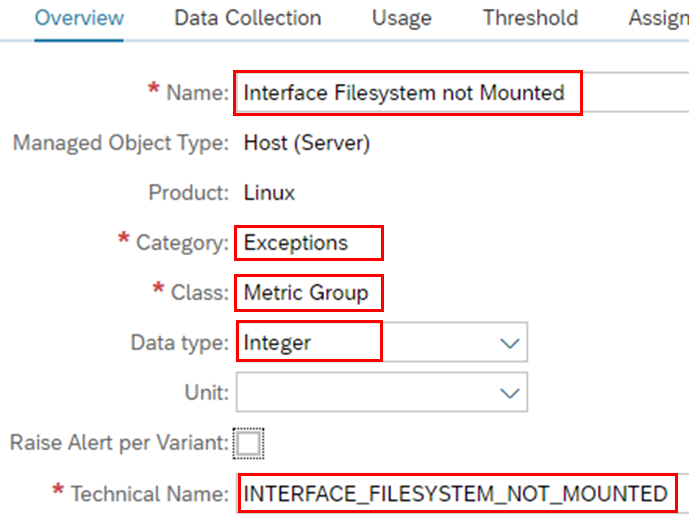
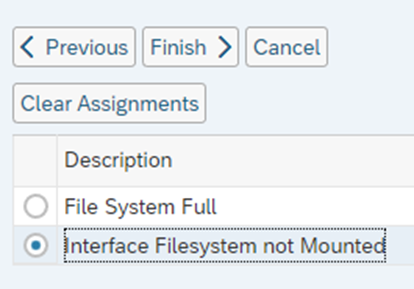
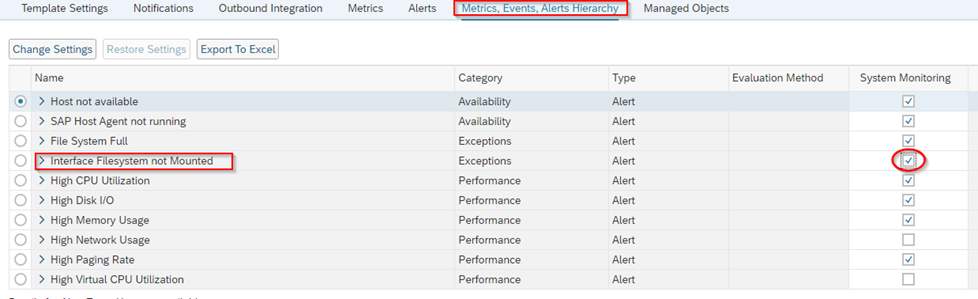
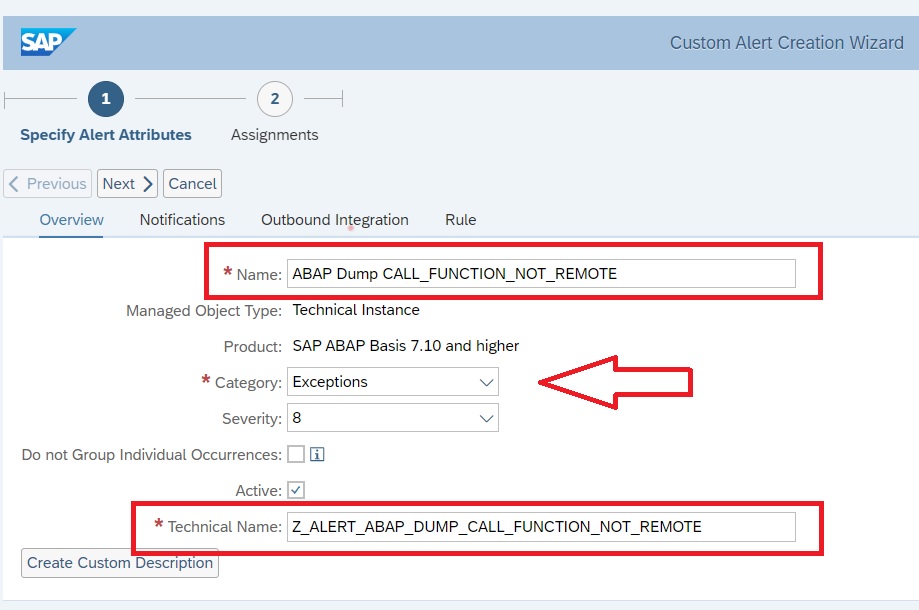
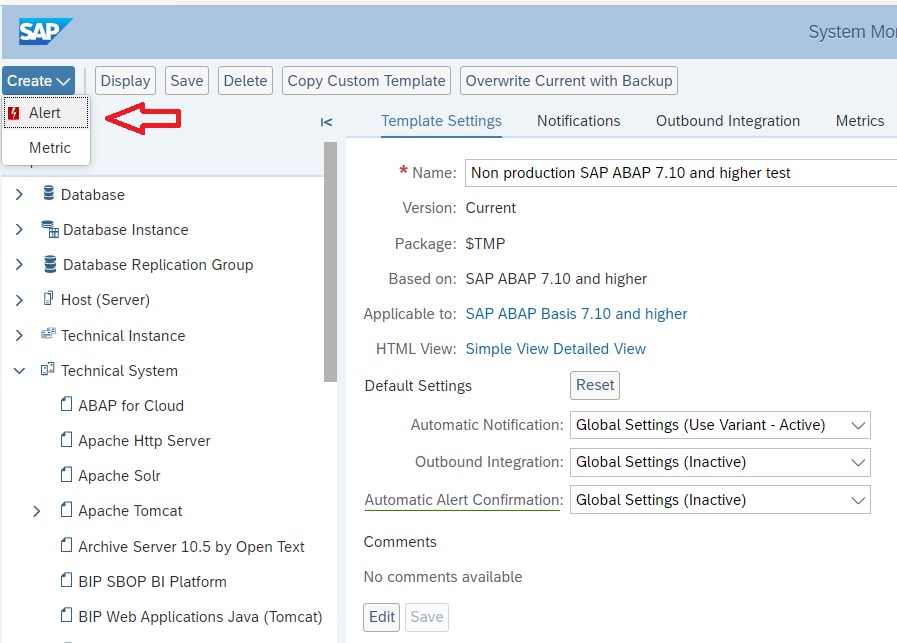
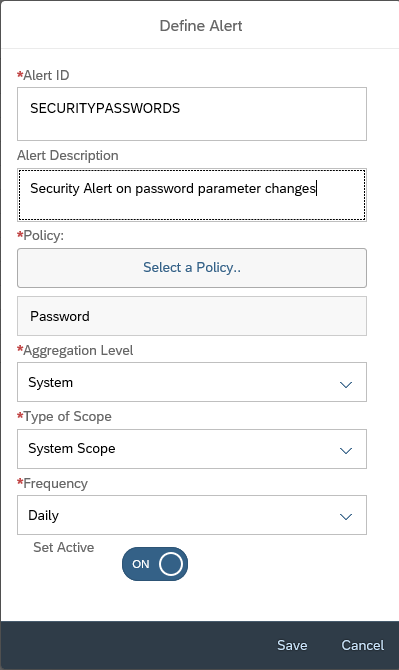
First add the alert in the Technical System as shown above. This will be the actual alert definition.
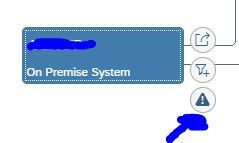
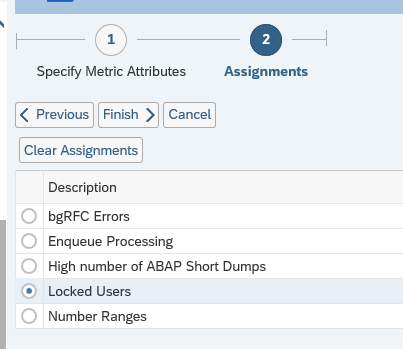
To add an alert to the graphical overview, go to the scenario definition and select the source system. Press the button alerts for component:
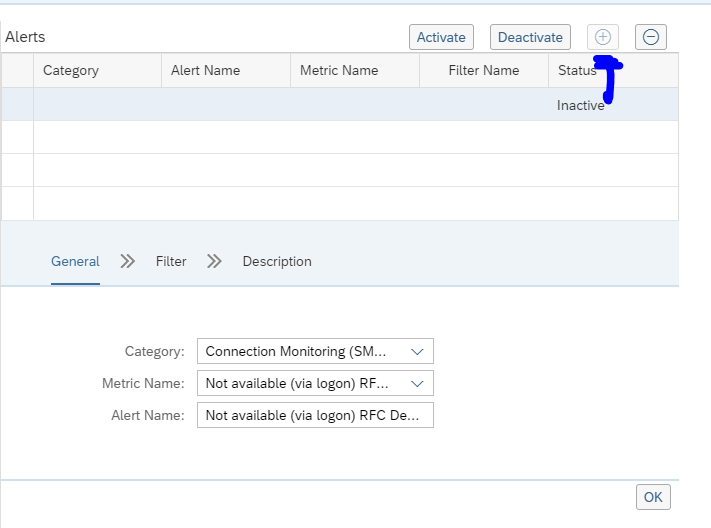
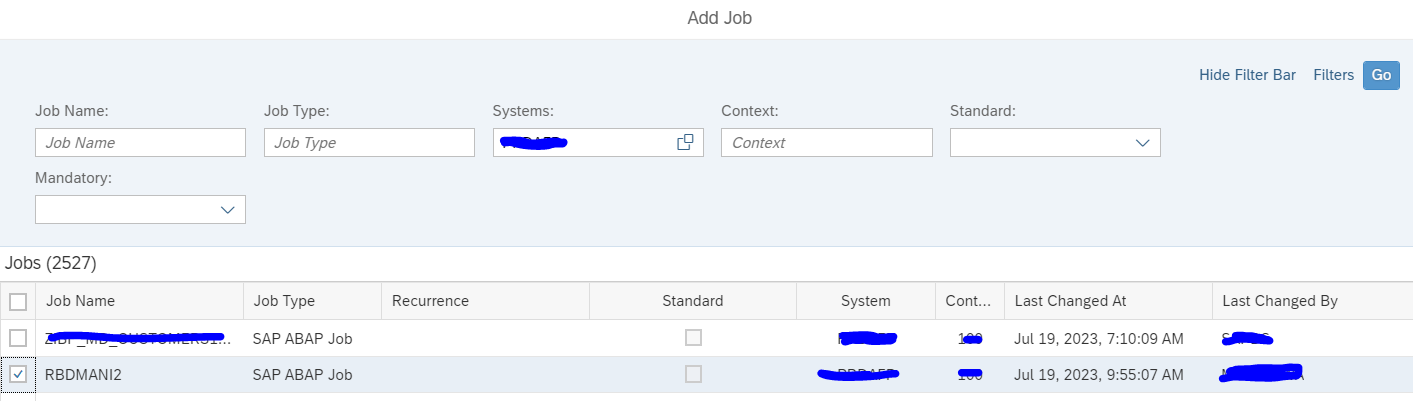
On the right hand side now add the alert by clicking the + button:
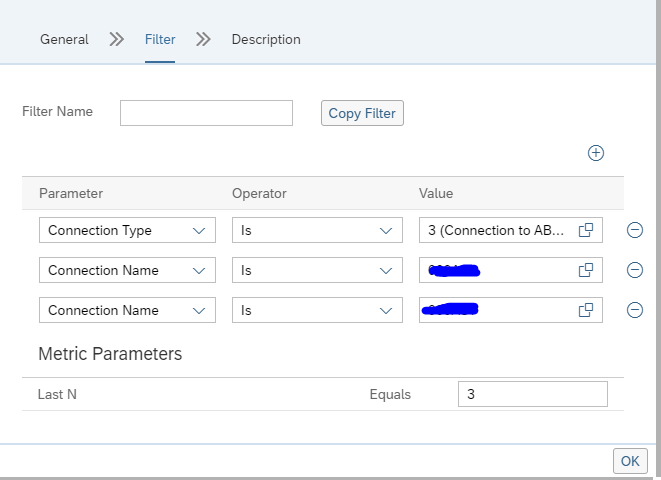
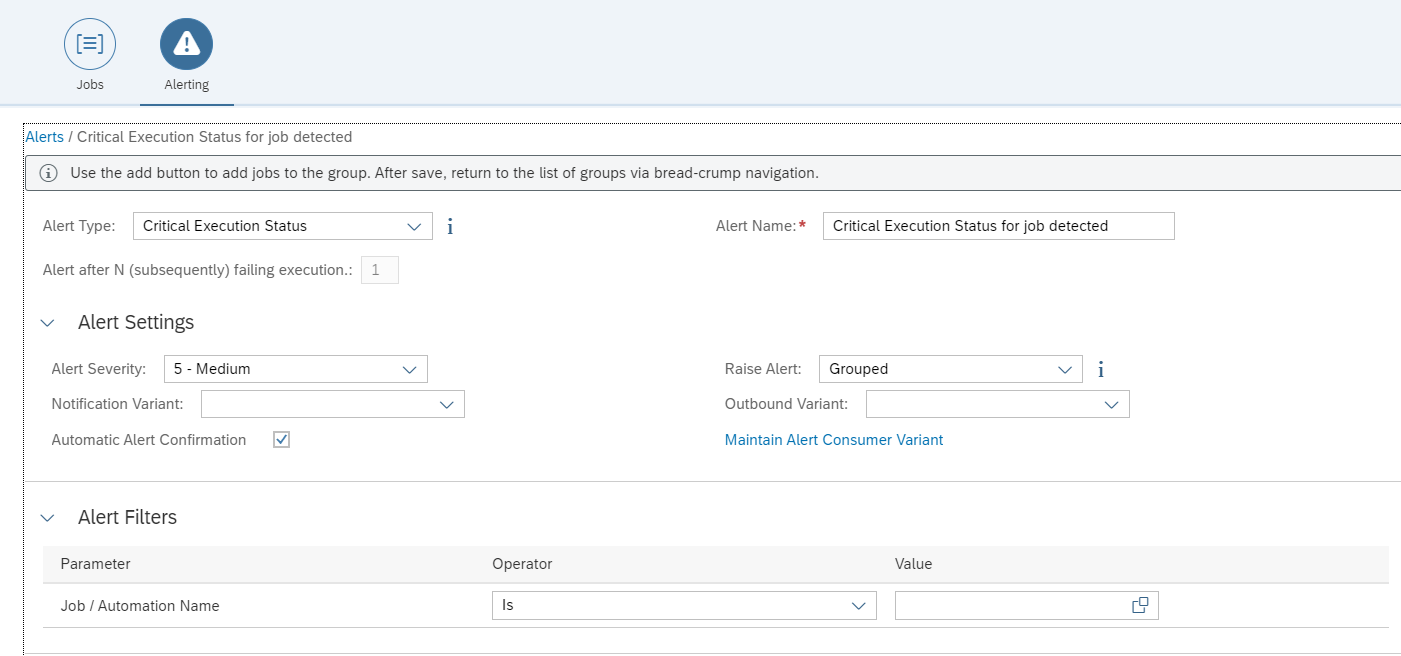
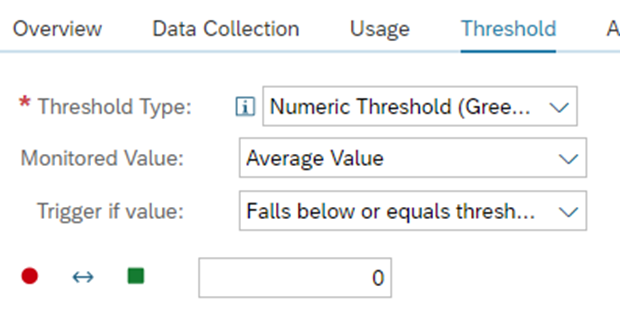
Then select the wanted Alert Category. And select the filter options. Add the connections for which you want to alert:
Give the filter also a name.
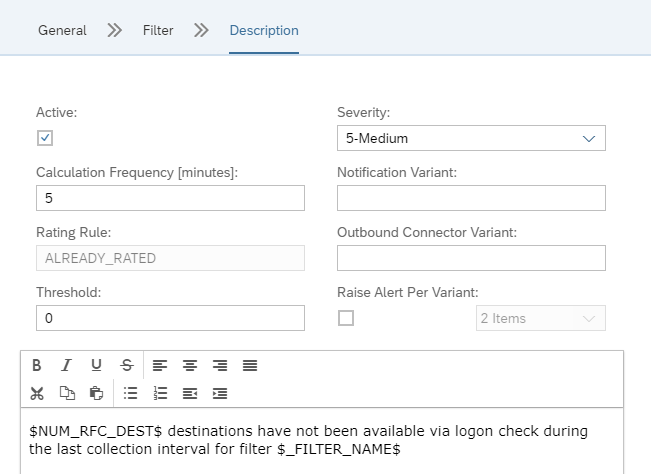
On the Description field you can set the alert to active:
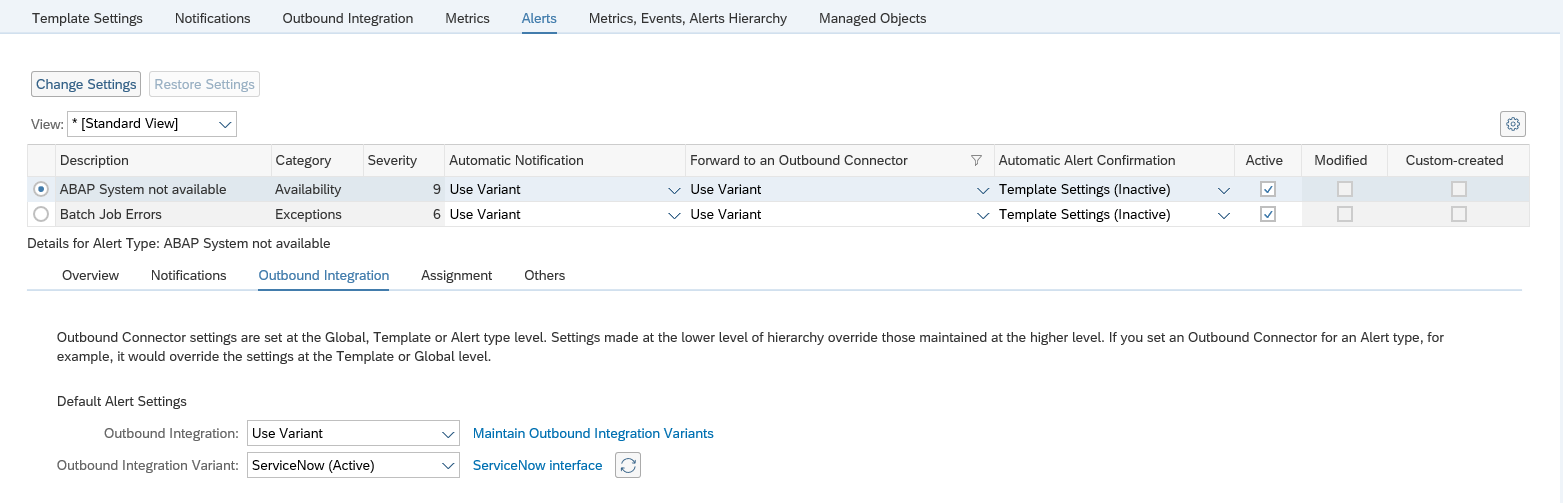
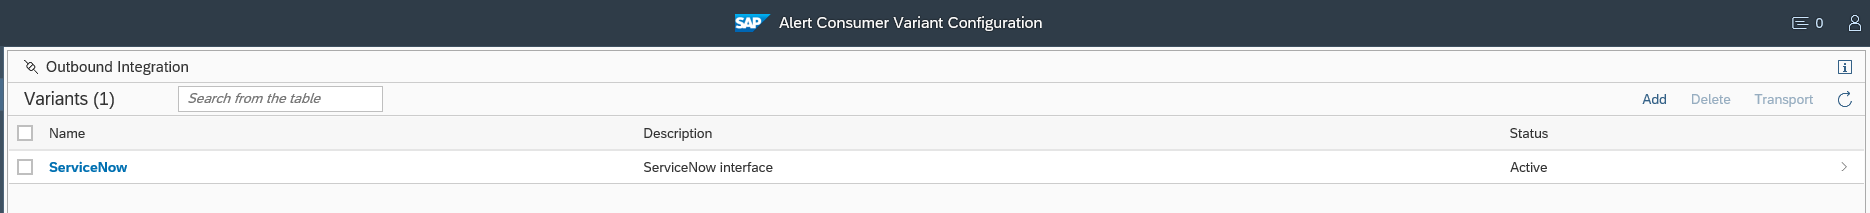
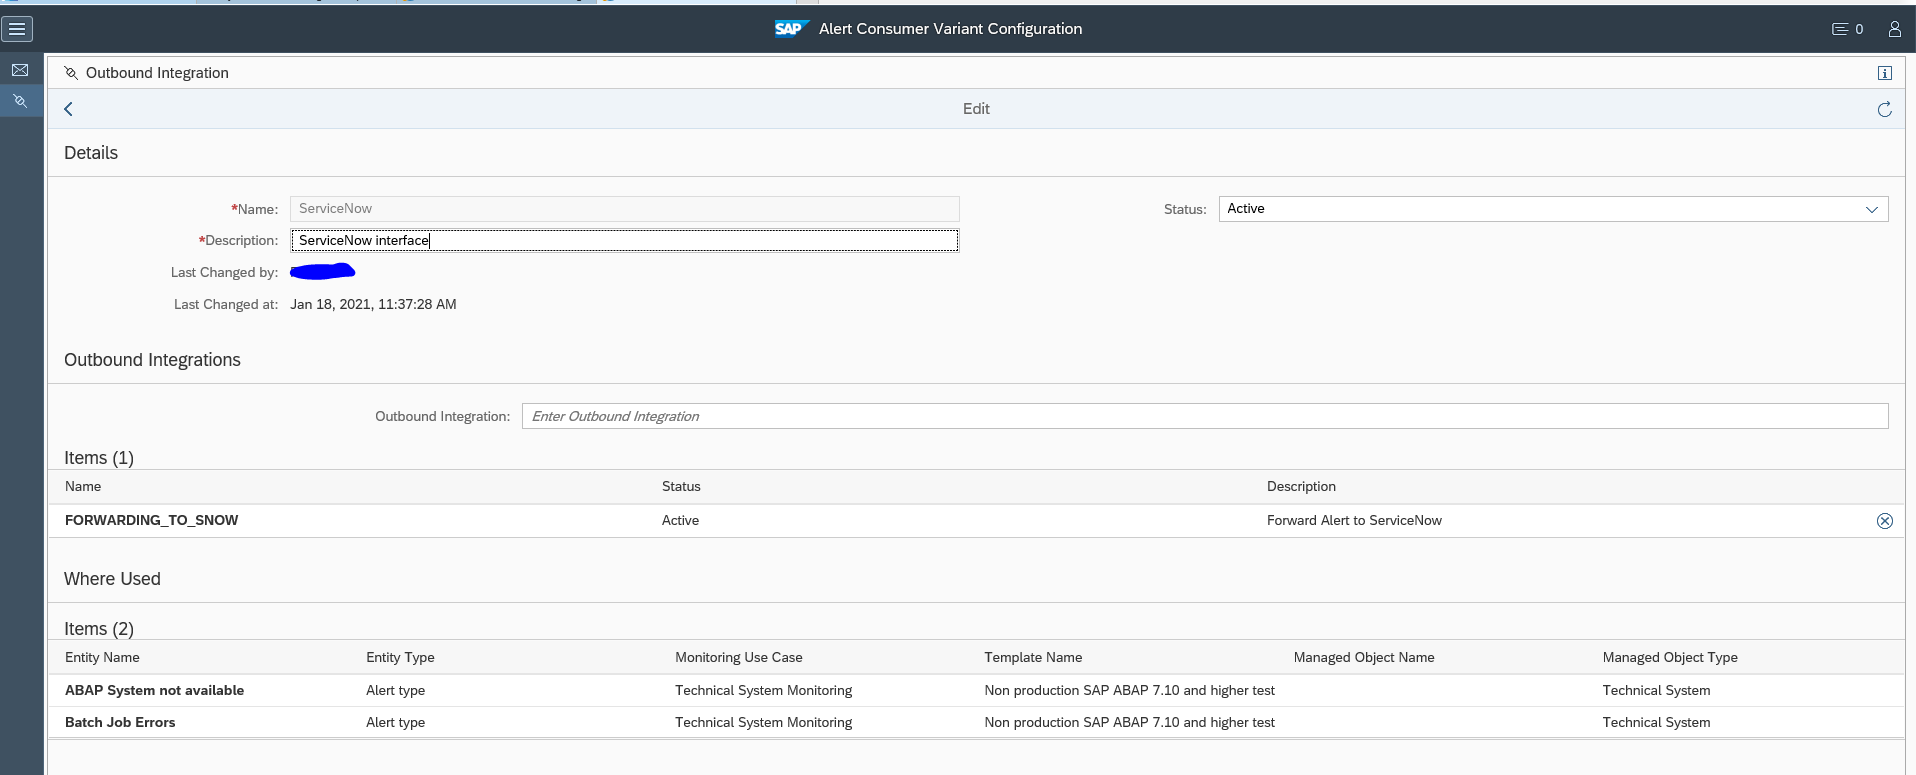
You can also set the frequency of checking, and if an notification is to be send as well (via mail or towards outbound connector).
Also important here: first press Ok, then Save. Otherwise the data is lost.
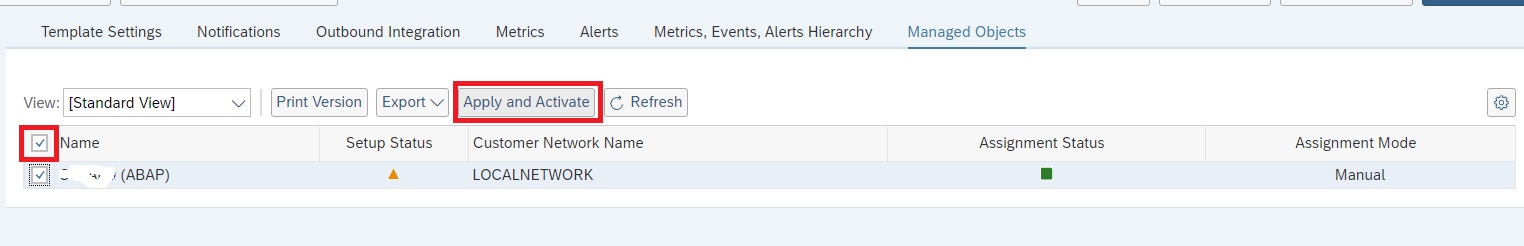
Set up Summary and final check
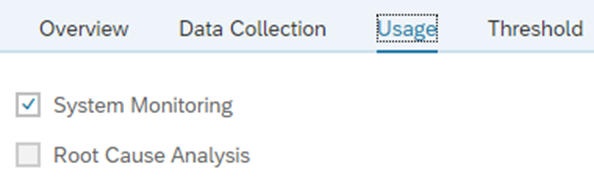
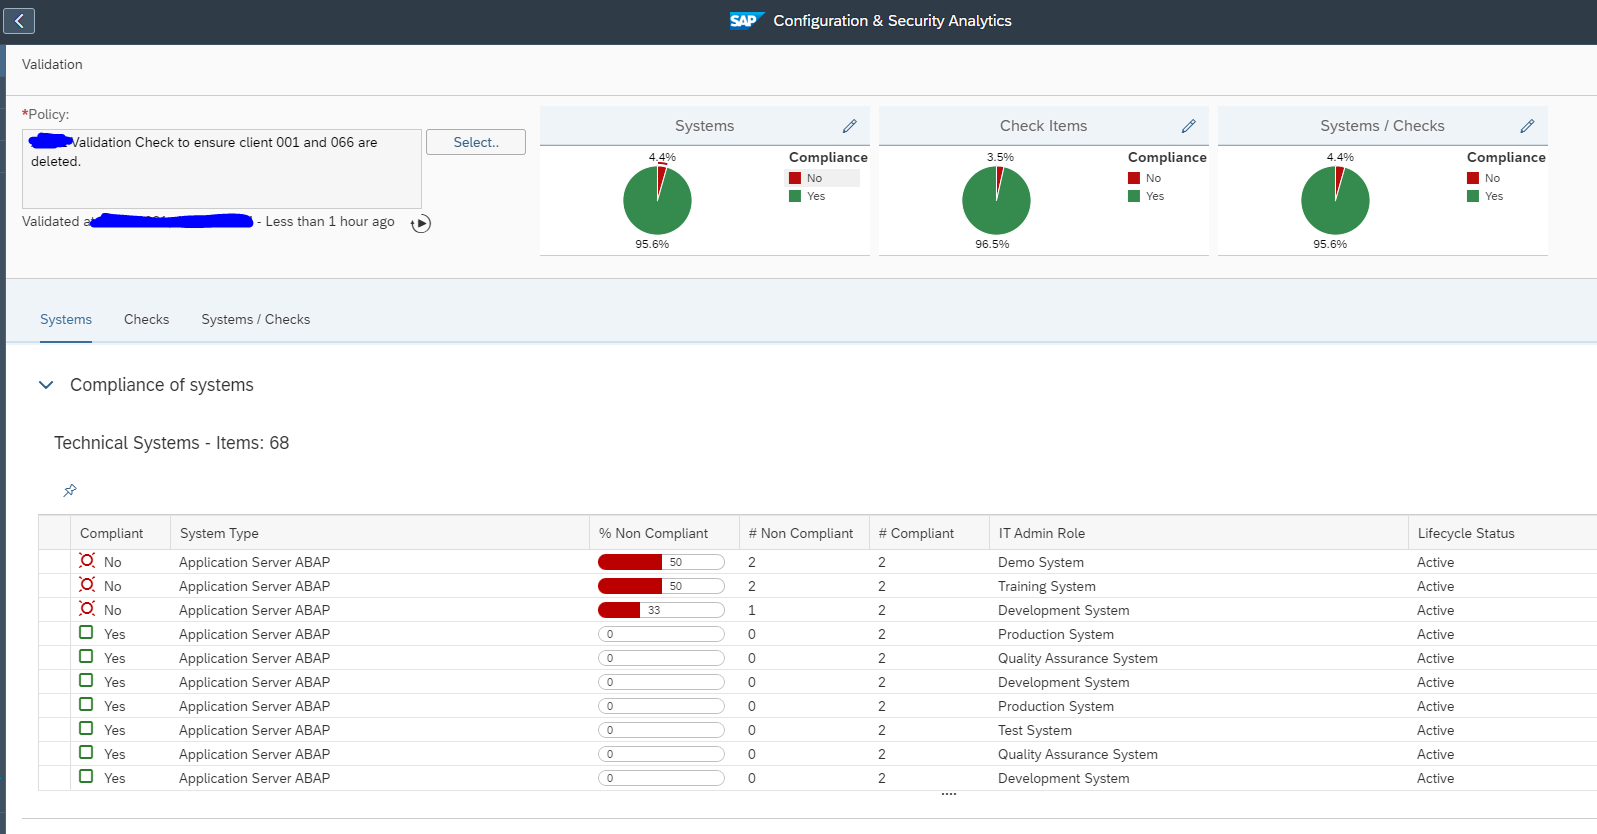
After you have finished the graphical topology, you need to go back to the Systems overview to validate if everything is activated ok for both monitoring and alerting:
Reminder: there is a split in graphical representation in the topology and scenarios and the actual system monitoring and alerting in the Technical System overview.
Interfaces that can be monitored
Full list of interfaces that can be monitored is published on the Focused Run expert portal.
Specific interface monitoring topics are explained below:
- Idoc monitoring
- ODATA Gateway monitoring
- qRFC monitoring
- RFC monitoring
- SLT monitoring
- Web Service monitoring
Idoc monitoring
SAP Focused Run can both report on idoc errors and delays in idoc processing. Delay in idoc processing can cause business impact and is sometimes hard to detect, since the idocs are in status 30 for outbound, or 64 for inbound, but are not processed. SAP Focused Run is one of the only tools I know which can alert on delays of idoc processing.
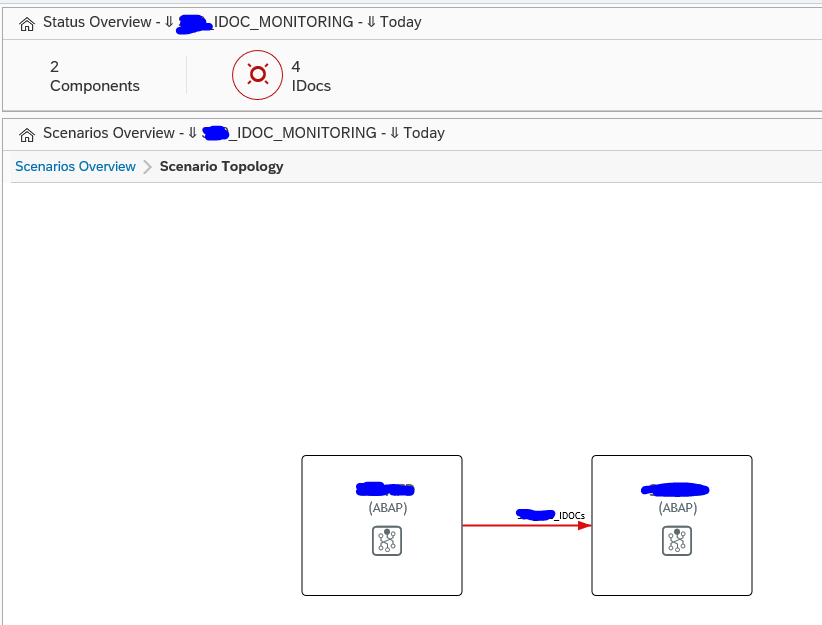
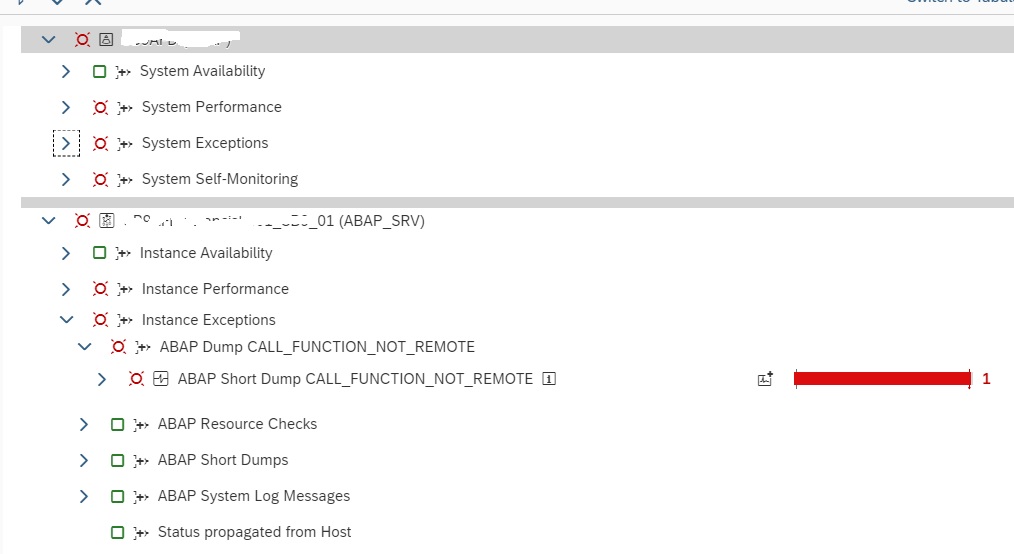
The monitoring starts with the Integration & Cloud monitoring tile. Then select the modelled idoc scenario (modeling is explained later in this blog):
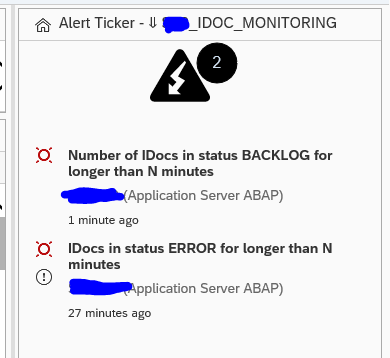
On the alert ticker you can already see there are alerts for both idocs in error, but also alerts for idocs in delay:
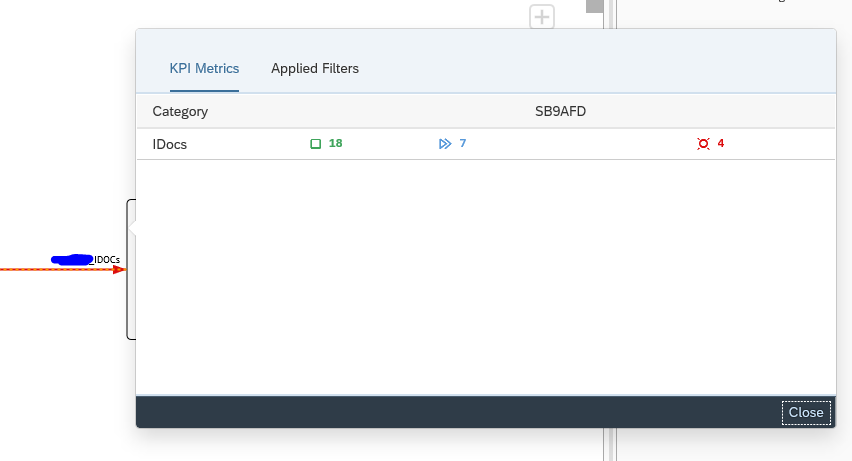
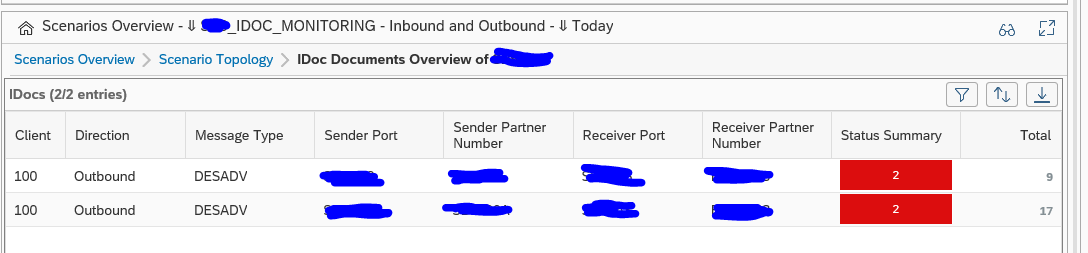
In the main overview screen click on the interface line to get the overview of idocs sent:
You can now see the amount of idocs that were sent successfully, which are still in transit and which ones are in error. Click on the number to zoom in:
Click on the red error bar to zoom in further to the numbers:
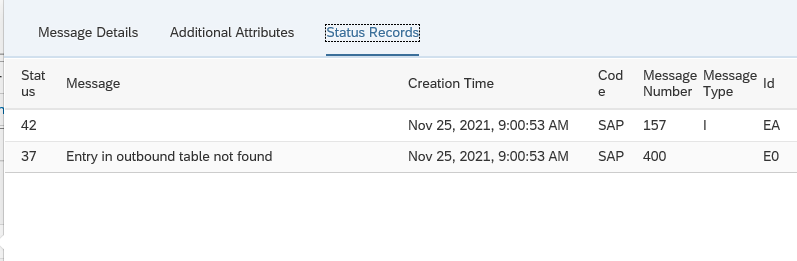
Click on the idoc number to get further details:
Unfortunately, you cannot jump from SAP Focused Run into the managed system where the idoc error occurred.
Documents monitor for idocs
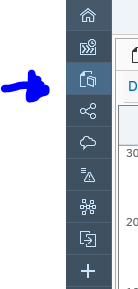
A different view on the idocs can be done using the documents monitor. You can select the documents monitor tool on the left side of the screen:
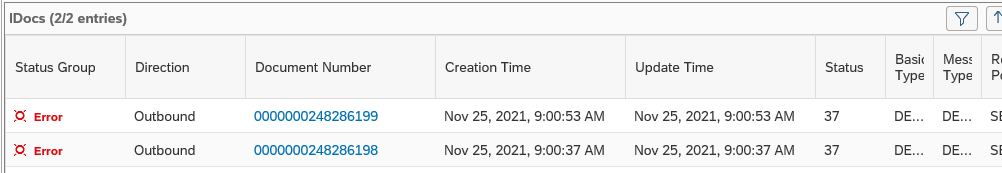
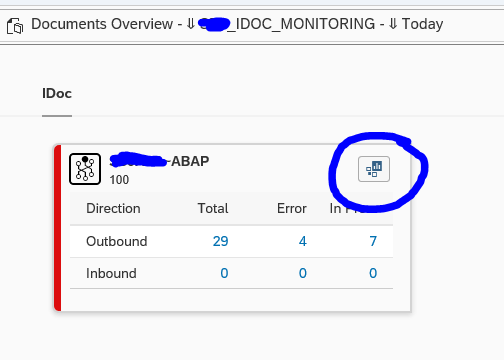
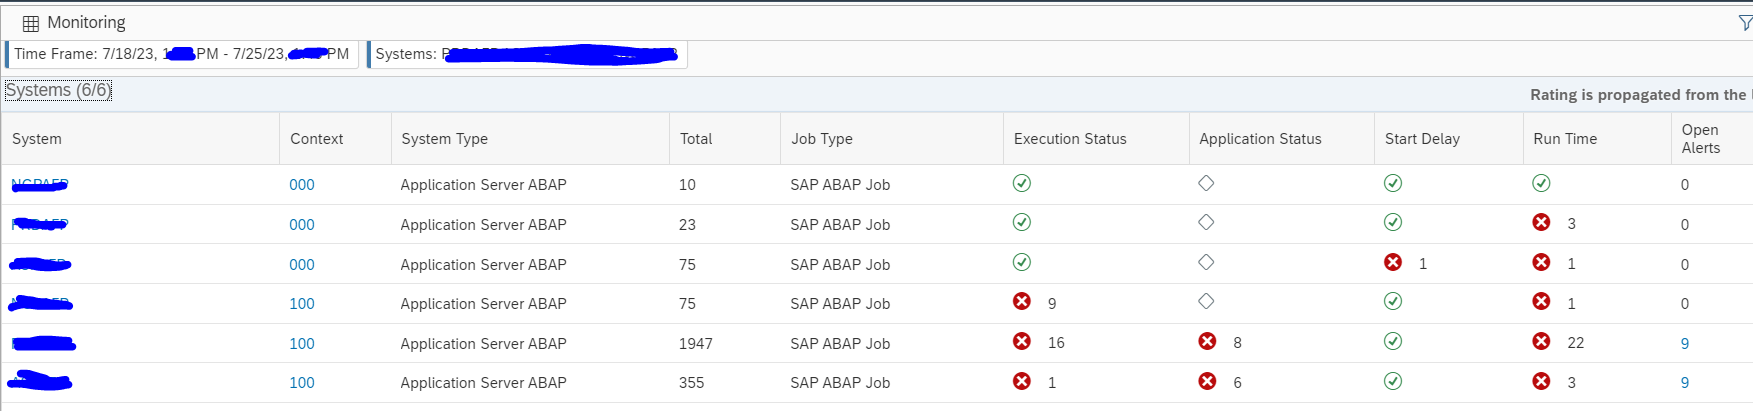
Now you goto the overview:
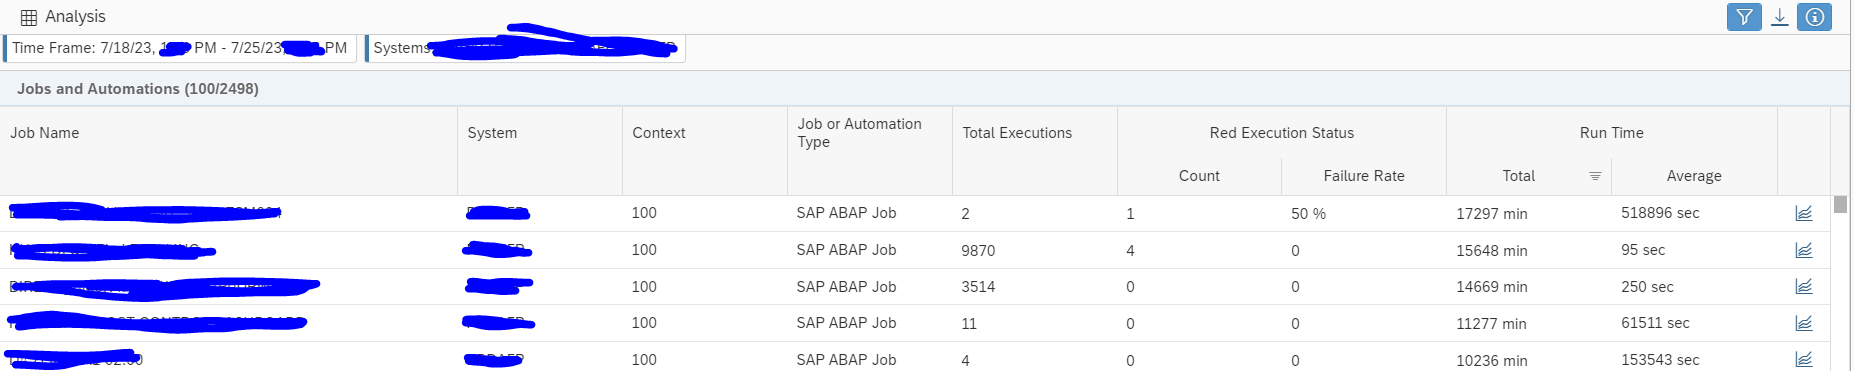
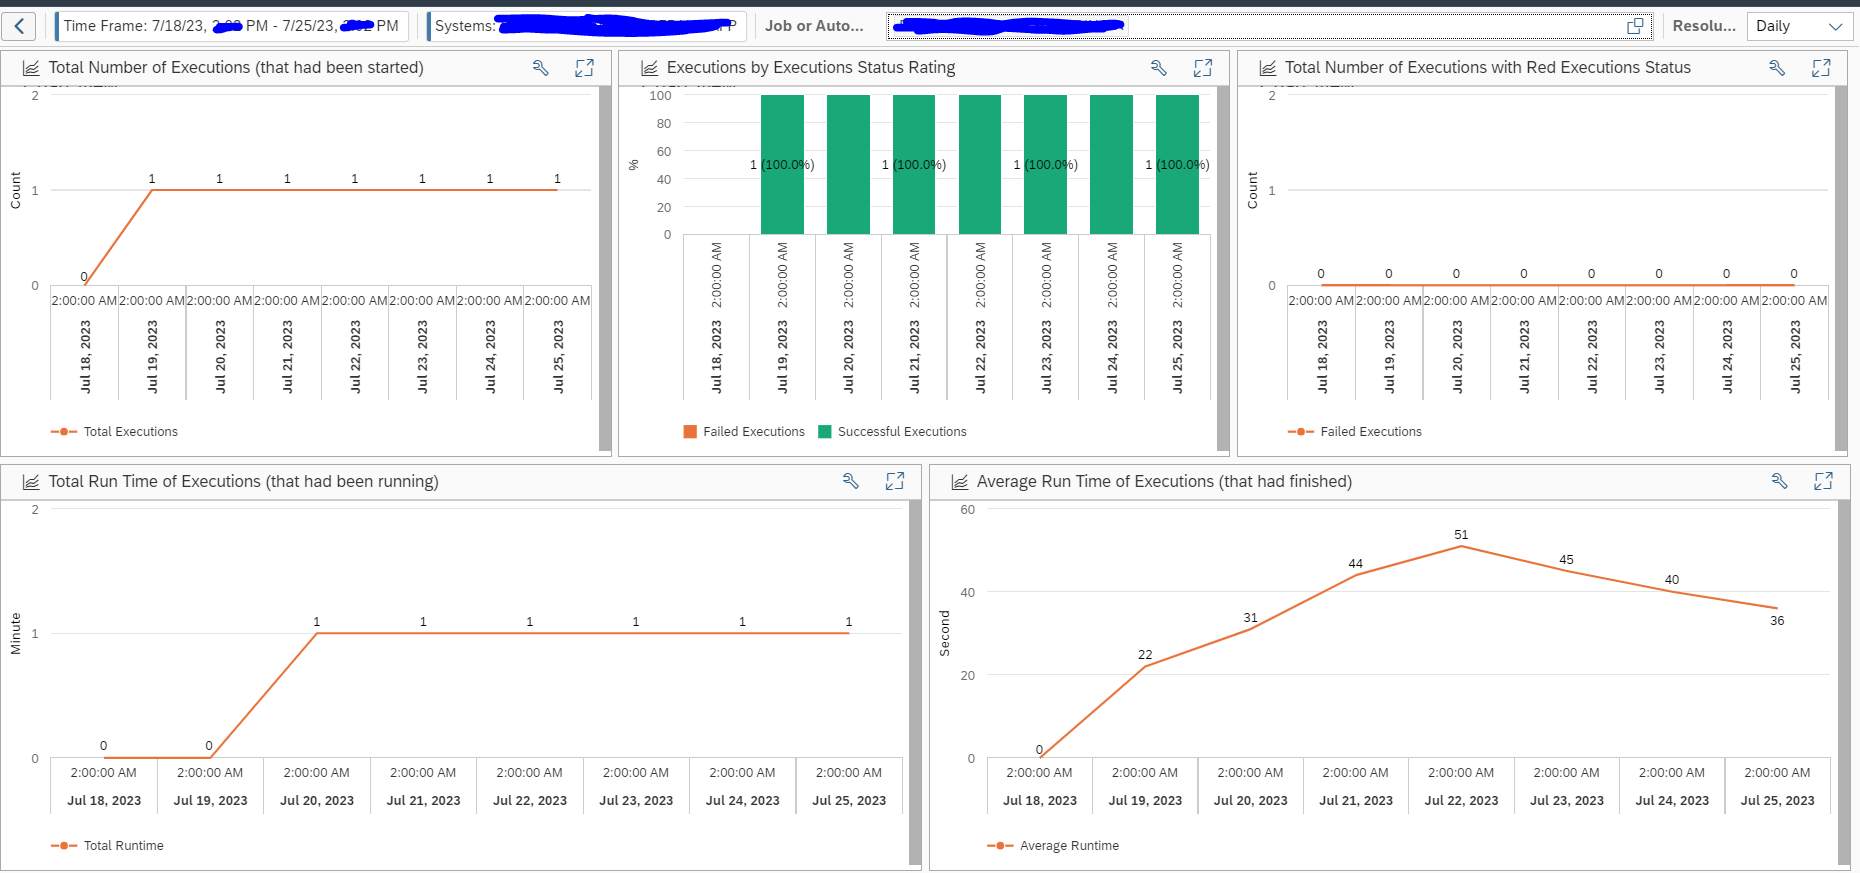
You can click on the blue numbers to dive into the details. Or you can click the Dashboards icon top right of the card to go into the dashboard mode:
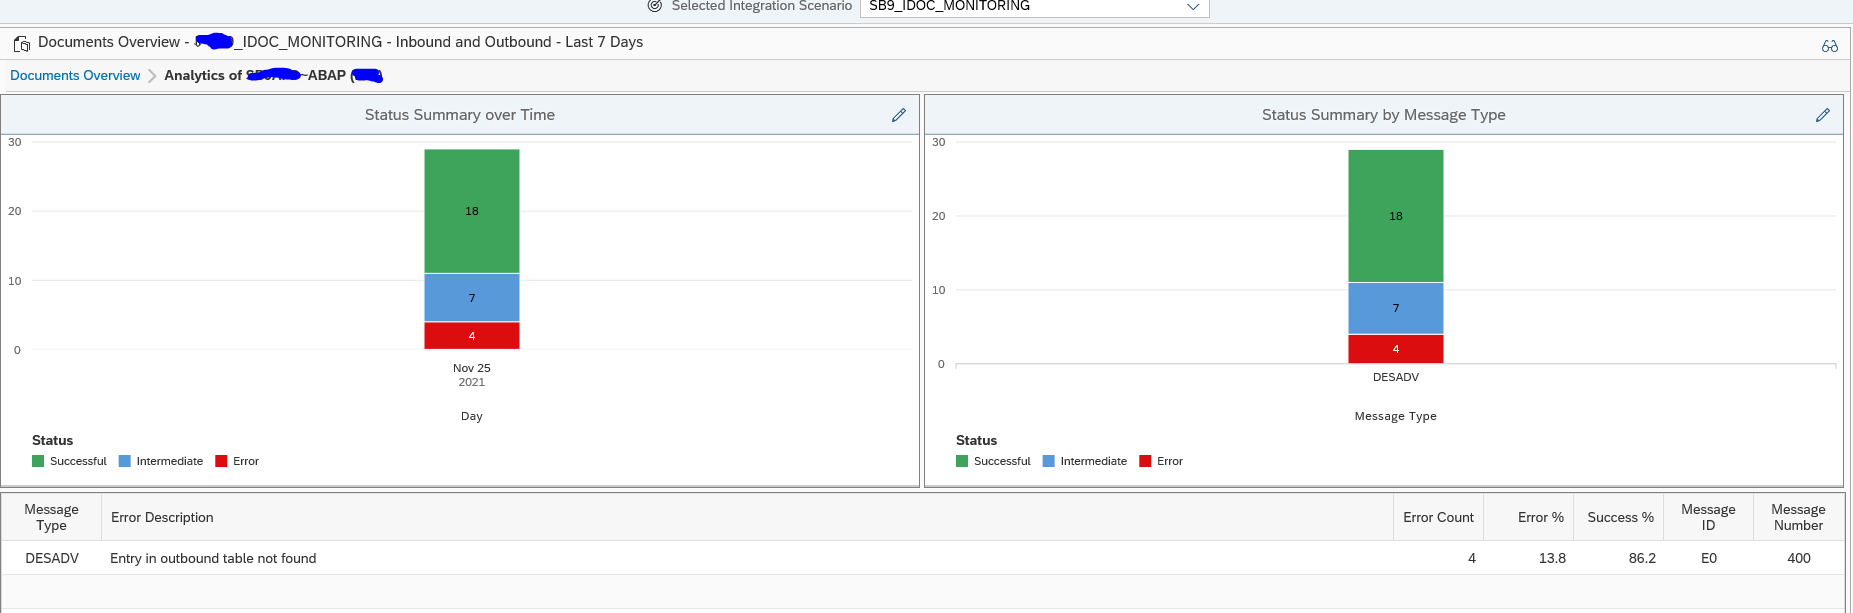
This will show you the summary over time and per message type. Clicking on the bars will again bring you to the details.
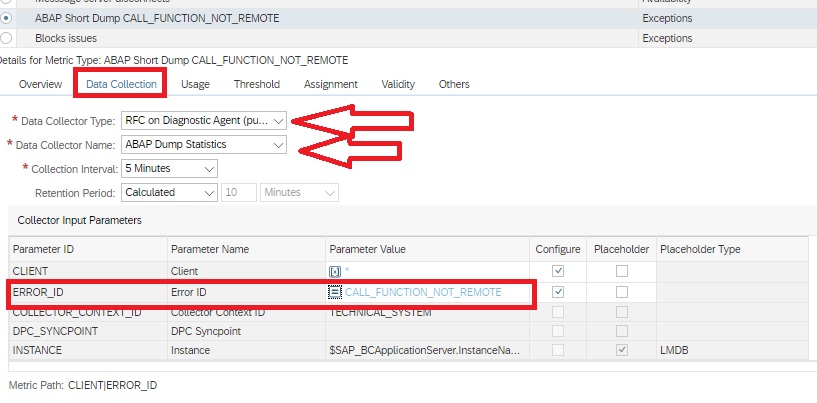
Data collection and alerting setup for idoc monitoring
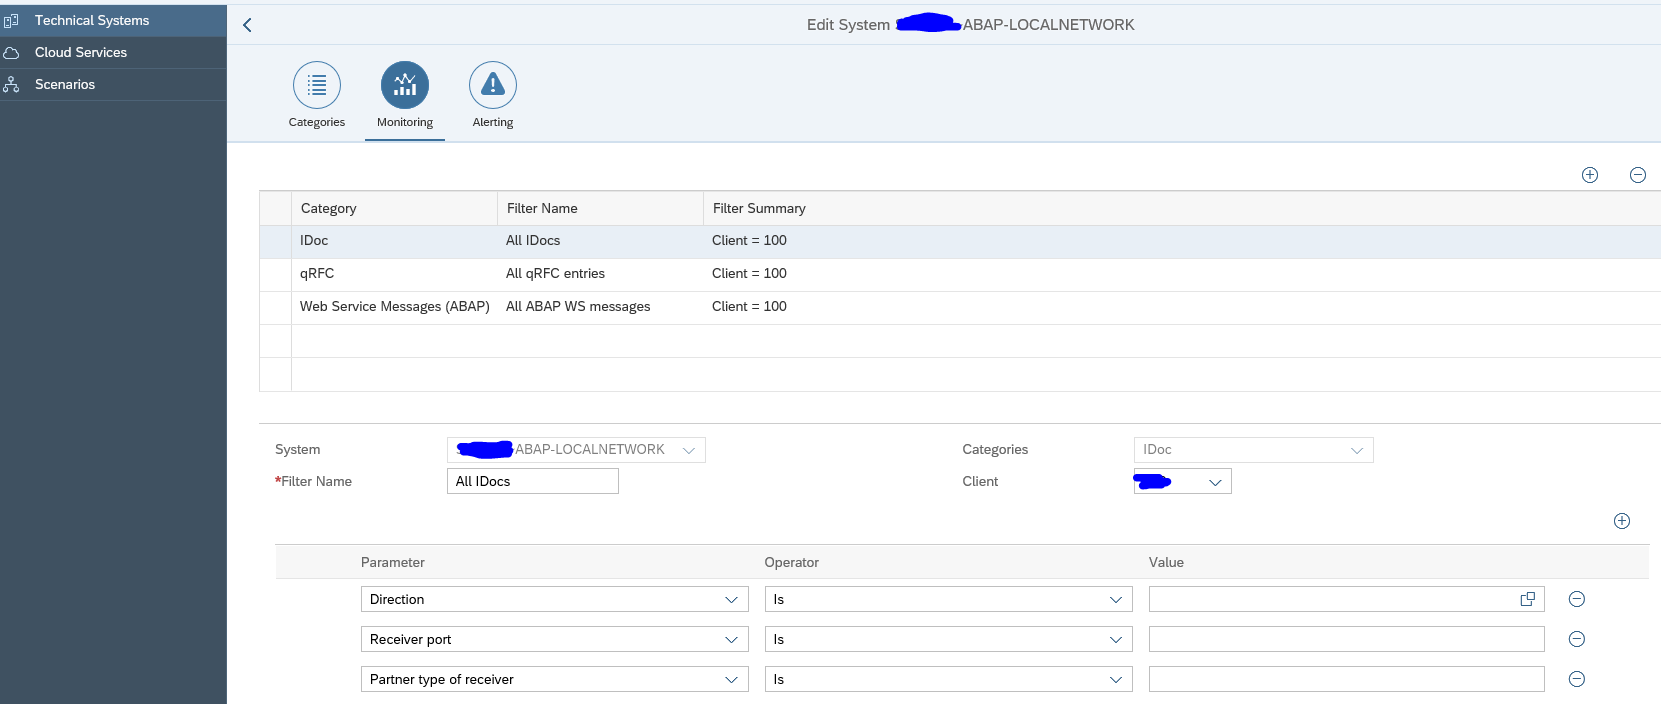
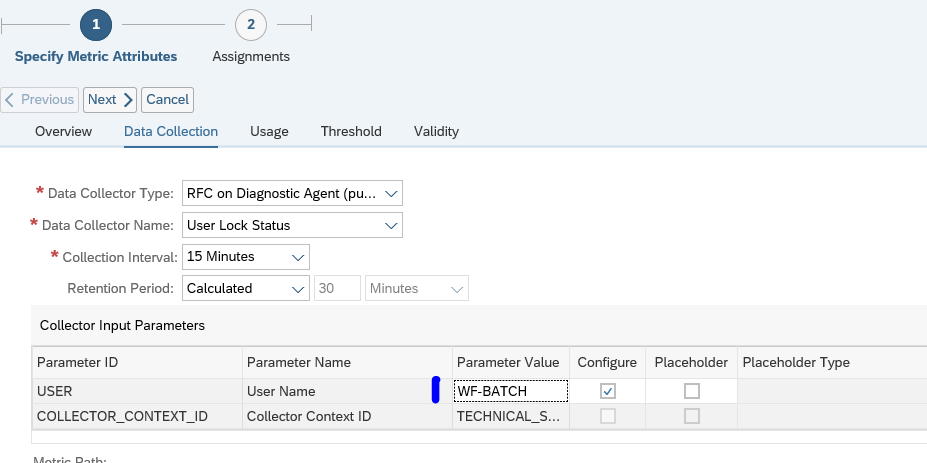
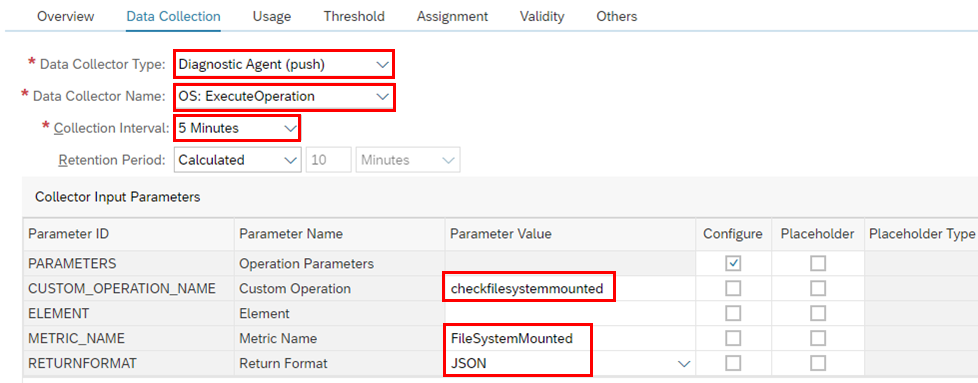
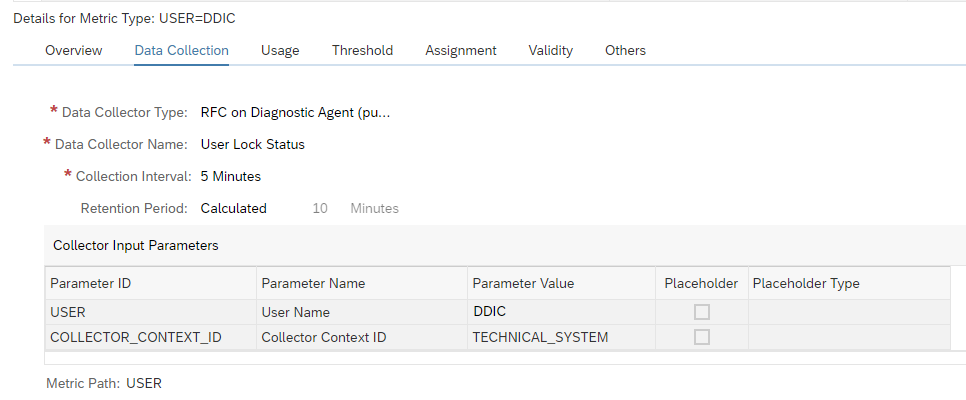
In the configuration for interface monitoring in the Technical System settings, goto the monitoring part and activate the data collection for Idoc monitoring:
In the monitoring filter, you can restrict the data collection to certain idoc types, receivers, senders, etc. Or leave all entries blank to check every idoc:
The graphical modelling for idocs is similar to the explanation of the example above.
Alerting for idoc errors
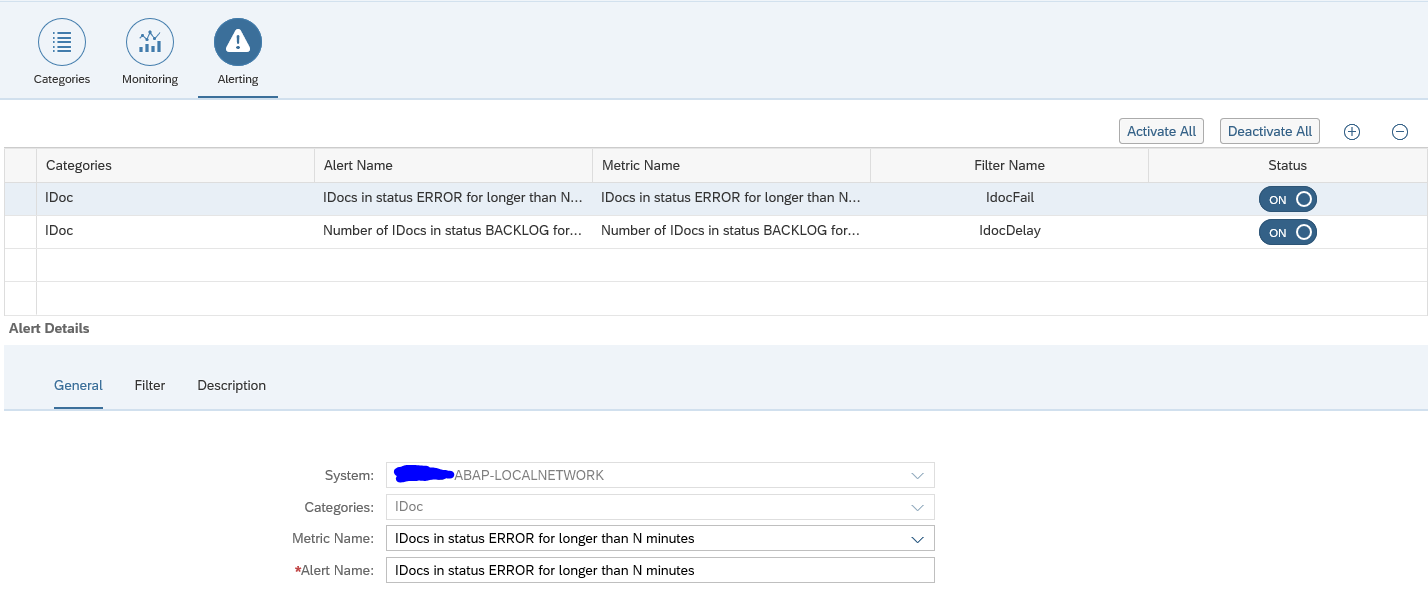
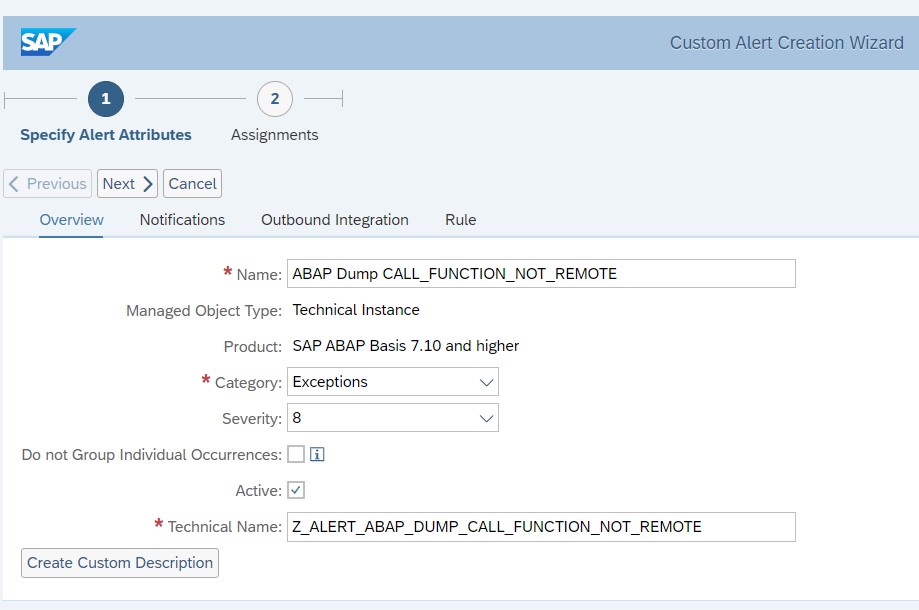
First alert we set up is the alert for errors.
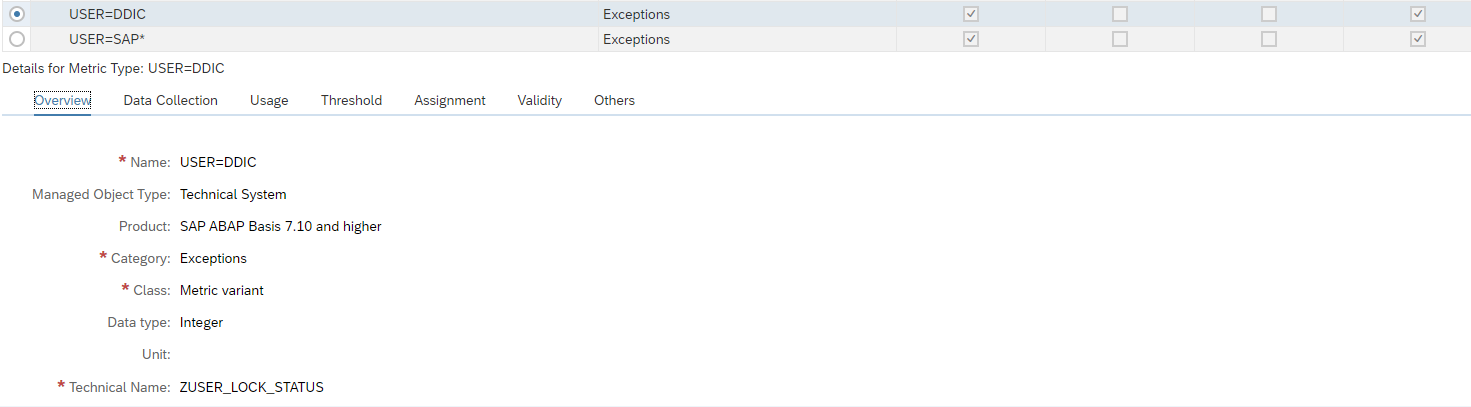
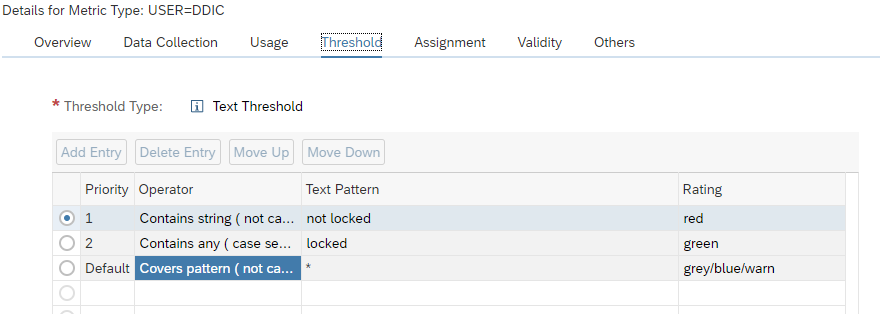
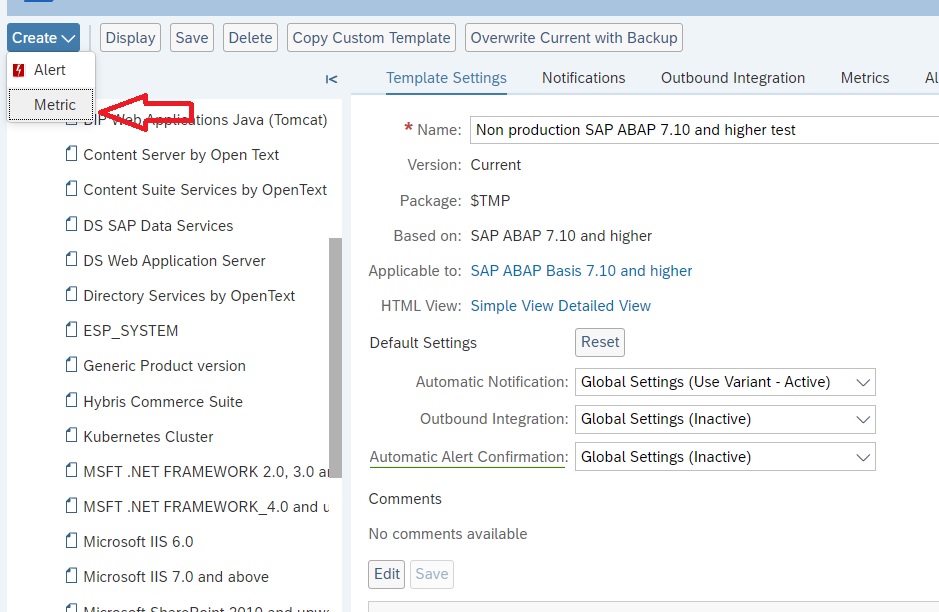
Create a new alert and select the alert for idocs in status ERROR for longer than N minutes:
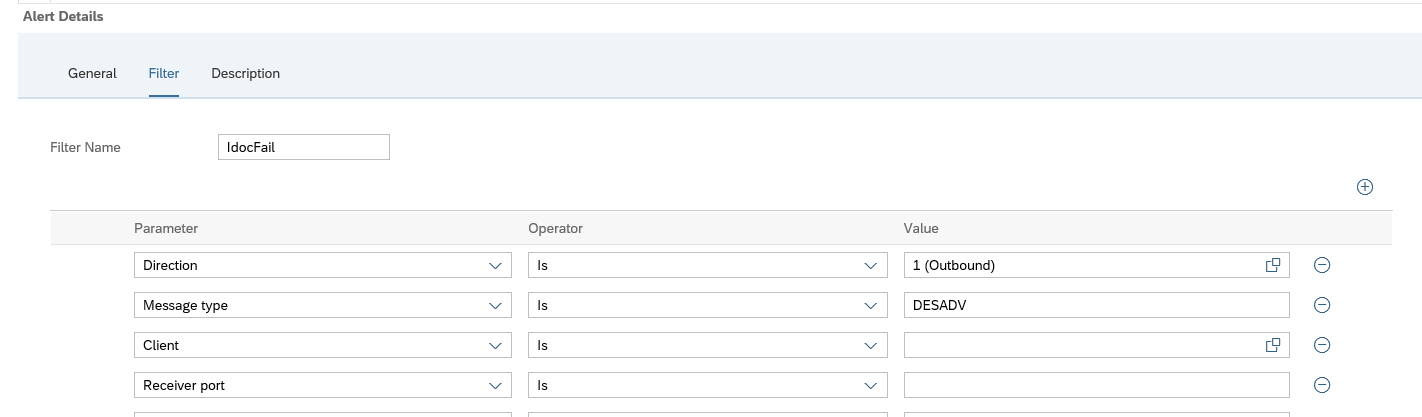
Now we add the filter. In our case we filter on outbound idocs of type DESADV:
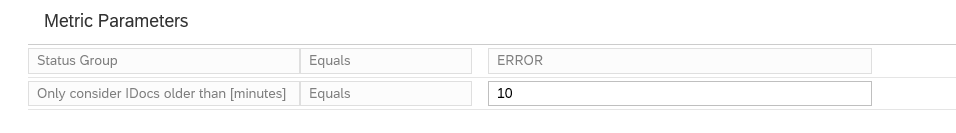
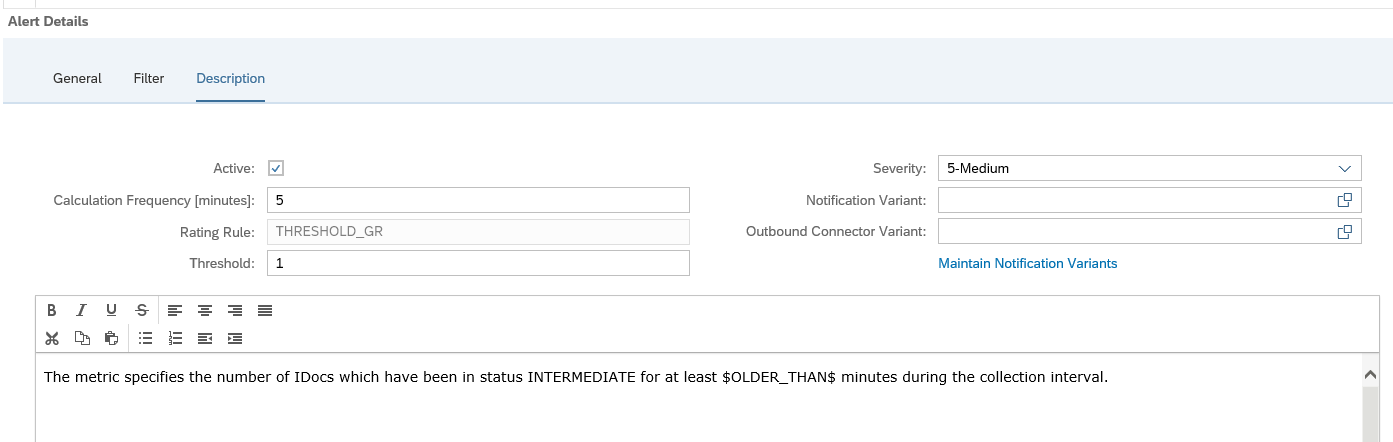
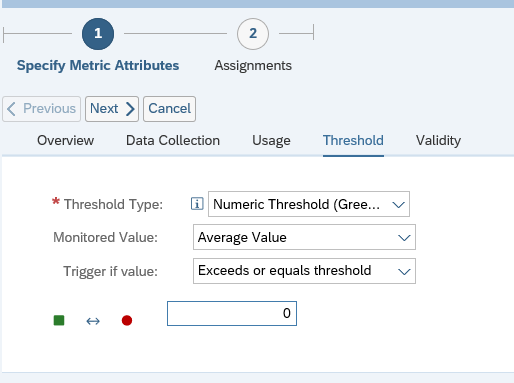
A bit hidden at the bottom of this screen is the setting for the N for the minutes:
The time setting is depending on your technical setup of idoc reprocessing jobs (see for example this blog), and the urgency of the idocs for your business.
In the description tab add the notification variant in case you want next to the FRUN alert also mail to be sent (setup is explained in this blog).
You can set up multiple alerts. This means you can have different notification groups for different message types, different directions, different receiving parties.
Save the filter and make sure it is activated.
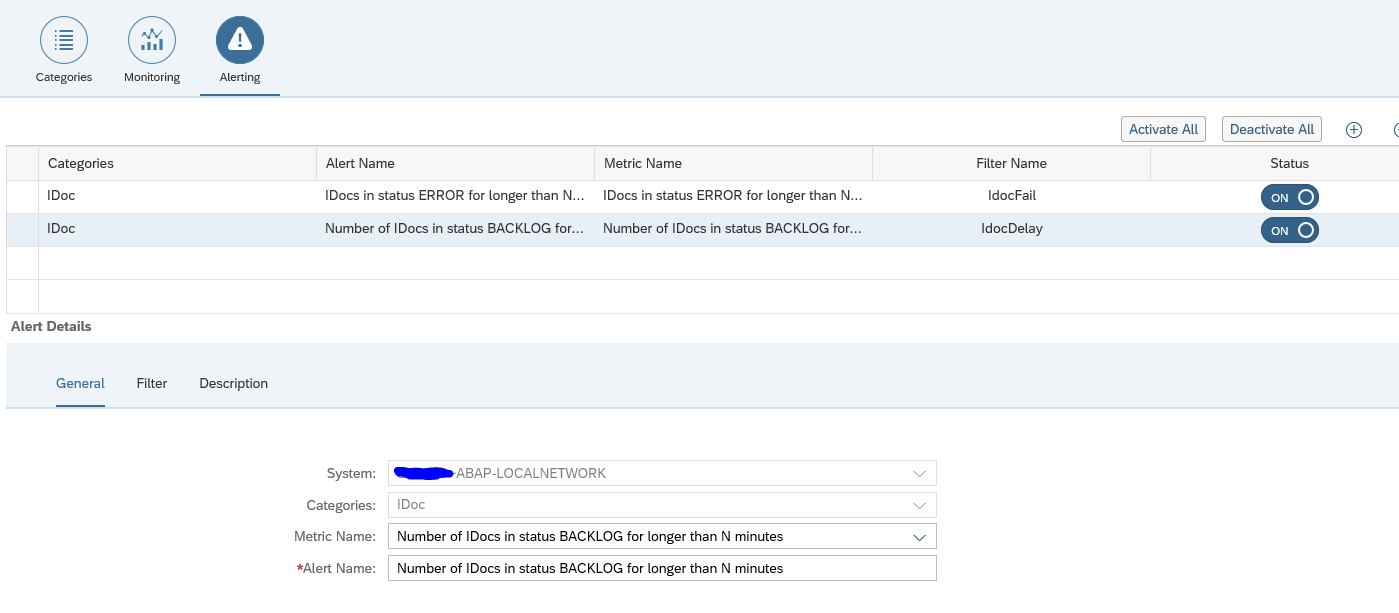
Idoc alert for backlog
Next to alerting on errors, Focused Run can also alert on delay of idocs. This can be done for both inbound and outbound idocs.
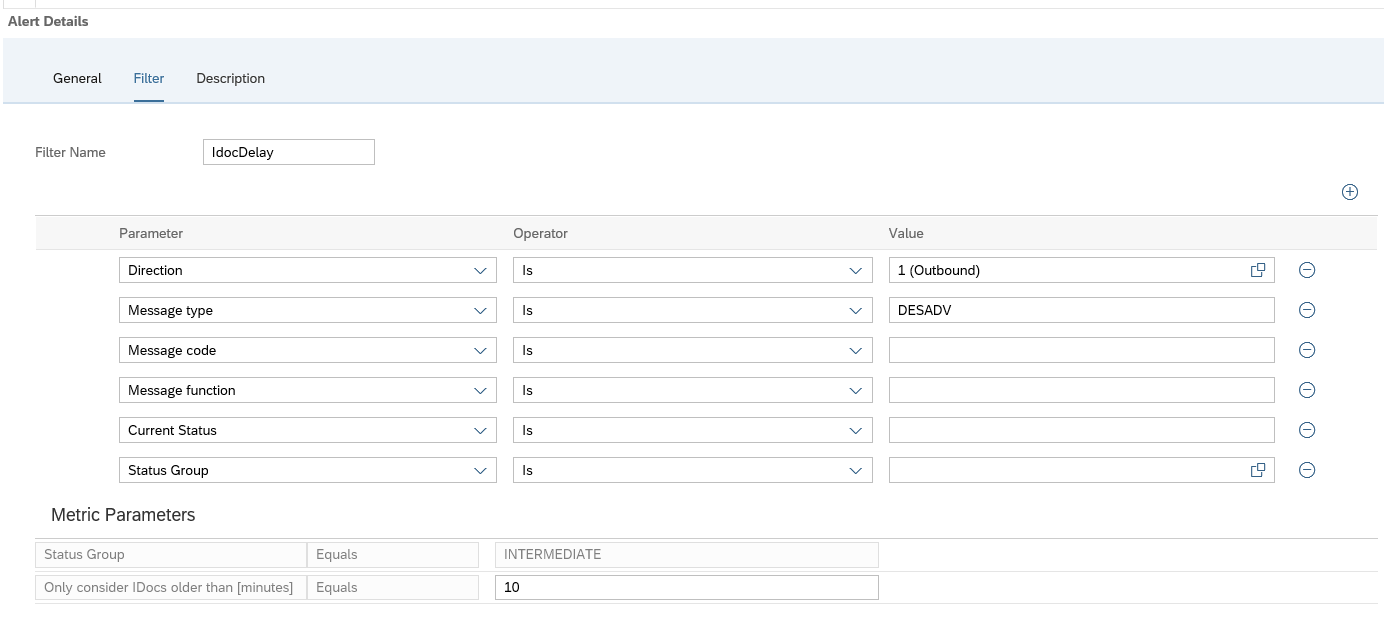
To set up an alert for backlog choose the option idocs in status BACKLOG for longer than N minutes:
In the filter tab set the idoc filter and at the bottom fill out the value for N minutes of backlog that should be alerted:
And in the final tab set the notification variant if wanted:
Save the filter and make sure it is activated.
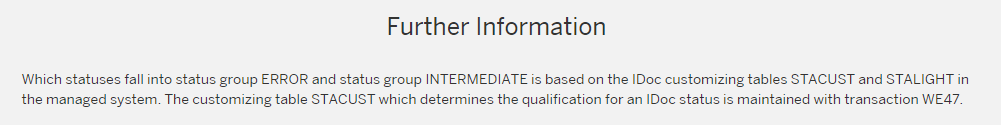
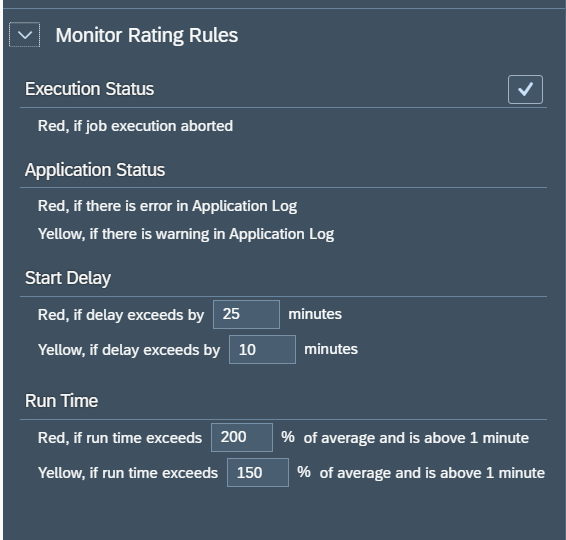
Definition of delayed and error idocs
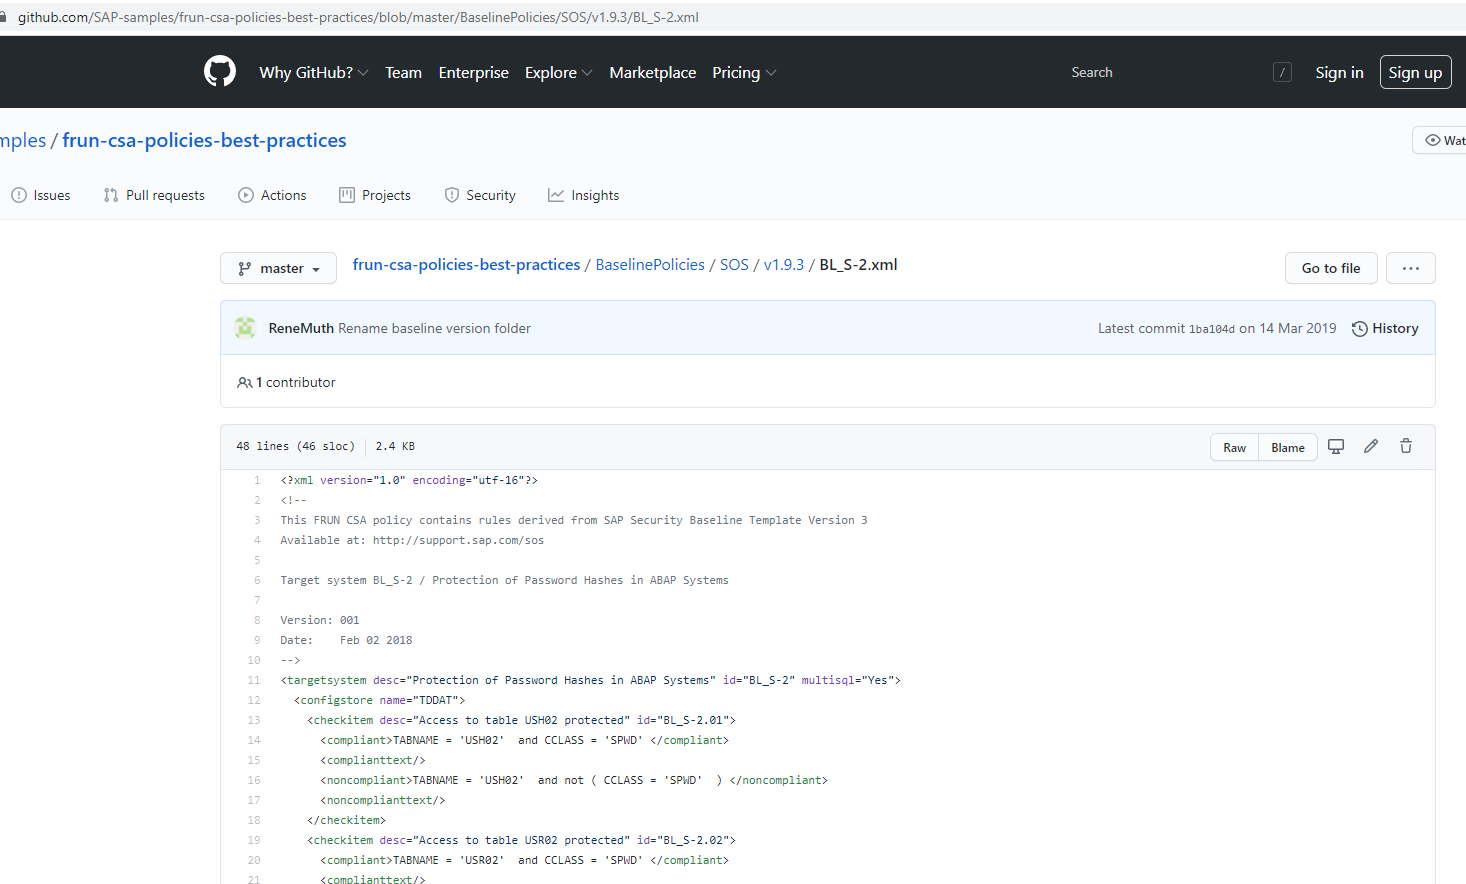
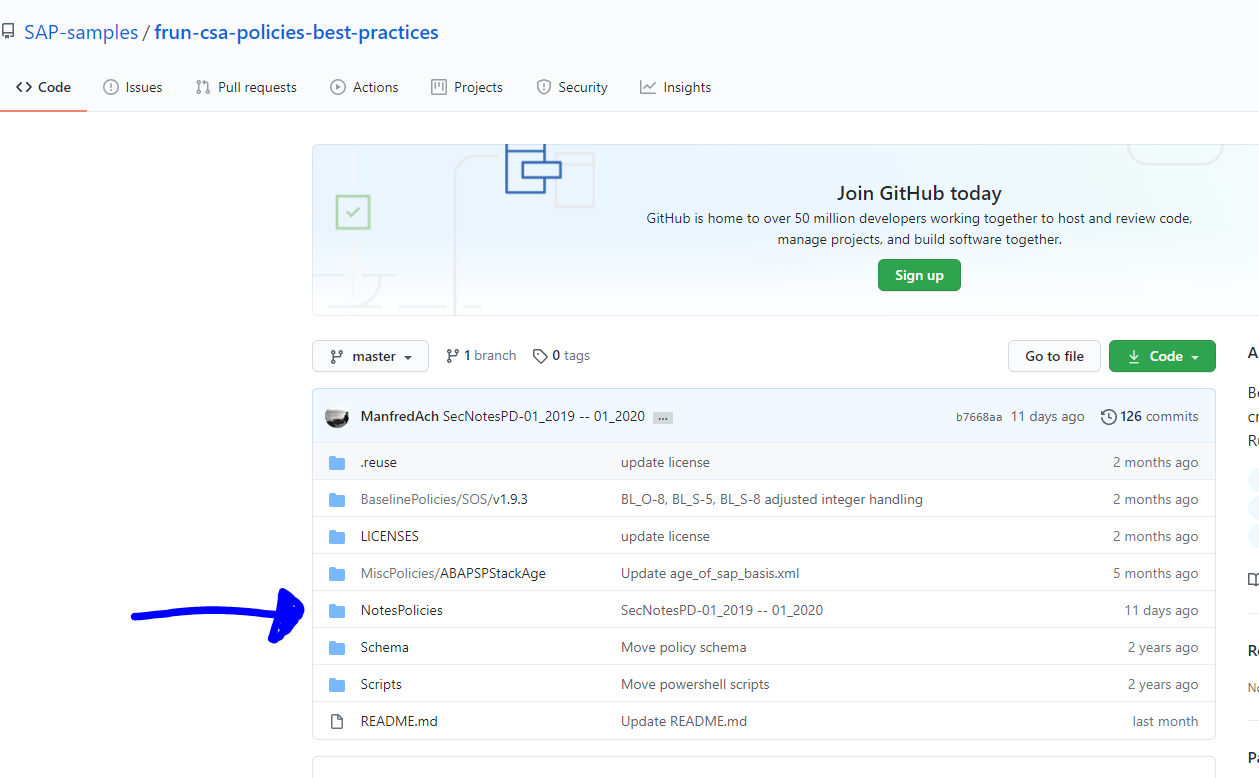
On the SAP Focused Run expert portal on idocs, there is this definition of the determination of idocs in delay and error:
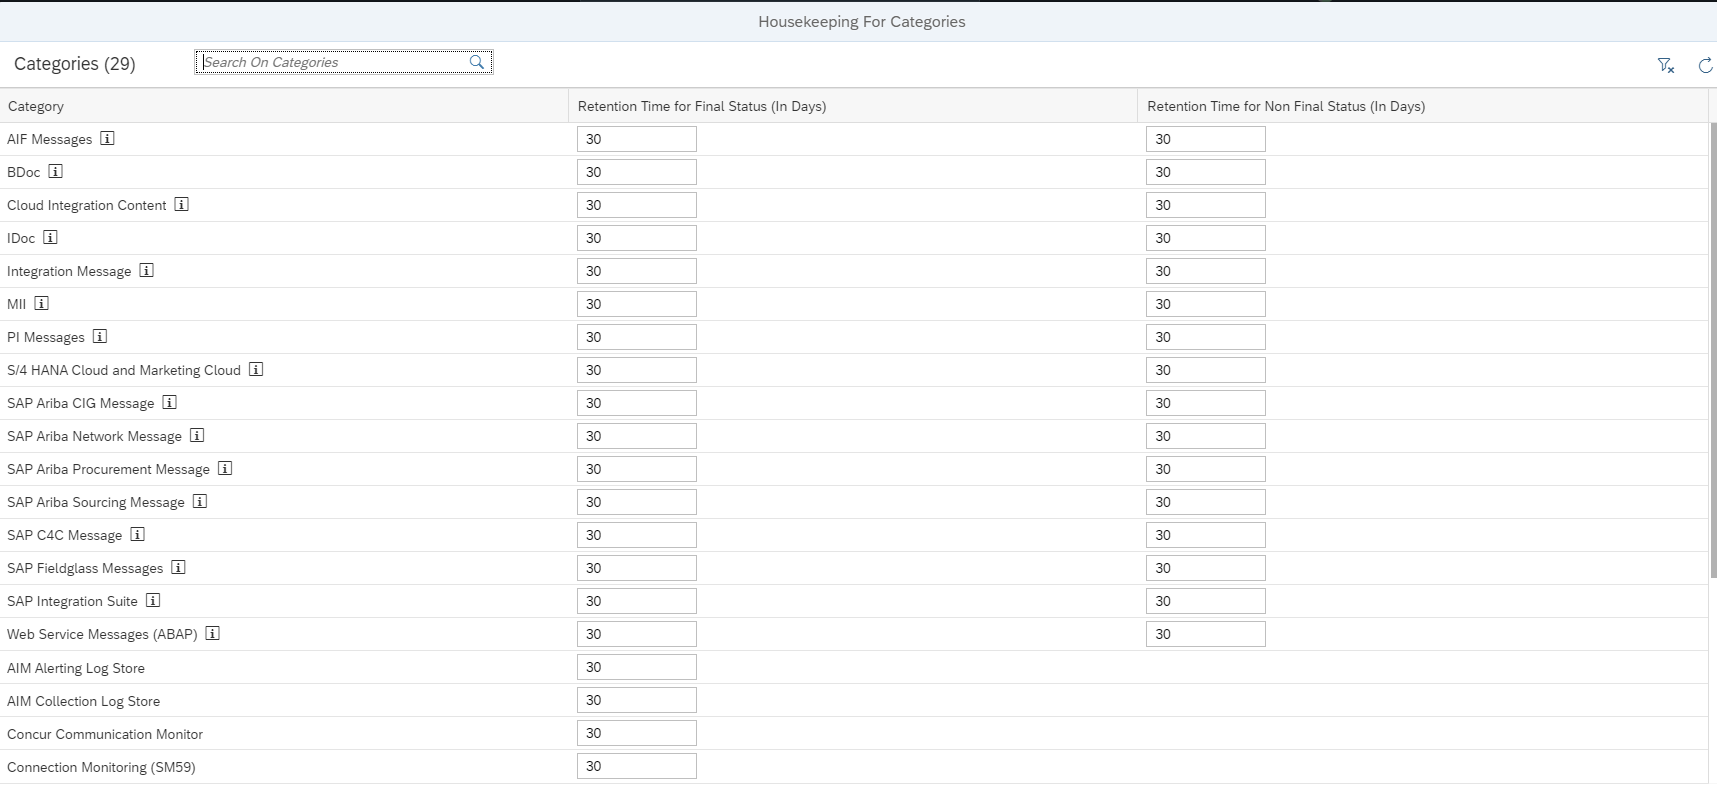
Data clean up idoc monitoring
If you get too much data for idoc monitoring, apply OSS note 3241688 – Category wise table cleanup report (IDOC, PI). This note delivers program /IMA/TABLE_CLEANUP_REPORT for clean up.
ODATA gateway monitoring
We assume in this use case that end users are using the ODATA in FIORI apps. In case ODATA is consumed by external applications like Tibco, Mulesoft, Mendix, etc., you have to replace USER with the corresponding application.
Model end users in LMDB
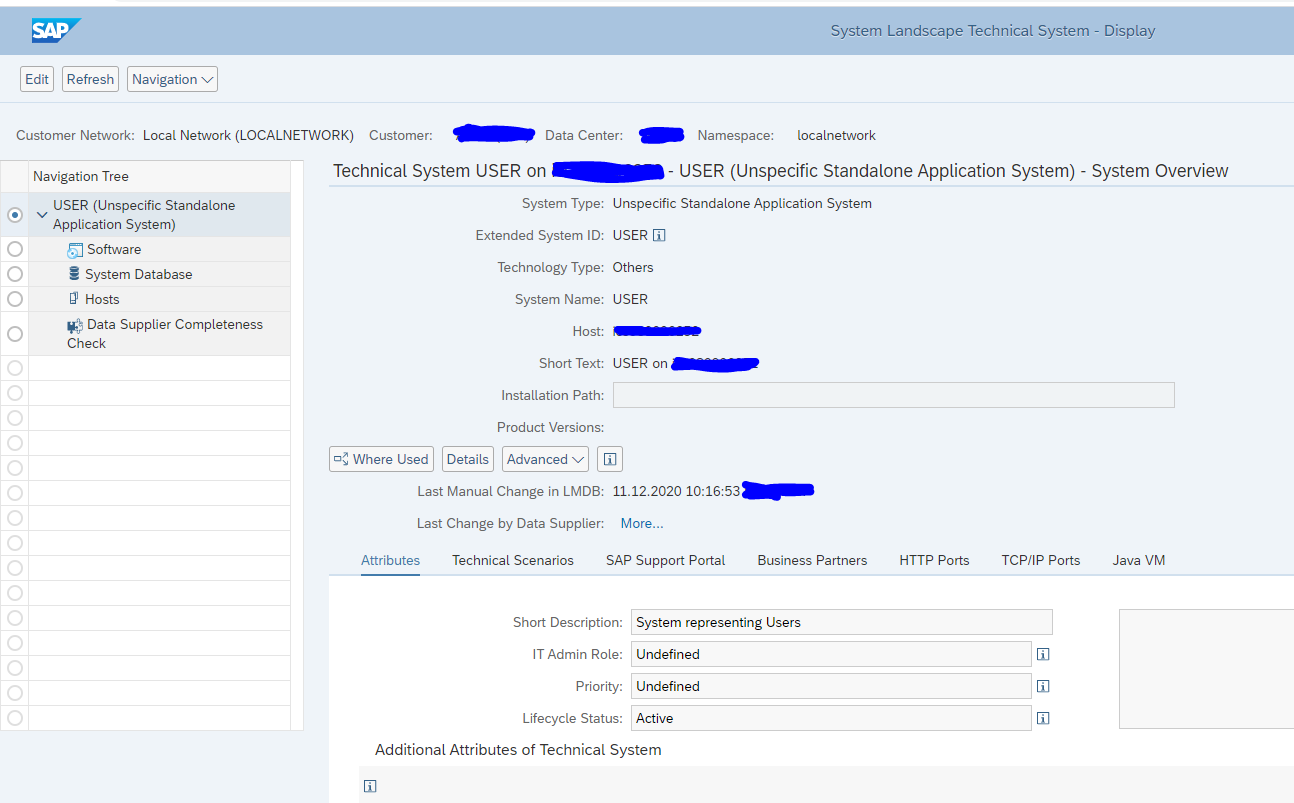
Before we can start the scenario modelling, we first need to model the end users in LMDB as a Unspecific Standalone Application System), just like we did for TIBCO in this blog.
Name the ‘system’ USER:
Make sure the status is Active.
Add this new system USER to the Technical System list in the Integration Monitoring setup.
The system will be display only.
Data collection and alerting setup for ODATA interfaces
In the configuration for interface monitoring in the Technical System settings, goto the monitoring part and activate the data collection for Gateway Errors:
In the monitoring settings, you can filter on specific items if wanted, or leave everything blank to report on any error:
In the tab alerting setup the alerting:
The filter for monitoring and alerting can be different. It cloud be you want to monitor all errors, but only activate specific important ones.
Save your monitoring data collection and alerting settings.
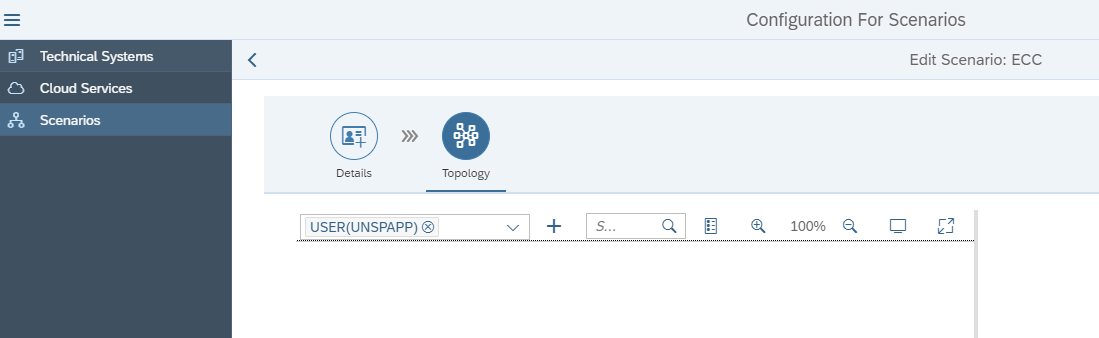
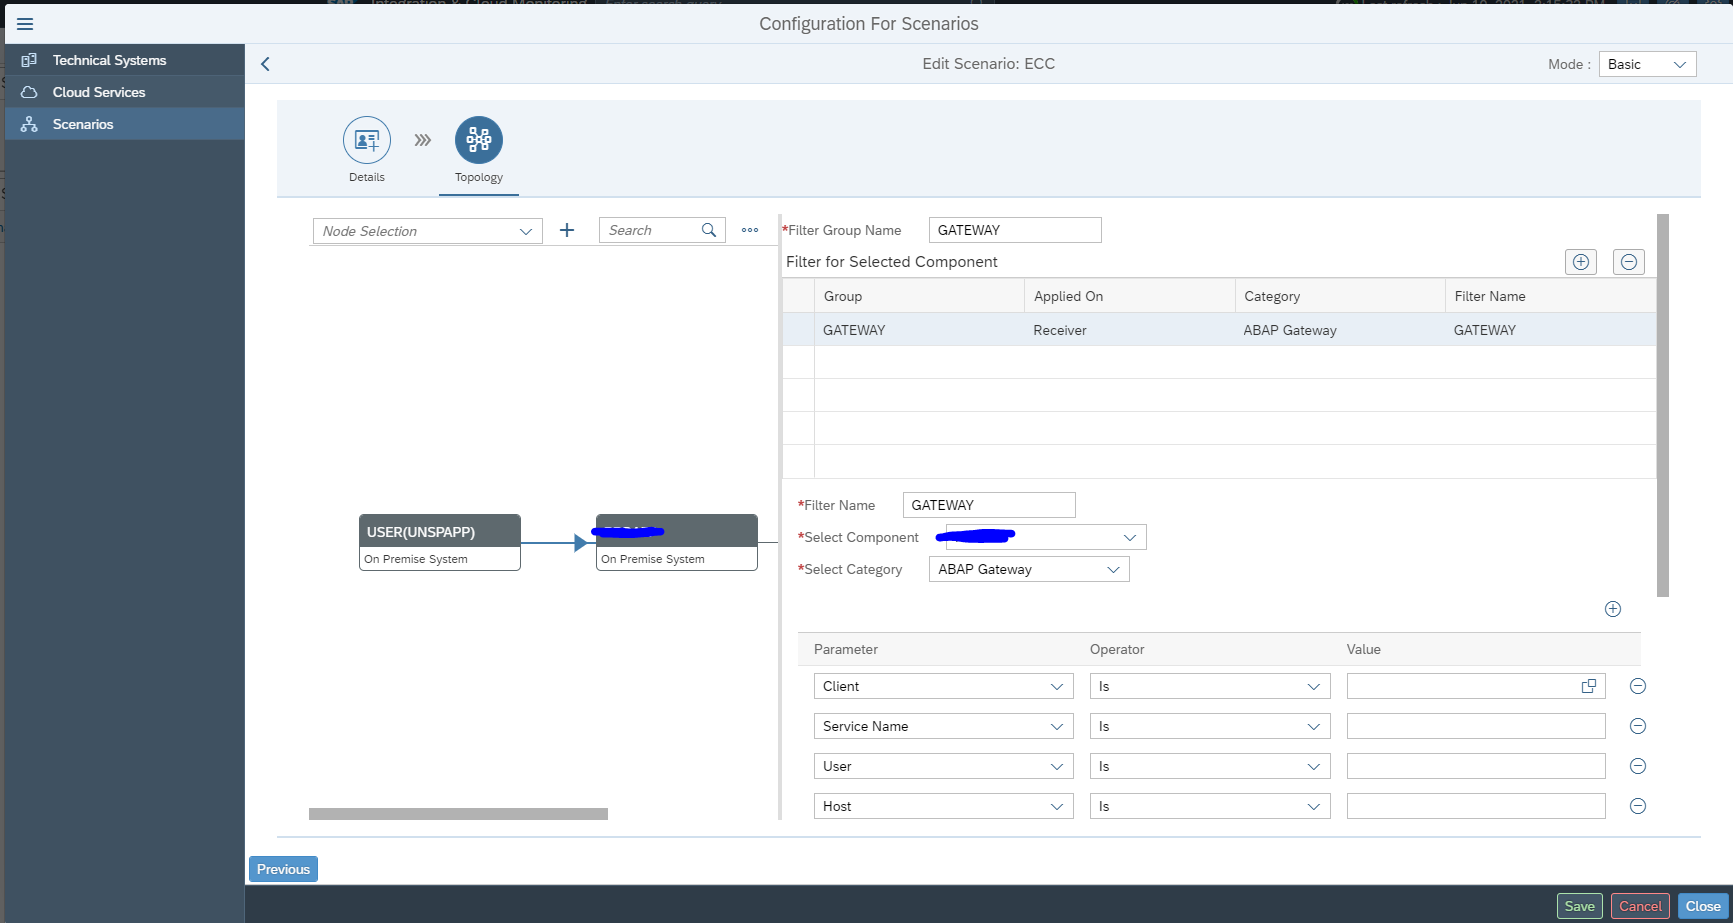
Graphical modelling of ODATA interfaces
In the graphical modelling add the backend system and the system created for USER:
Now add the link starting with USER towards the backend system:
Save your changes.
Also here: first scroll down to see the OK button. Press first OK before pressing Save, or you might loose the data and have to re-enter it. This it bit annoying in the UI.
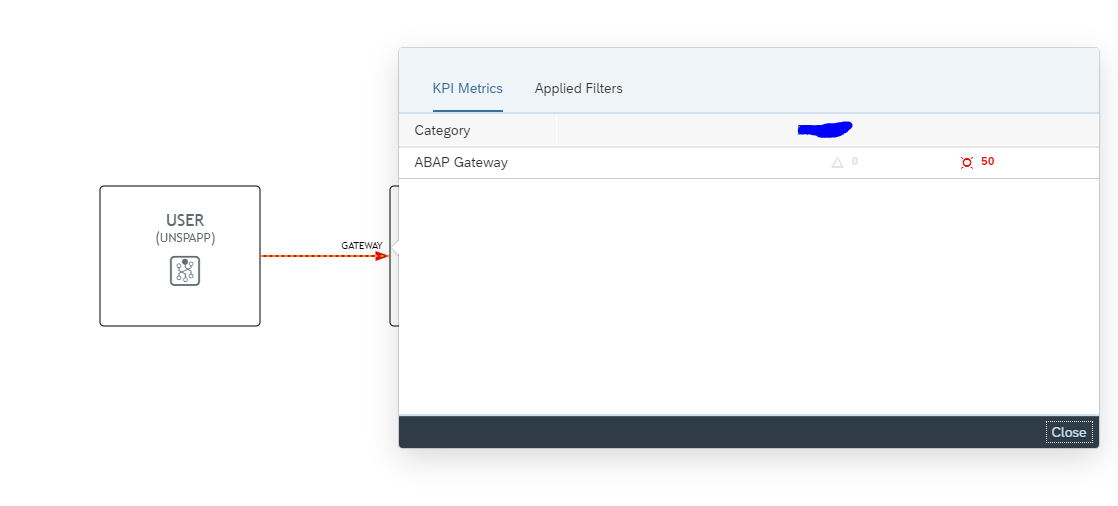
Monitoring usage of ODATA interfacing
The end result in operations looks as follows:
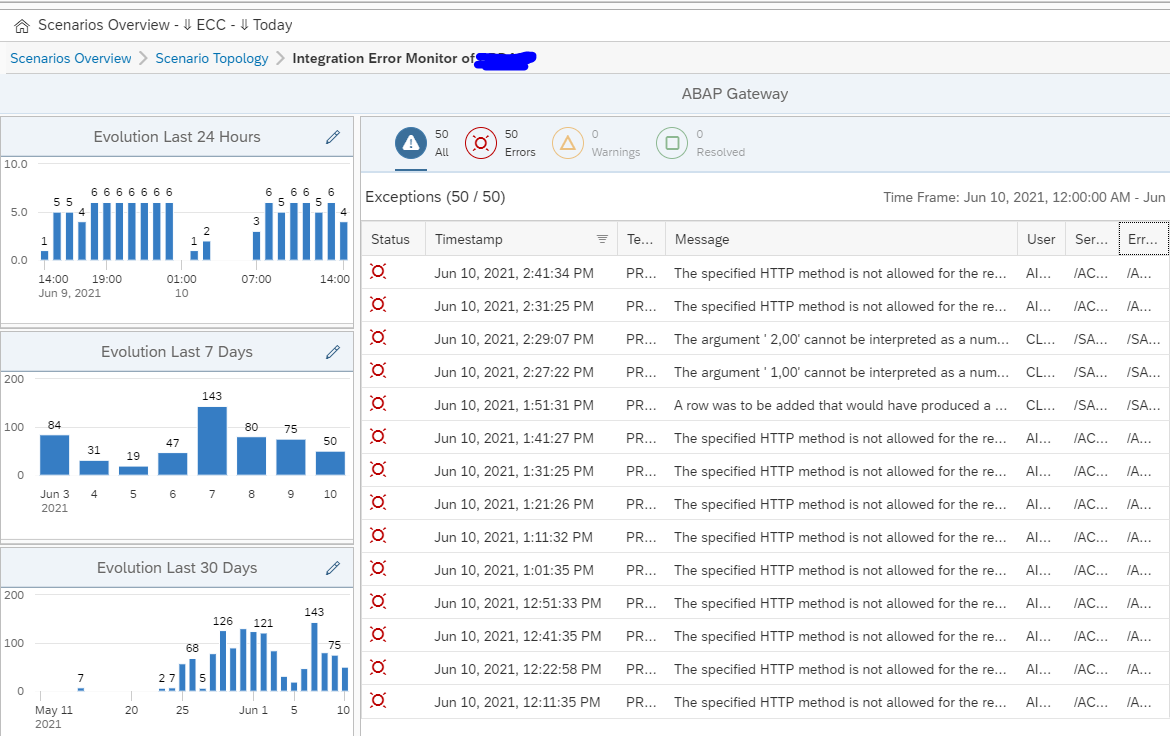
In the graphical overview click on the red line. The screen with the exceptions opens. Click on the red number to see the overview:
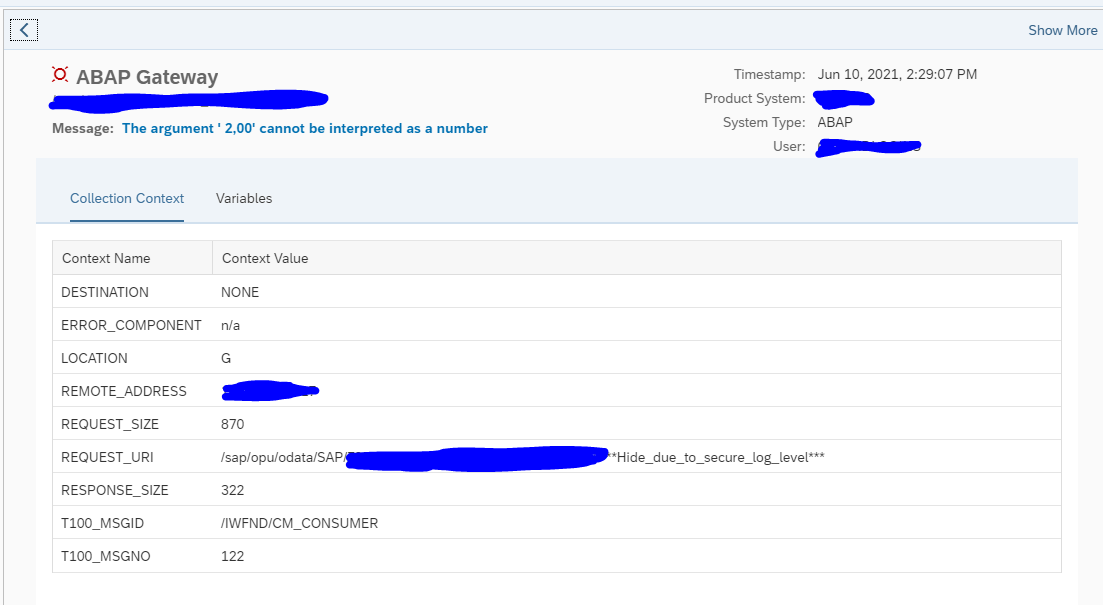
Here you can see the trends and zoom into the specific errors:
qRFC monitoring
qRFC connections are frequently used in communication from ECC to EWM and SCM systems. For generic tips and tricks for qRFC handling, read this blog.
OSS notes for bug fixing qRFC monitoring
Please make sure bug fix OSS note 3014667 – Wrong parameter for QRFC alerts is applied before starting with qRFC monitoring.
Other OSS notes:
Data collection and alerting setup for qRFC monitoring
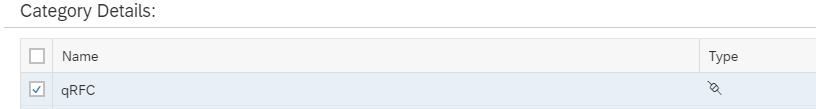
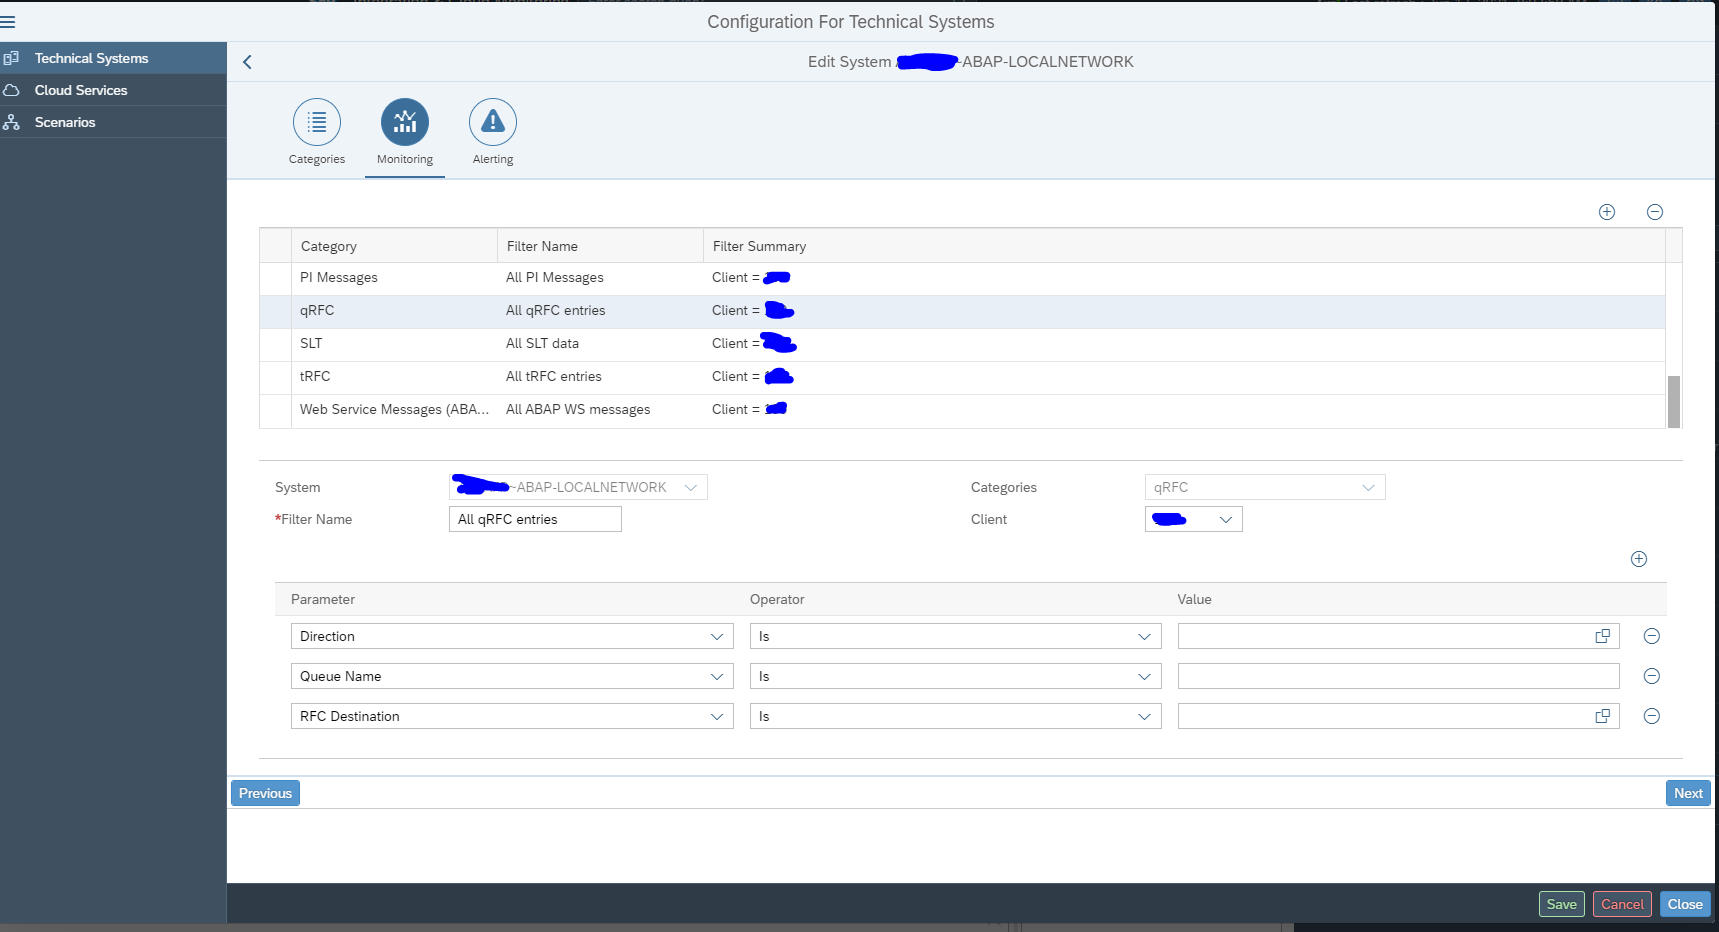
In the configuration for interface monitoring in the Technical System settings, goto the monitoring part and activate the data collection for qRFC Errors:
In the monitoring settings, you can filter on specific queues, direction and RFC name, or leave everything blank to report on everything:
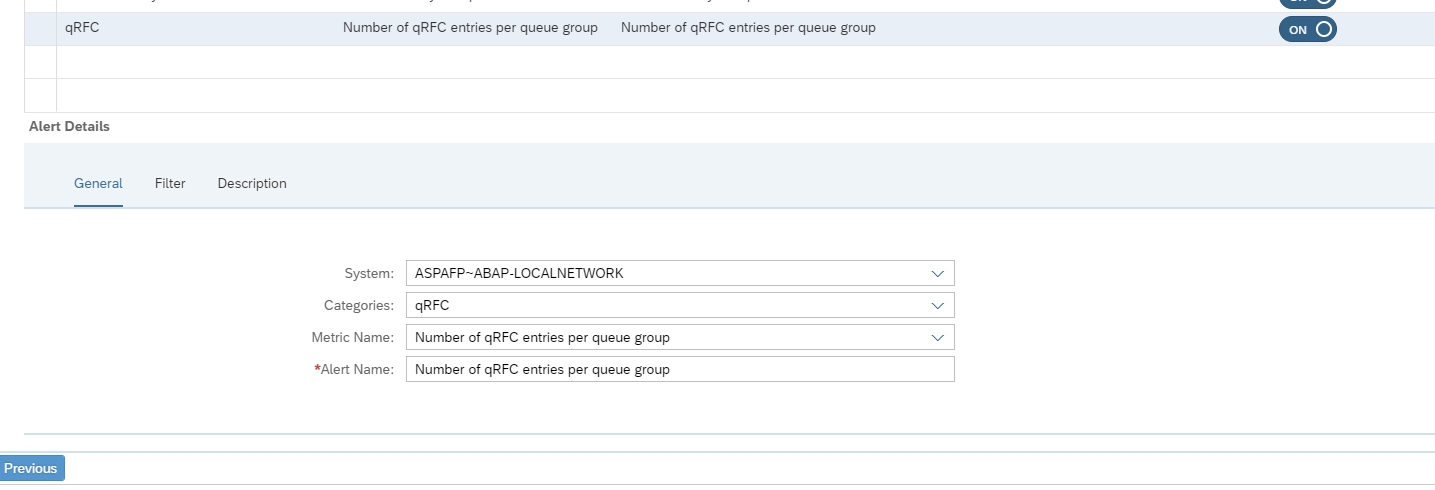
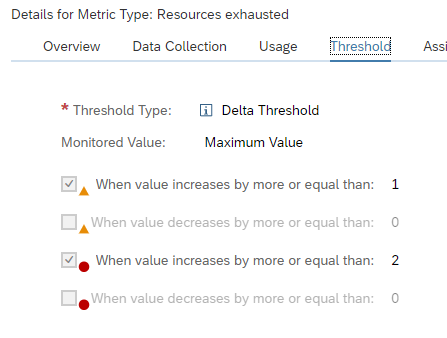
In the alerting part check you can choose between age of qRFC entries and number of entries:
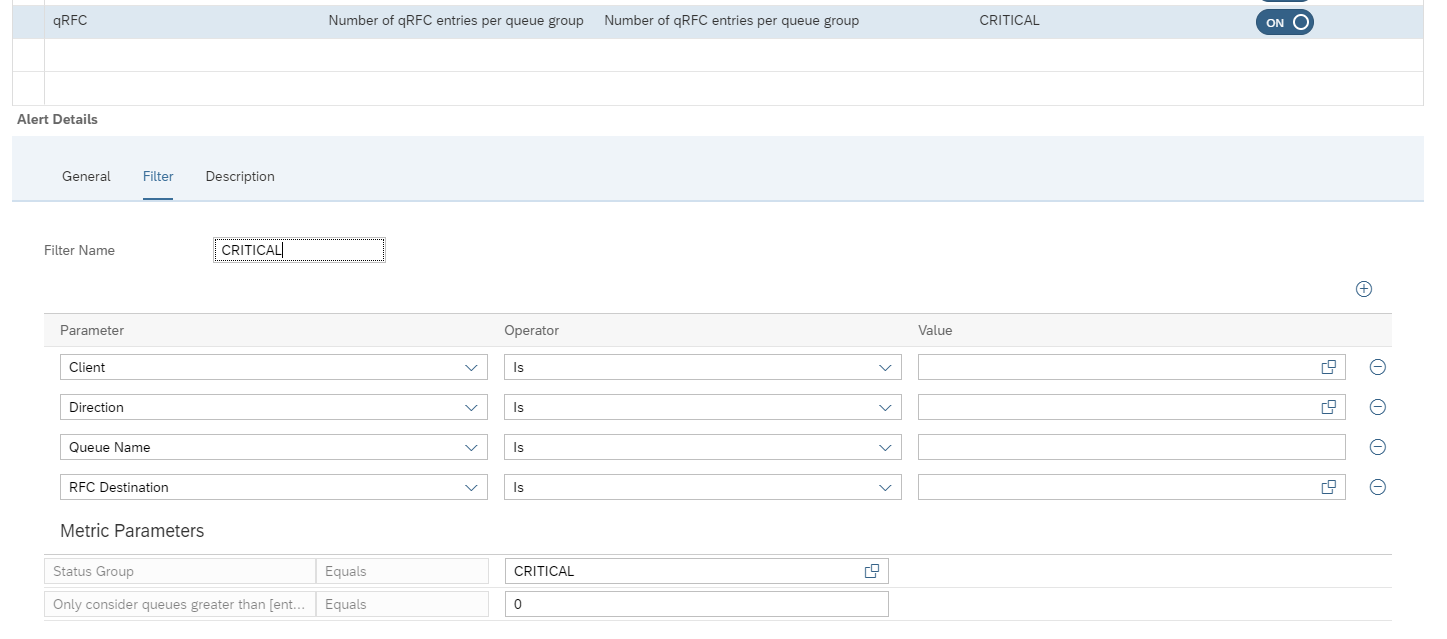
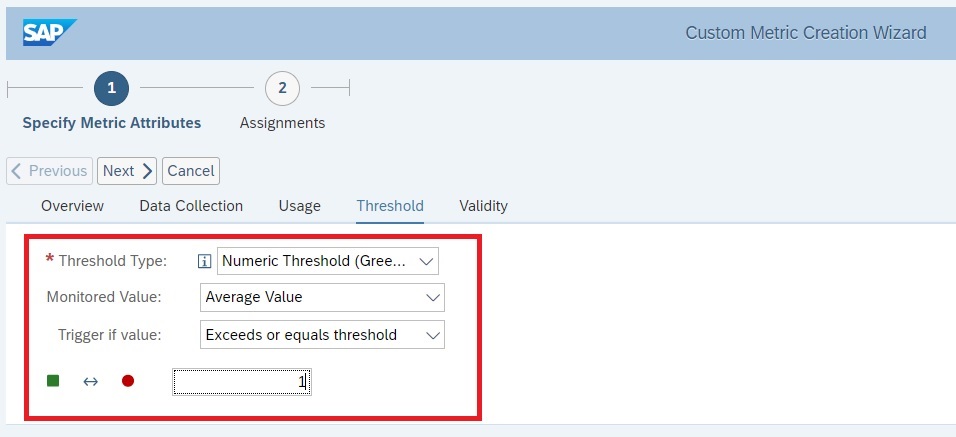
And set the filters for which ones, and the metric threshold for CRITICAL errors:
The filter for monitoring and alerting can be different. It could be you want to monitor all errors, but only activate specific important ones.
Save your monitoring data collection and alerting settings.
Queued RFC’s are normally back and forth between 2 systems. If this is the case you have to make the settings for both systems.
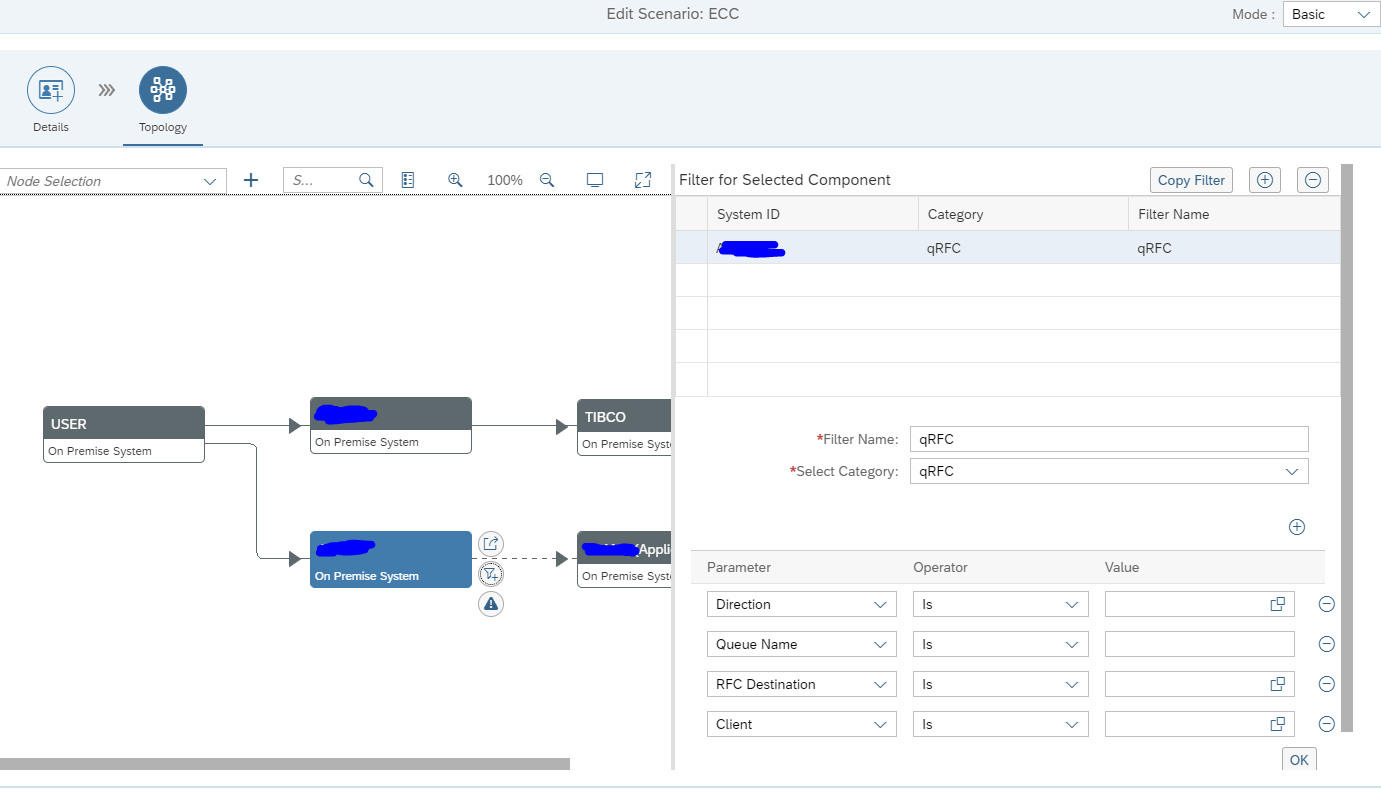
Graphical modelling of qRFC interfaces
In the graphical modelling add the filter between two systems for the qRFC monitoring:
Also here: first scroll down to see the OK button. Press first OK before pressing Save, or you might loose the data and have to re-enter it. This it bit annoying in the UI.
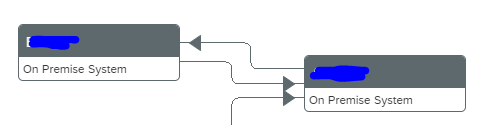
Queued RFC’s are normally back and forth between 2 systems. If this is the case you have to make the settings for both systems. You model first one direction and then model the direction back:
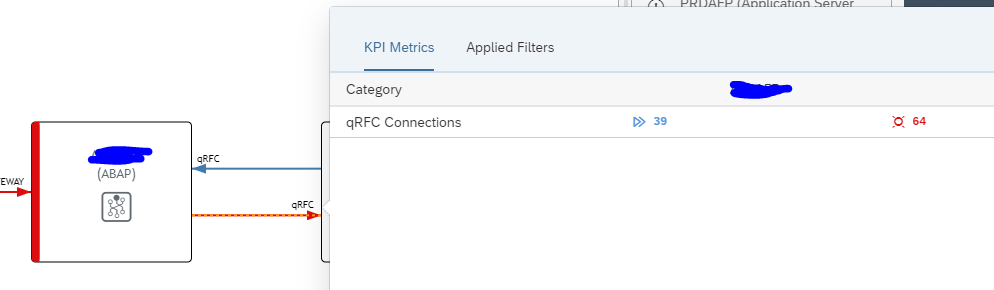
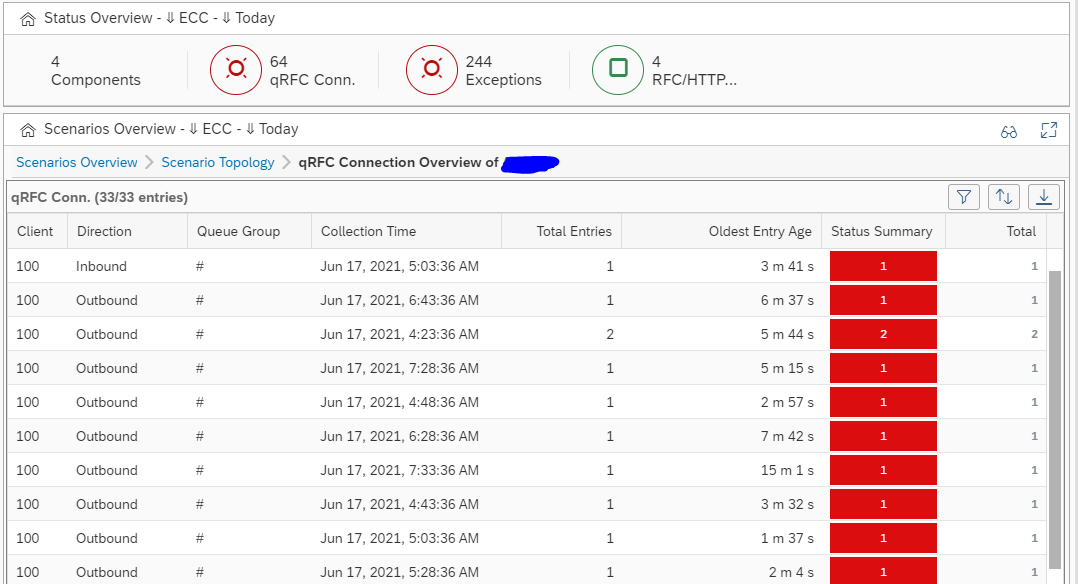
Monitoring qRFC usage
The end result in operations looks as follows:
You can see here qRFC is modelled back and forth between 2 systems. The blue line indicates messages in process. The red line is clicked on. Here you can see both messages in process and errors. Click on the red error number gives the details:
Monitoring RFC’s between SAP systems
RFC’s with fixed user ID
See the example above on CUA idoc monitoring.
Trusted RFC’s
If you have to setup an RFC monitoring for a trusted RFC (for example between Netweaver Gateway system and ECC system), then you have to take care of the user ID’s and rights. The system from which the SM59 test will run, will use that Focused Run user ID to log on to the other system. If your user ID’s are unique for each system you have to create the user ID in the other systems with the rights to be able to execute a ping and logon for the test.
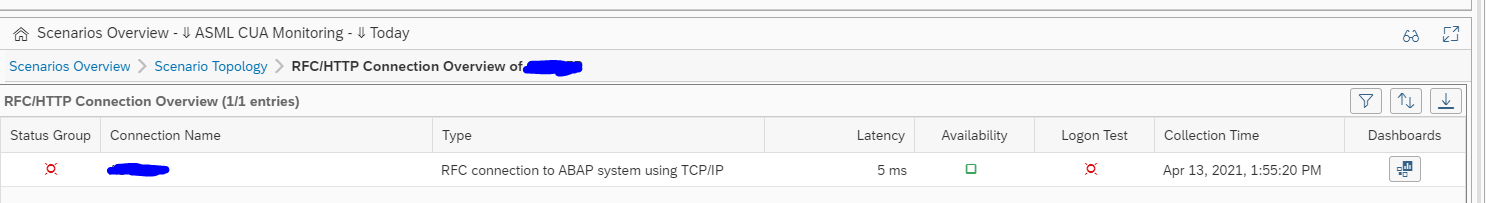
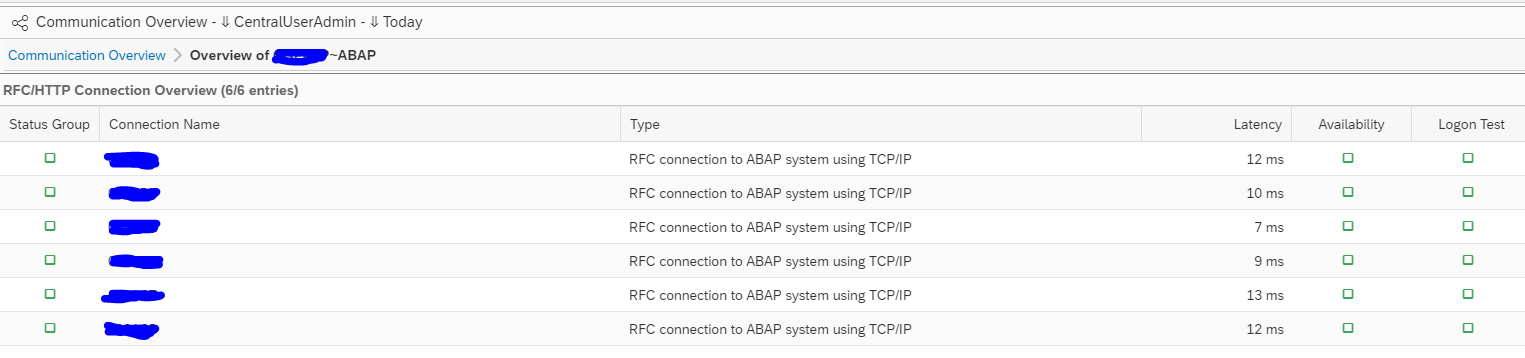
End result RFC checks
The end results of the RFC is list of RFC’s with the latency time, availability and logon test overview:
Transactional RFC towards external system
To monitor transactional RFC (type T) towards an external system like TIBCO, Mulesoft, etc, you first need to model the external system in the LMDB. To do this goto the LMDB maintenance Fiori app:
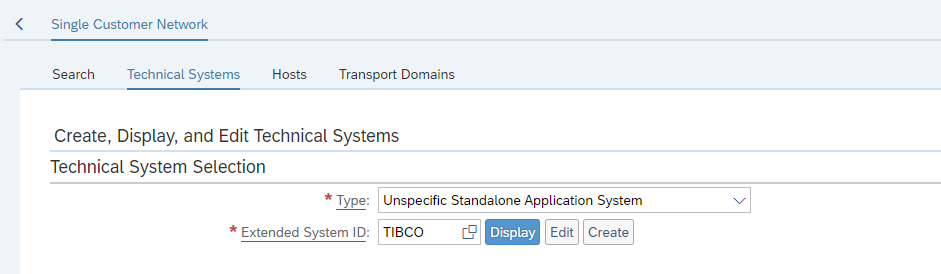
Then select Single Customer Network and select the option Technical Systems. In this section choose the Type Unspecific Standalone Application System:
And press Create:
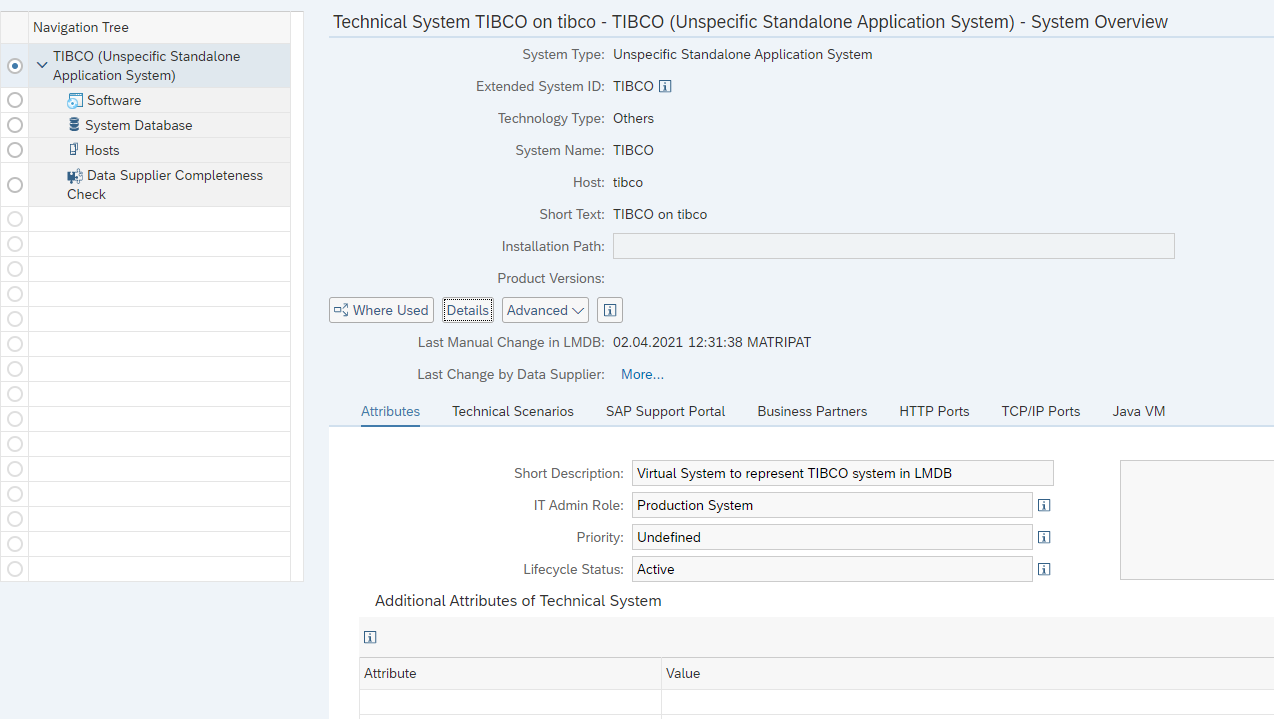
Fill out the details and Save. Make sure the status is Active.
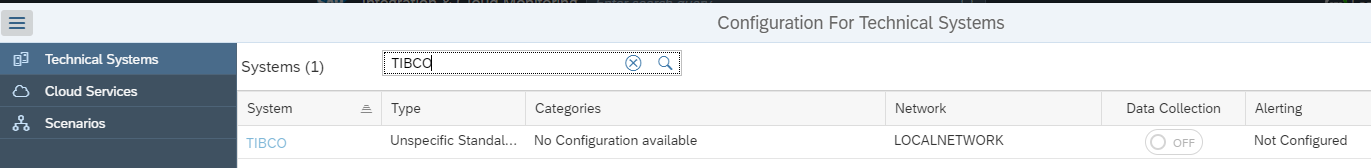
Now the system can be added in the configuration of technical systems in the Interface monitoring configuration:
Now you can model the tRFC interface connection monitoring:
OSS notes for RFC monitoring
Relevant OSS notes:
SLT integration monitoring
This blog focuses specifically on SLT integration monitoring. Monitoring an SLT system itself is explained in this dedicated blog.
Set up SLT integration scenario
Start the integration and exception monitoring FIORI tile:
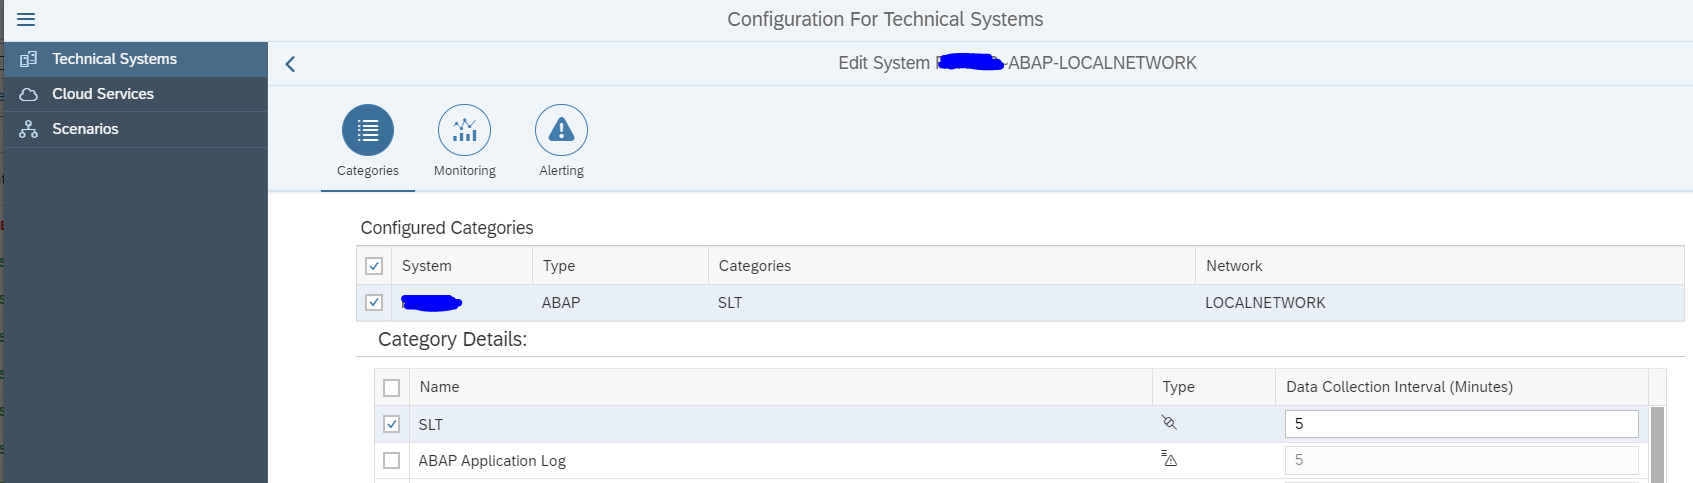
On the configuration add the SLT system:
Select SLT as specific scenario:
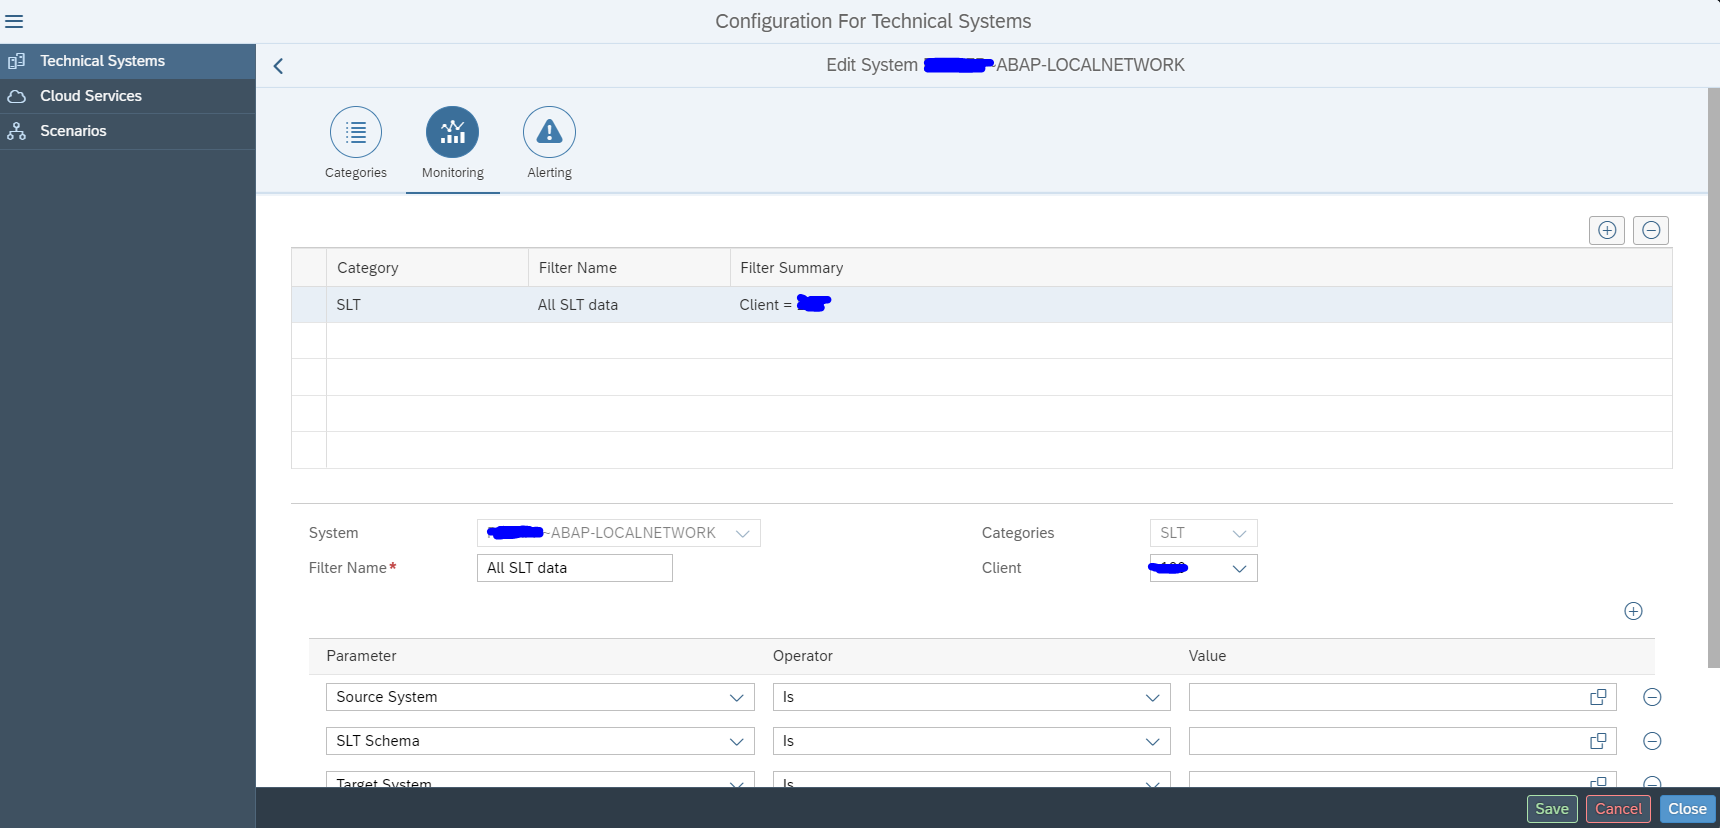
On the Monitoring part you can filter on a specific source system and/or SLT schema:
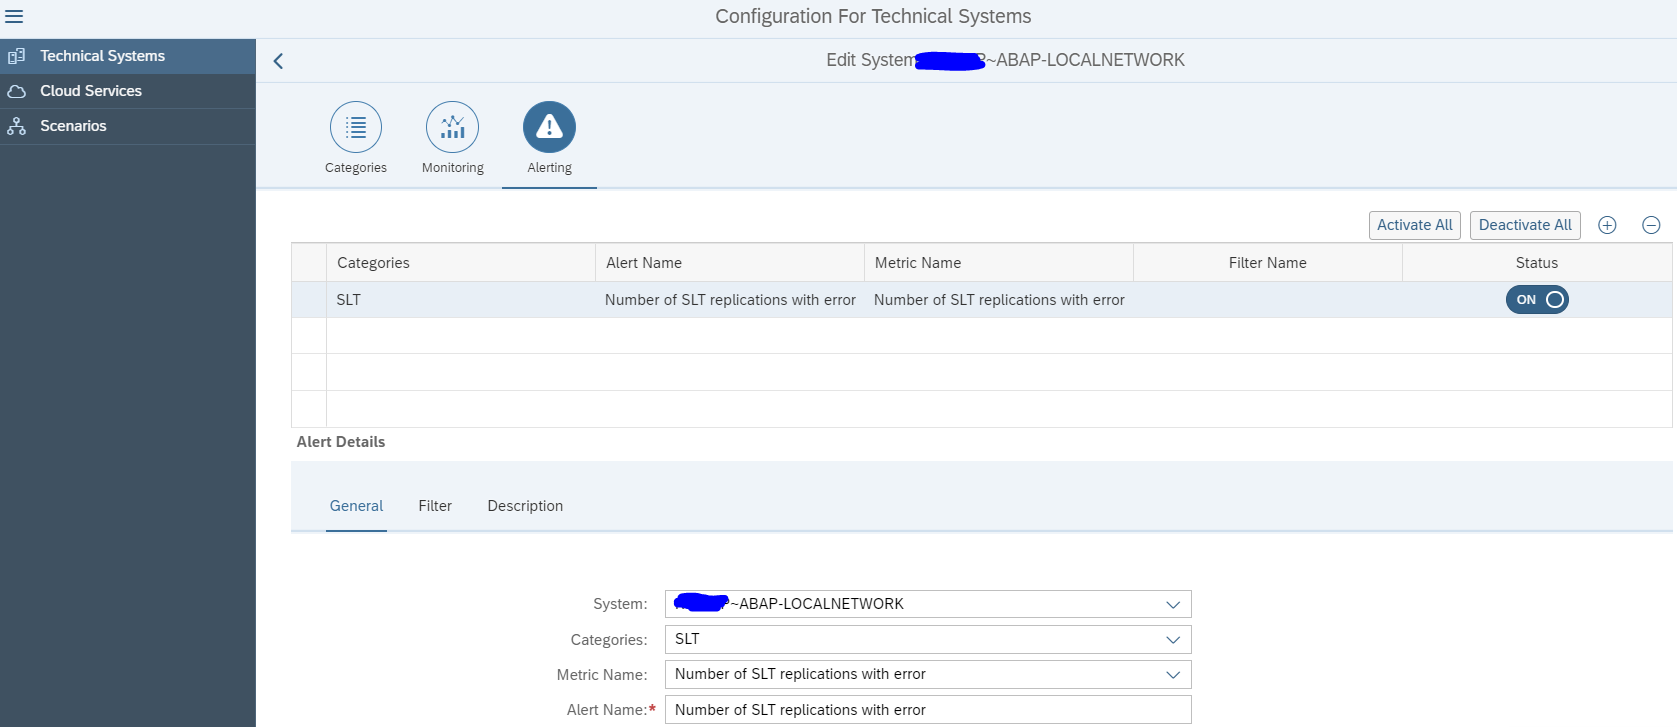
On the 3rd tab you can set the Alerting in cases of errors:
Now save and activate. The monitoring is active now.
Next step is to use this system in a model for your scenario:
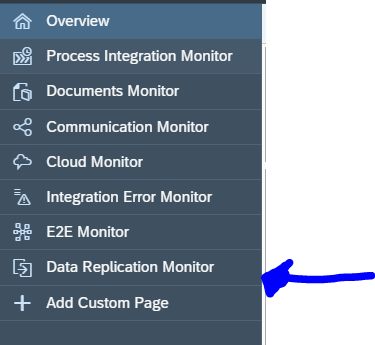
Using the SLT integration monitor
If you open the Fiori tile and you have selected your scenario, you still need to perform an extra click to go to the SLT monitor:
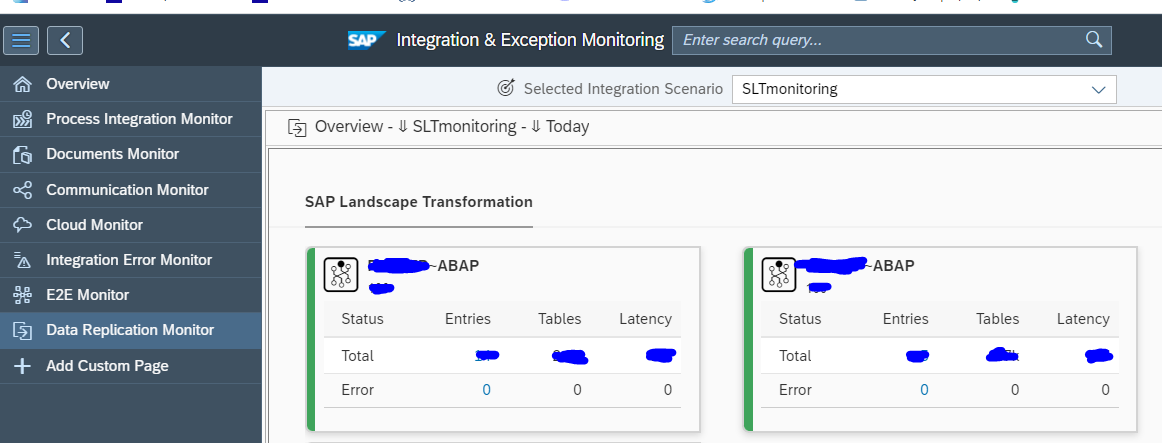
First you get overview of your system(s):
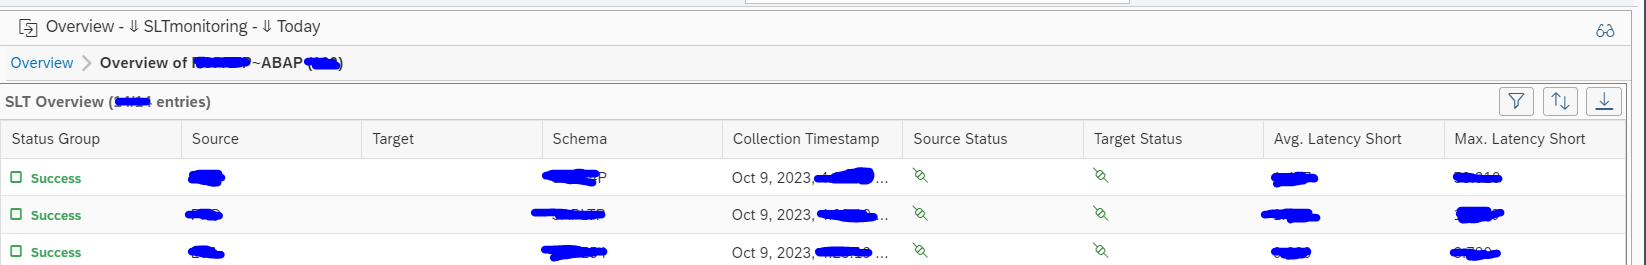
You need to click on the blue numbers to drill down:
This gives overview of errors, source connection status and target connection status.
You cannot drill down further on this tile. If you see an error, you need to go to your SLT server and start transaction LTRO to see all detailed error and start fixing from there. Transaction LTRO can have errors shown that are not visible in transaction LTRC. Focused Run uses LTRO data.
Web service monitoring
Web services monitoring automates the monitoring in transaction SRT_MONI, which is extensively explained in this blog.
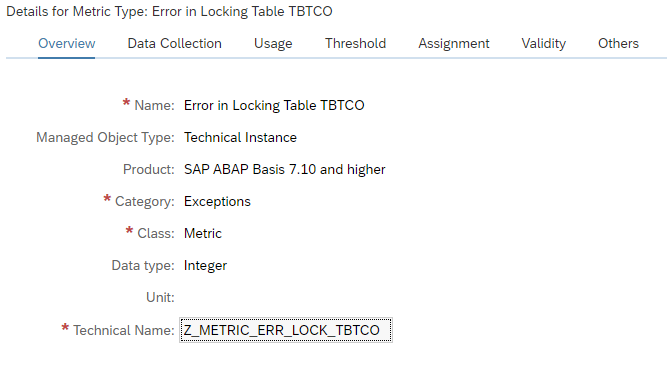
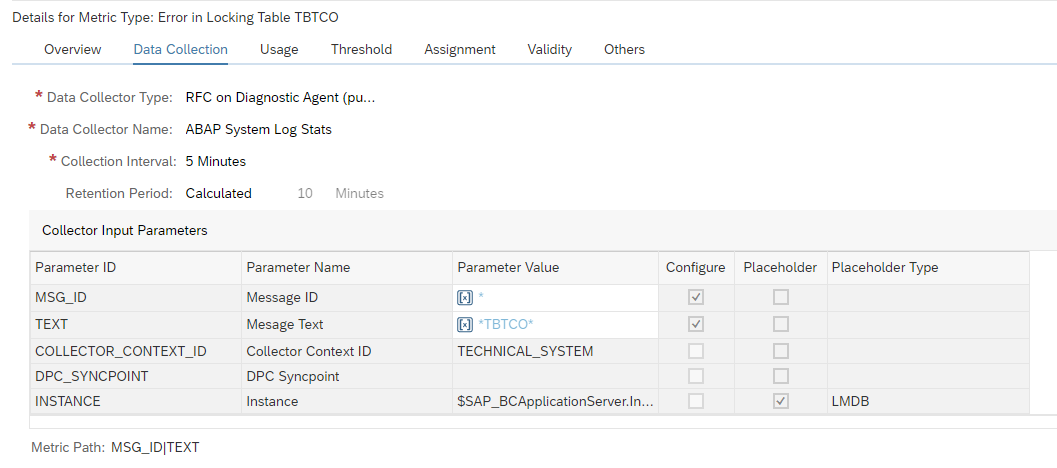
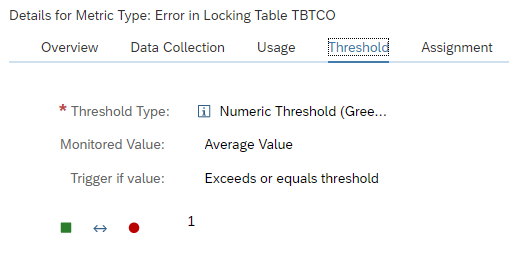
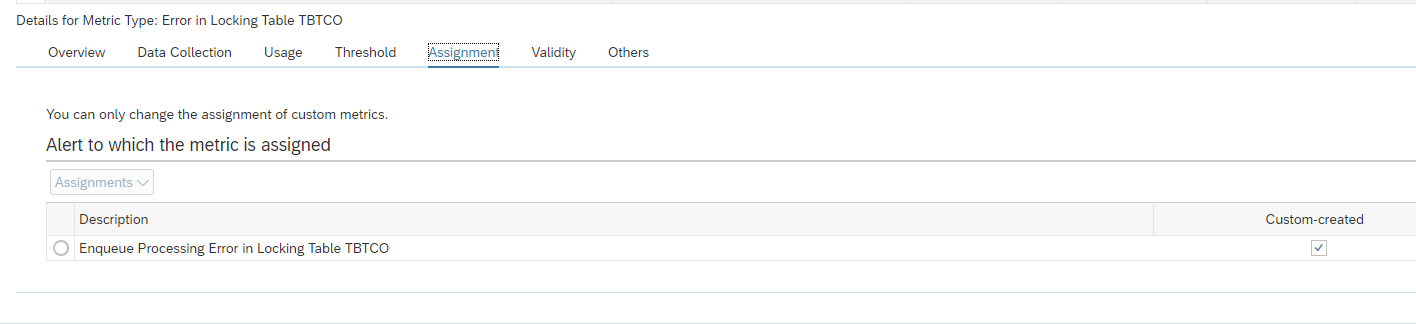
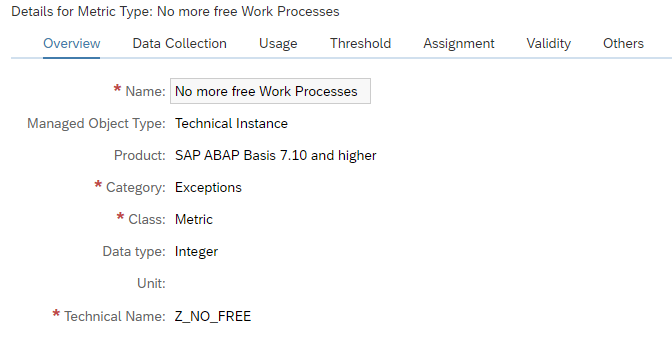
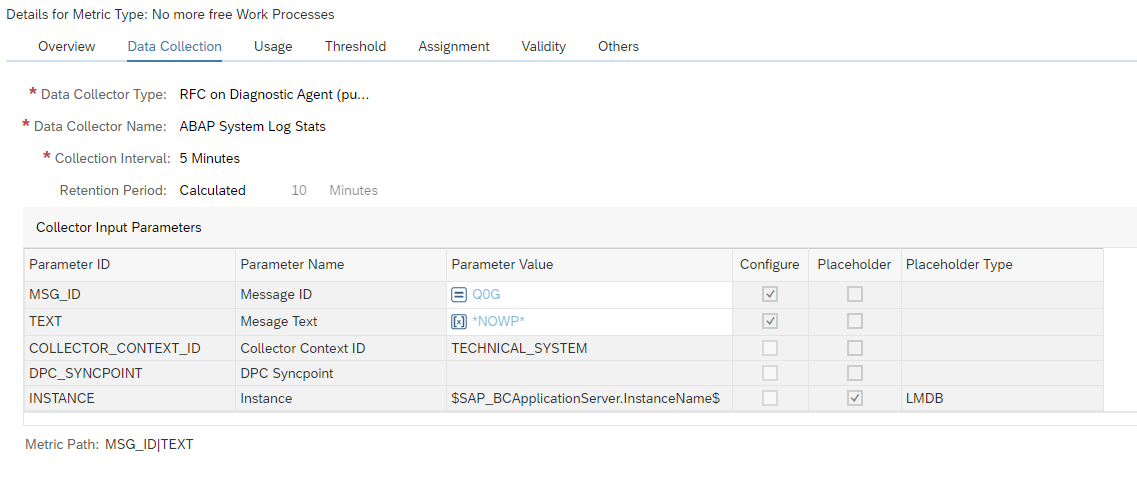
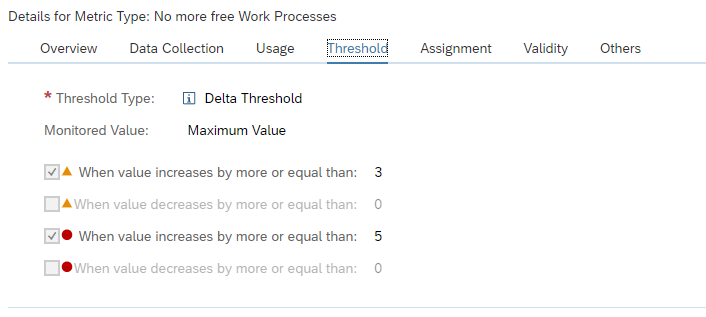
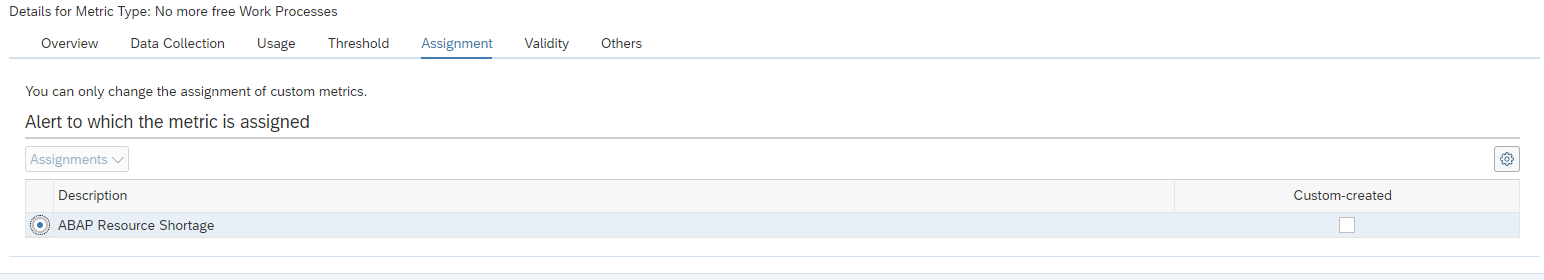
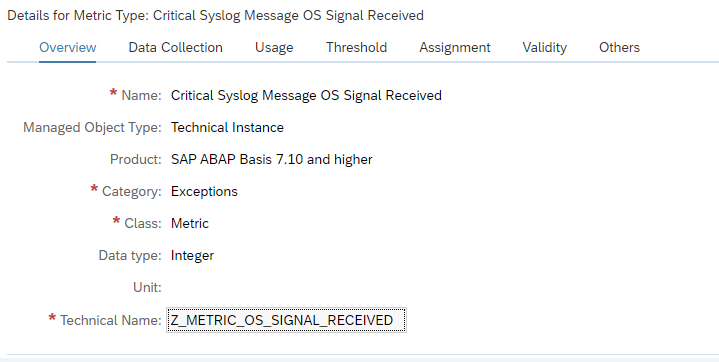
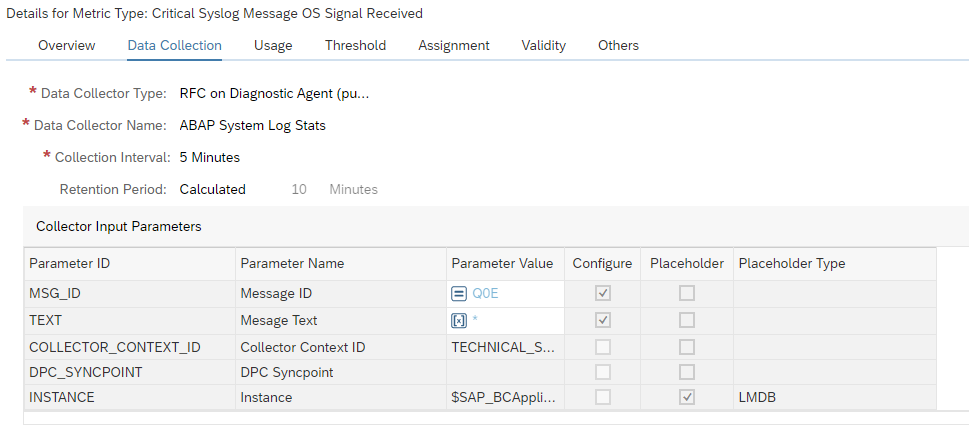
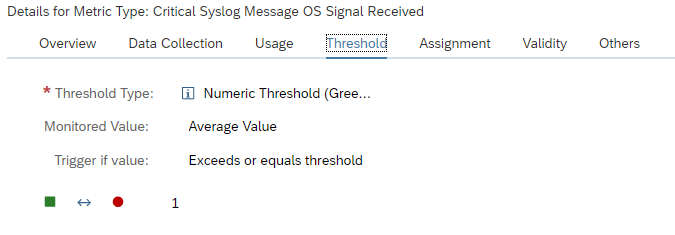
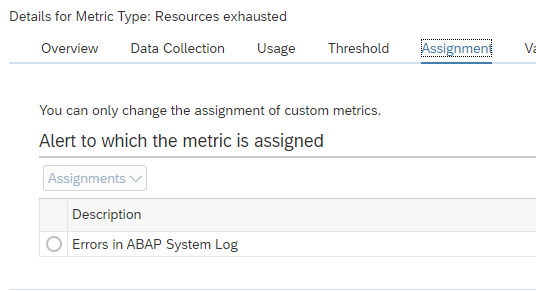
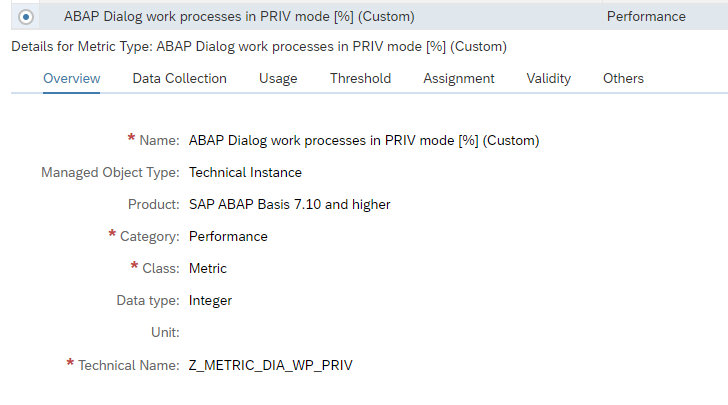
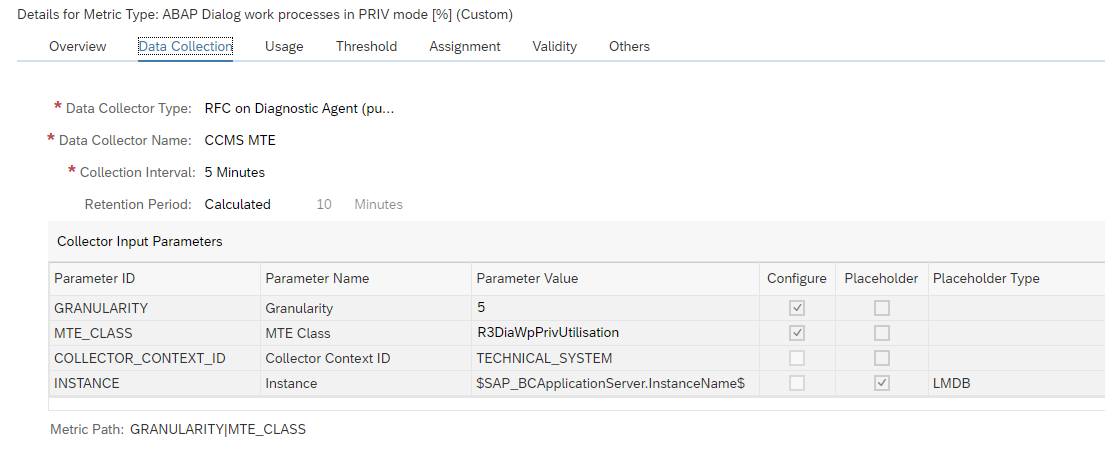
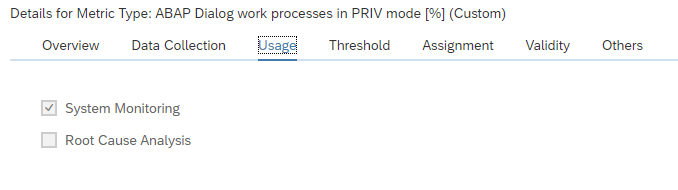
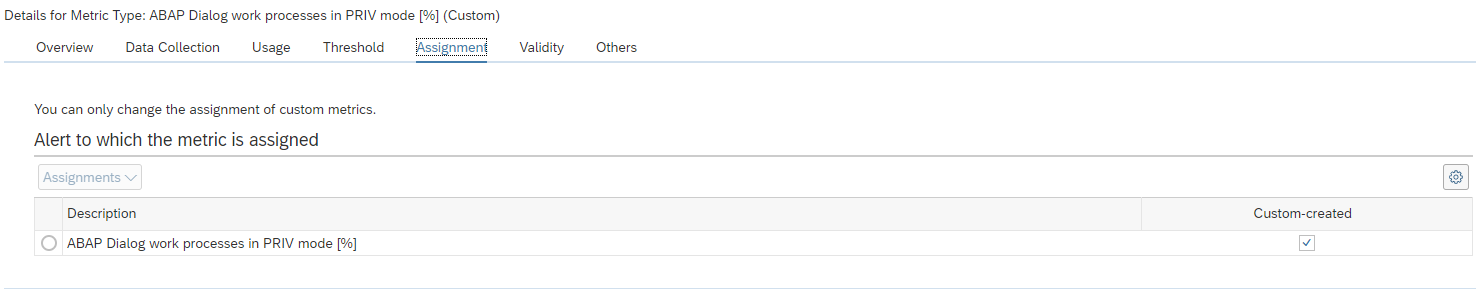
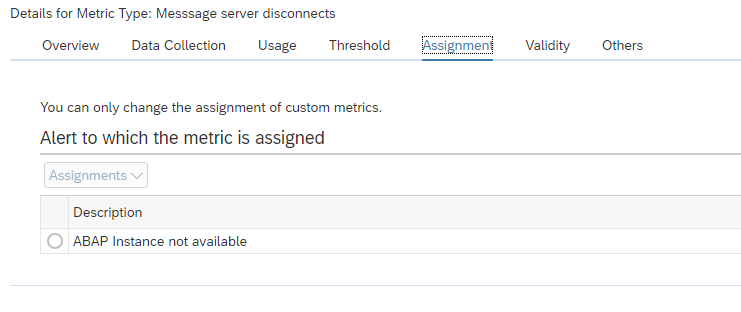
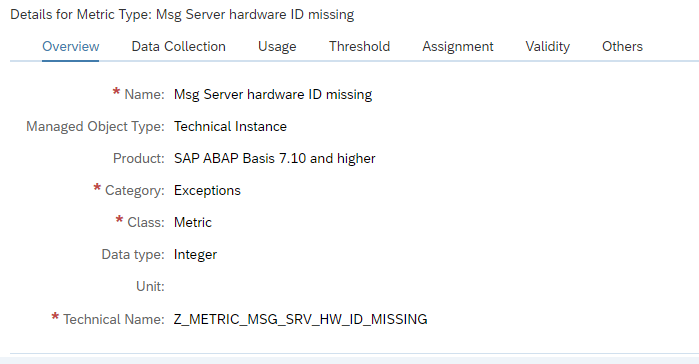
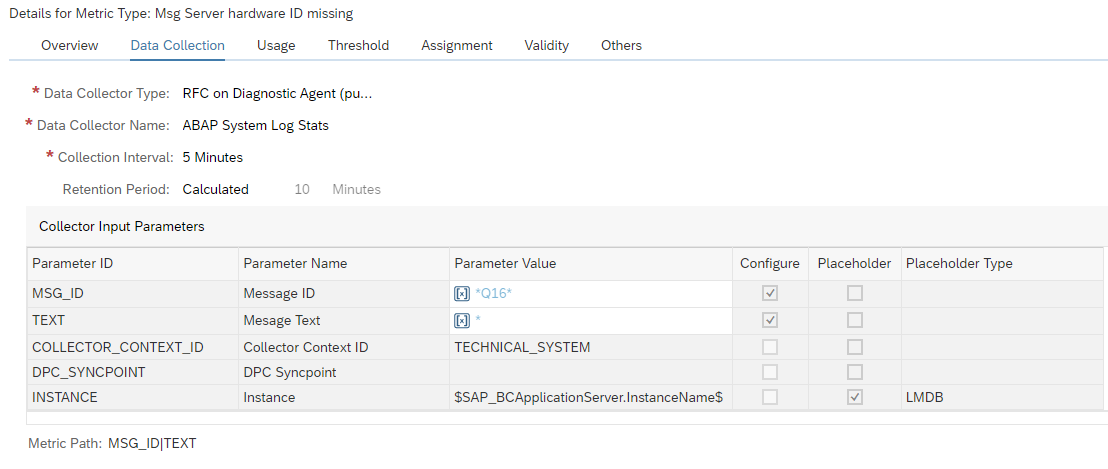
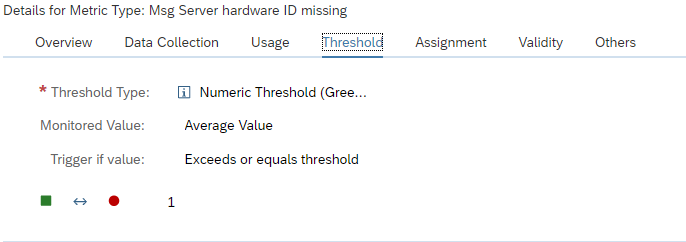
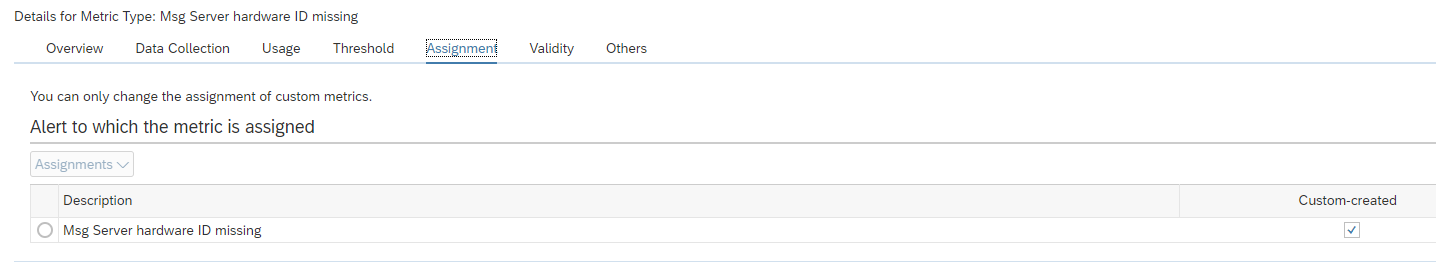
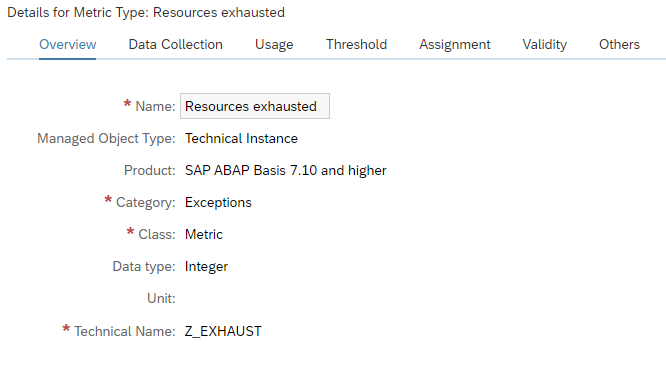
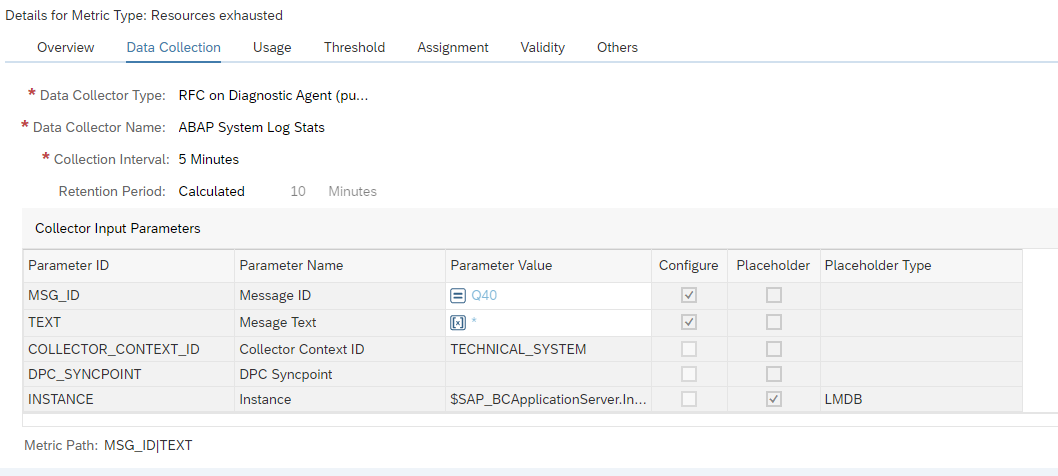
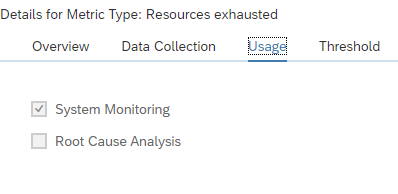
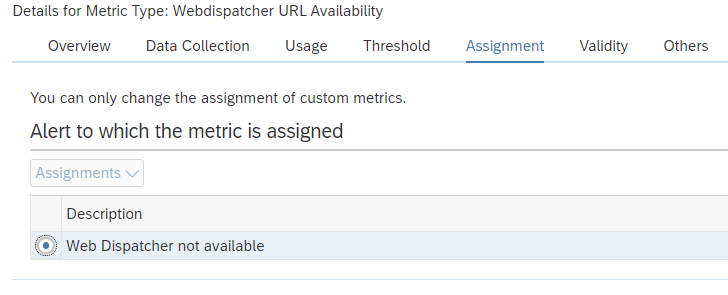
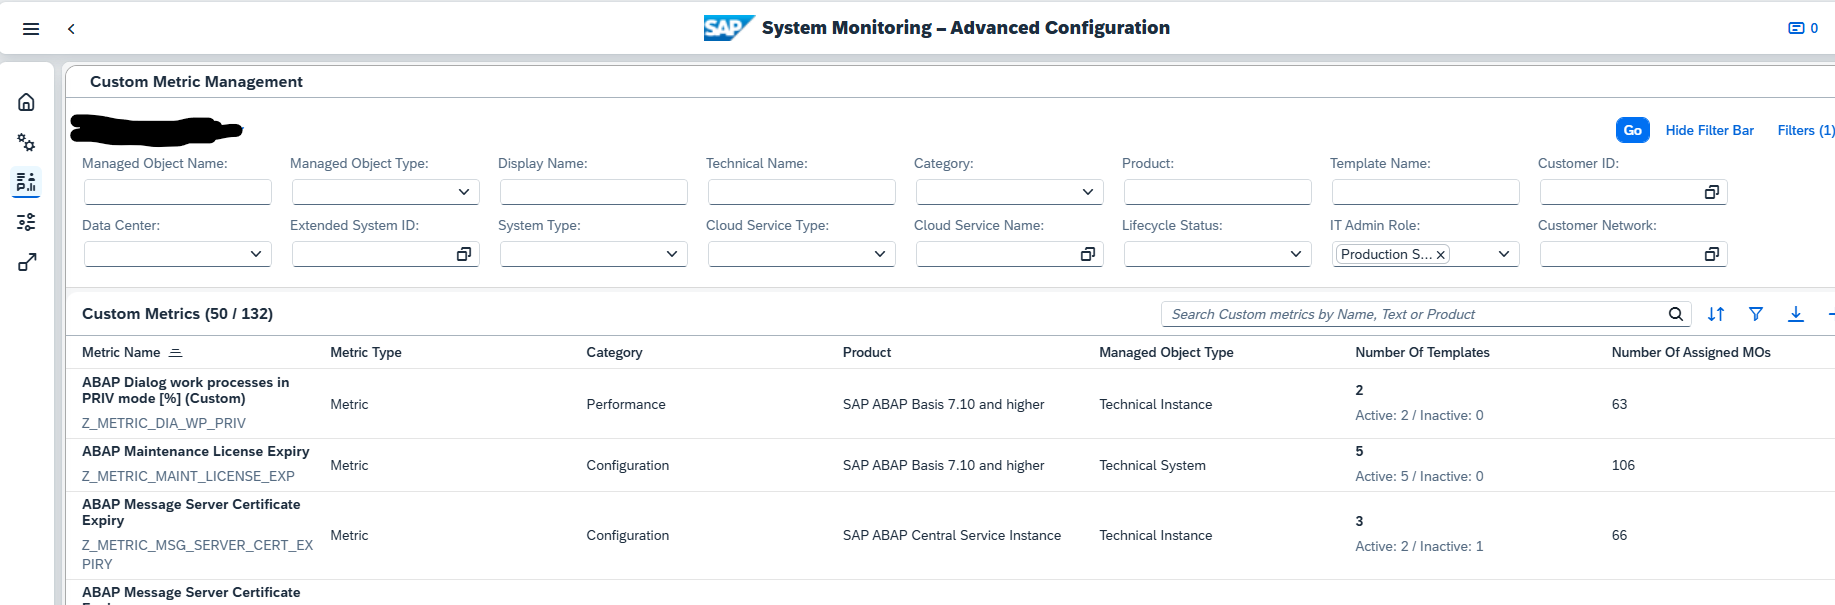
This monitoring does not check the connection availability of the web service. To make that happen, you would need to install a custom program from this blog, that writes an entry to SM21. From the SM21 entry, you can create a custom monitoring metric that alerts on the connection issue. How to setup custom metrics is explained in this blog.
SAP reference for web service monitoring can be found here.
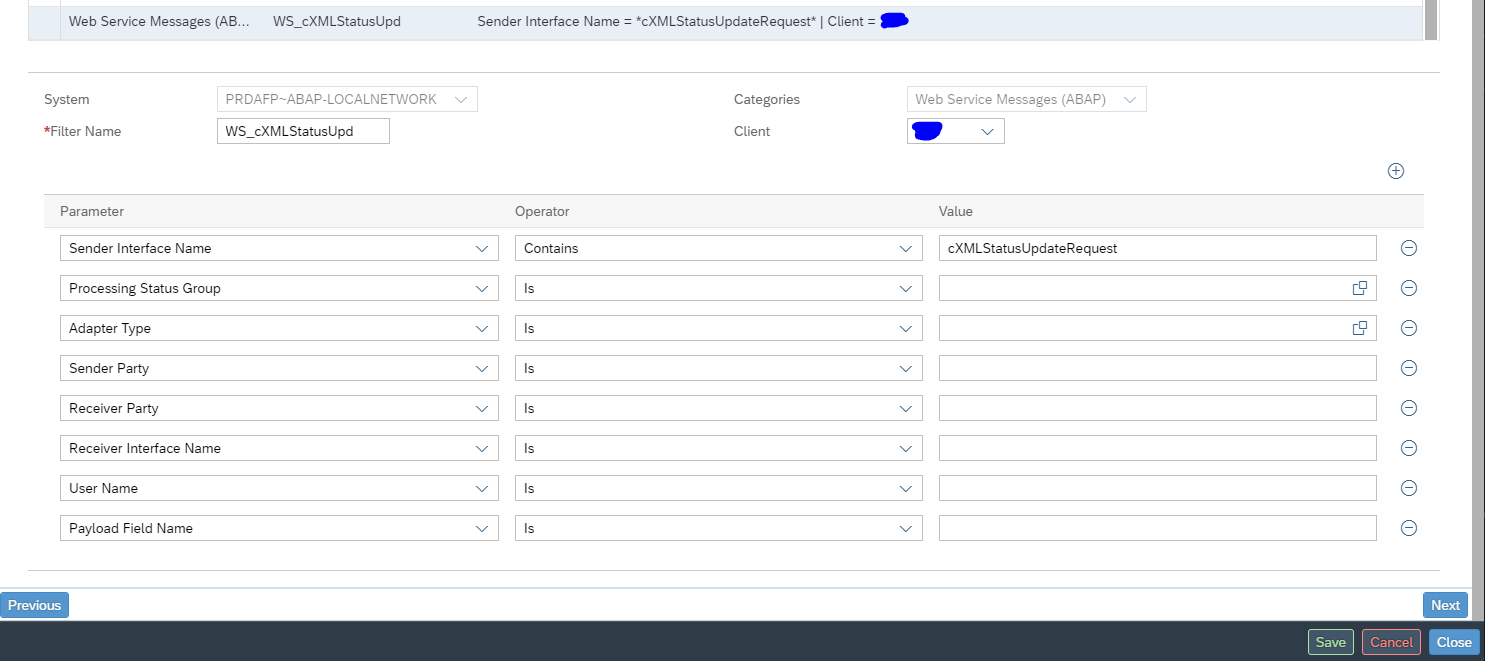
Data collection and alerting setup for web service monitoring
In the configuration for interface monitoring in the Technical System settings, goto the monitoring part and activate the data collection for Web Service Errors:
In the monitoring settings, you can filter on specific criteria, or leave everything blank to report on everything:
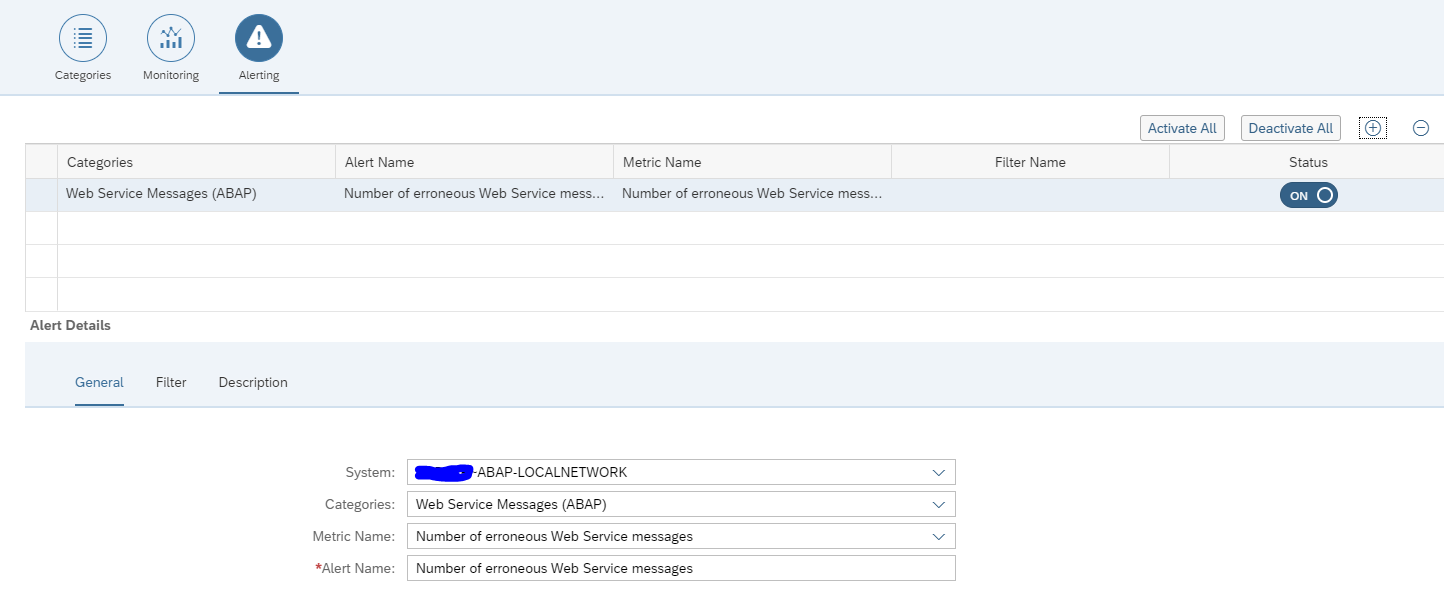
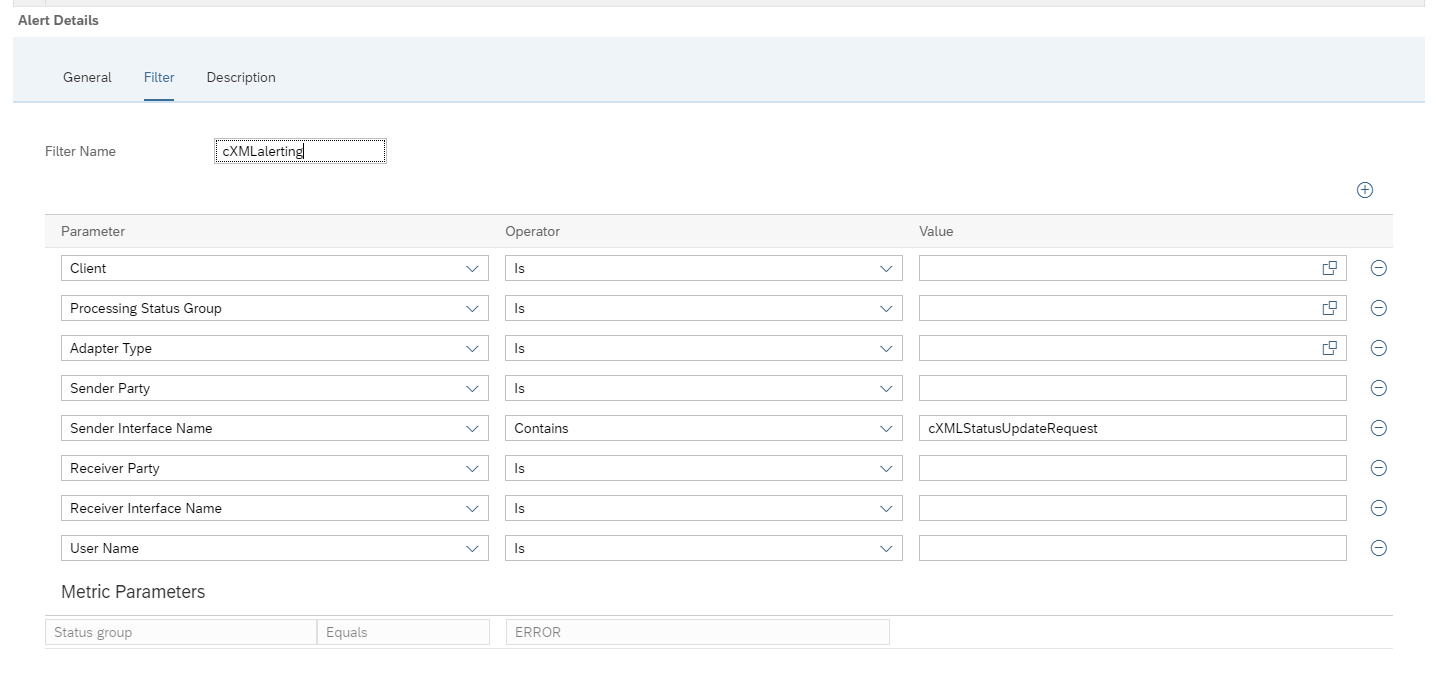
In the alerting part check you can choose between amount of entries and number of error entries:
And set the filters for the alerting:
The filter for monitoring and alerting can be different. It could be you want to monitor all errors, but only activate specific important ones.
Save your monitoring data collection and alerting settings.
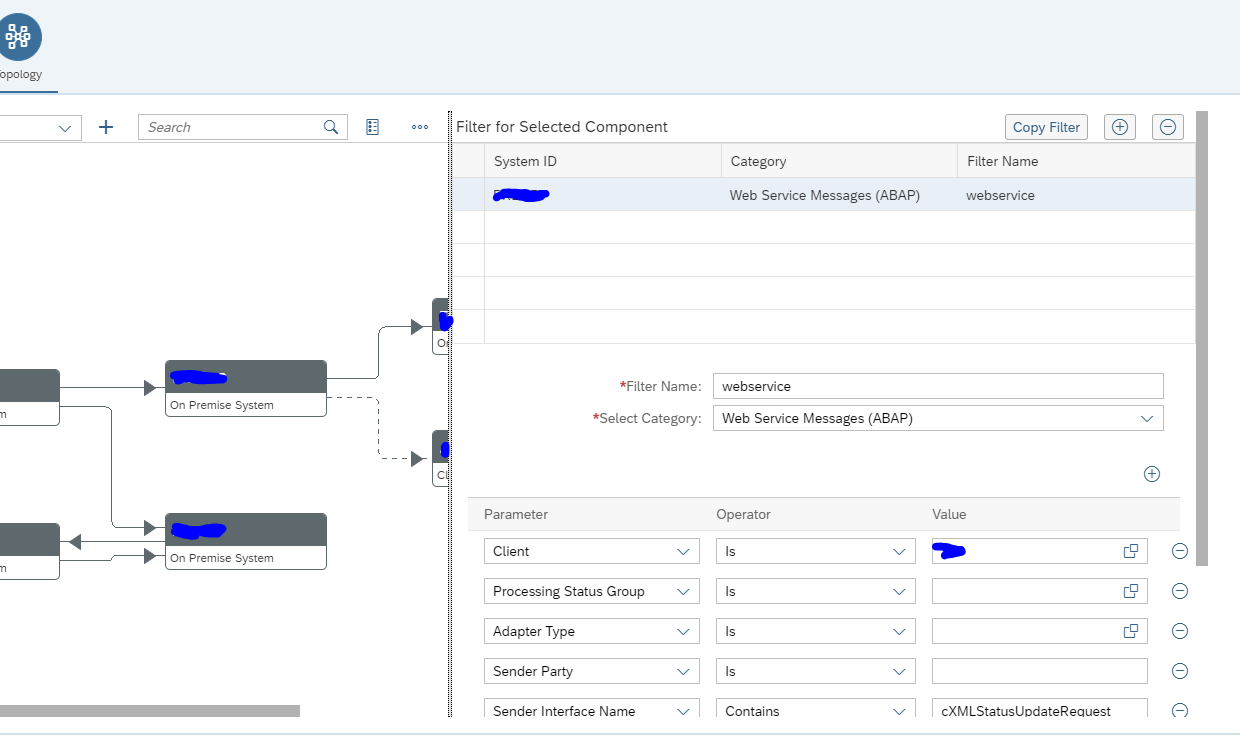
Graphical modelling of web services monitoring
In the graphical modelling add the filter between two systems for the web service monitoring:
Also here: first scroll down to see the OK button. Press first OK before pressing Save, or you might loose the data and have to re-enter it. This it bit annoying in the UI.
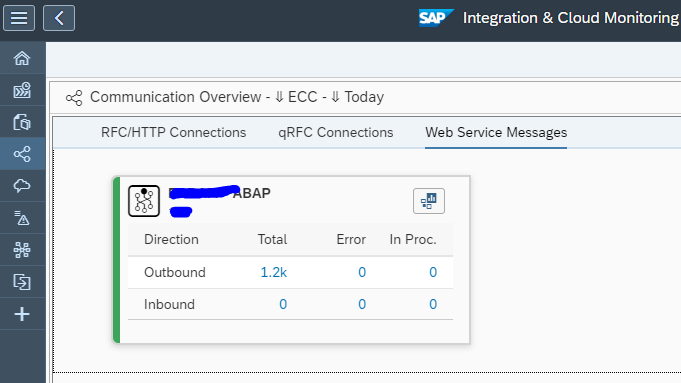
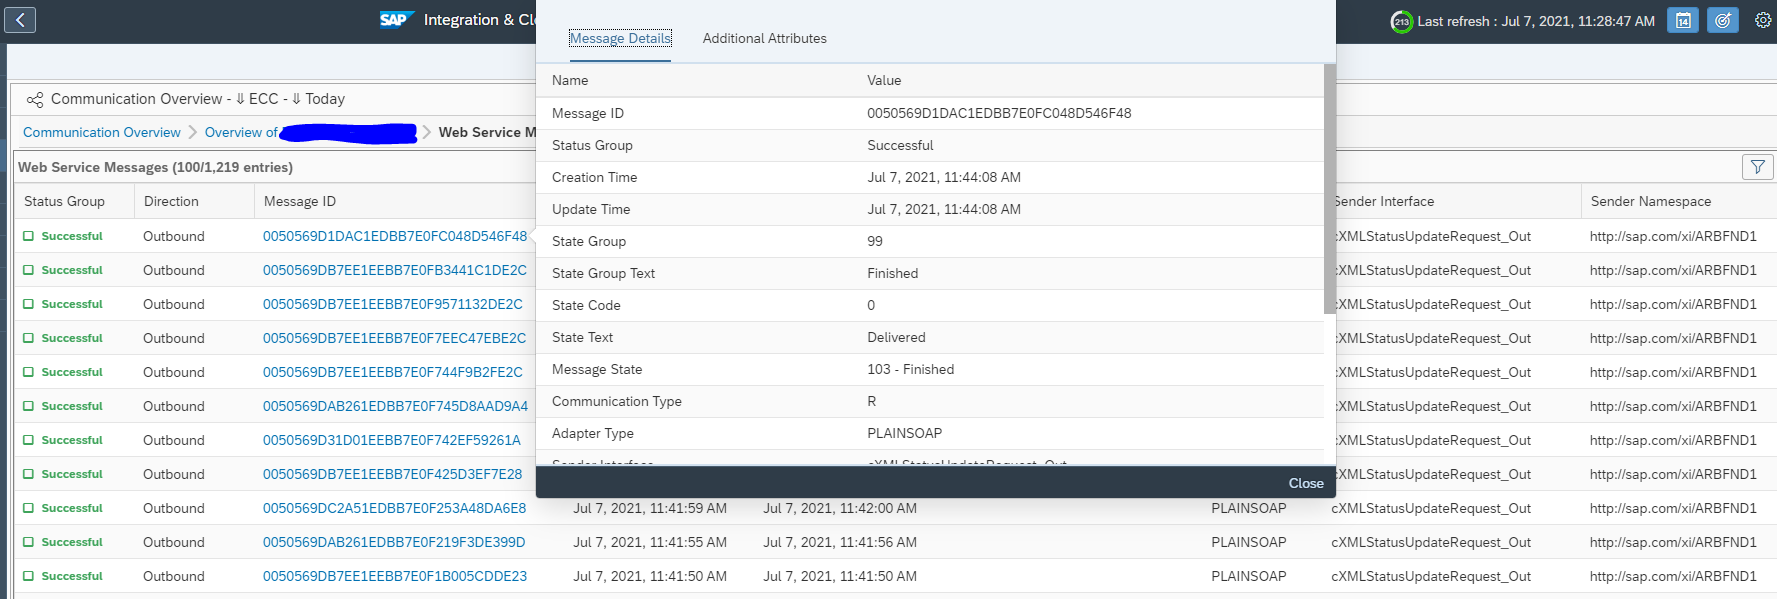
Monitoring usage of web services
The end result looks as follows:
You can click on the errors or success messages and zoom all the way down to individual messages:
<< This blog was originally posted on SAP Focused Run Guru by Frank Umans. Repost done with permission. >>