This blog will explain specific items to keep in mind when monitoring certain applications.
Applications discussed and explained:
- Adobe document servers (ADS)
- BW systems
- Cloud connectors
- Content servers
- ECC and S4HANA servers
- EWM (enterprise warehouse management) servers
- GTS (global trade system) servers
- Netweaver gateway FIORI hub systems
- SCM (supply chain management) servers
- SLT servers
- Web dispatchers
For each system we explain the monitoring of productive and non-productive system.
Adobe document server (ADS) application monitoring
Adobe Document Server (ADS) is used to generate PDF’s for output and/or interactive PDF forms.
Monitoring productive ADS systems
When monitoring a productive system, you will need to finetune the monitoring templates for:
- SAP J2EE 7.20 – 7.50 Application template, for the JAVA application
- SAP J2EE 7.20 – 7.50 Technical instance template, for the JAVA application servers
- System host template
- Database template
JAVA APPLICATION TEMPLATE for adobe document server monitoring
Make sure you cover in the JAVA application template the following items:
Availability:
- JAVA HTTP availability
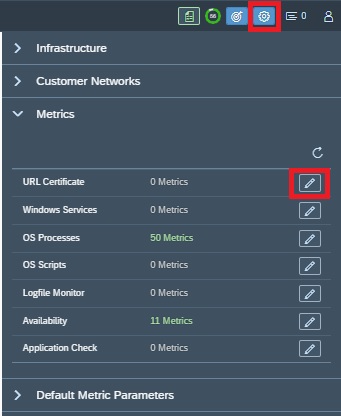
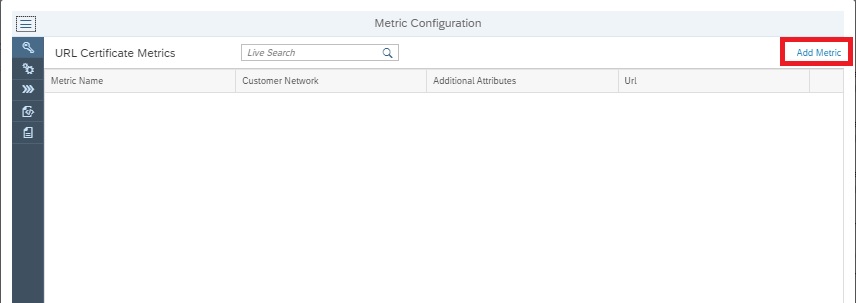
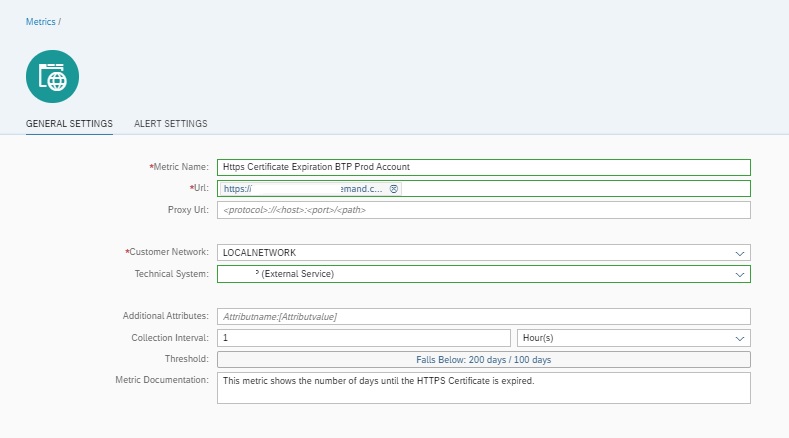
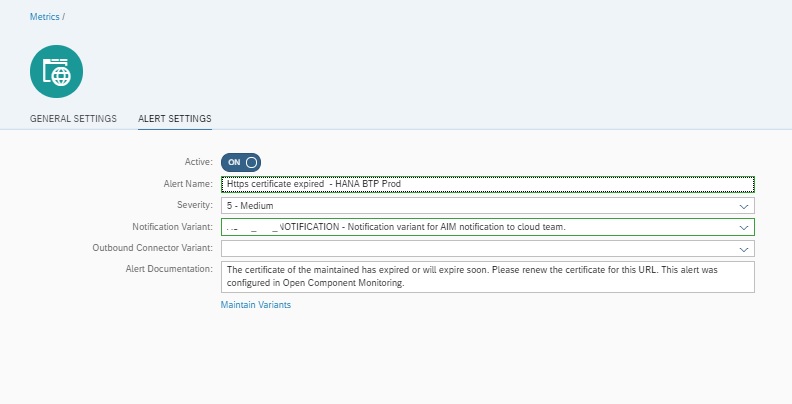
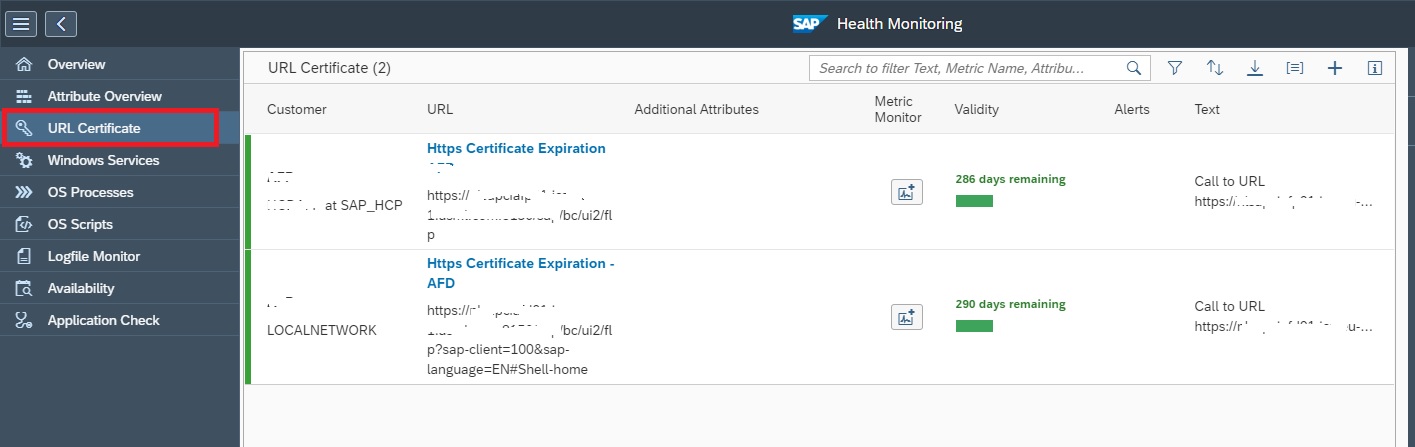
- Expiring certificates
- JAVA license expiry
From the JAVA instance template make sure to cover the following items:
- J2EE application status
- Instance HTTP availability and logon
- JAVA server node status
- GC (Garbage collection)
Fine tune the metrics so you are alerted on situation where the system is having issues.
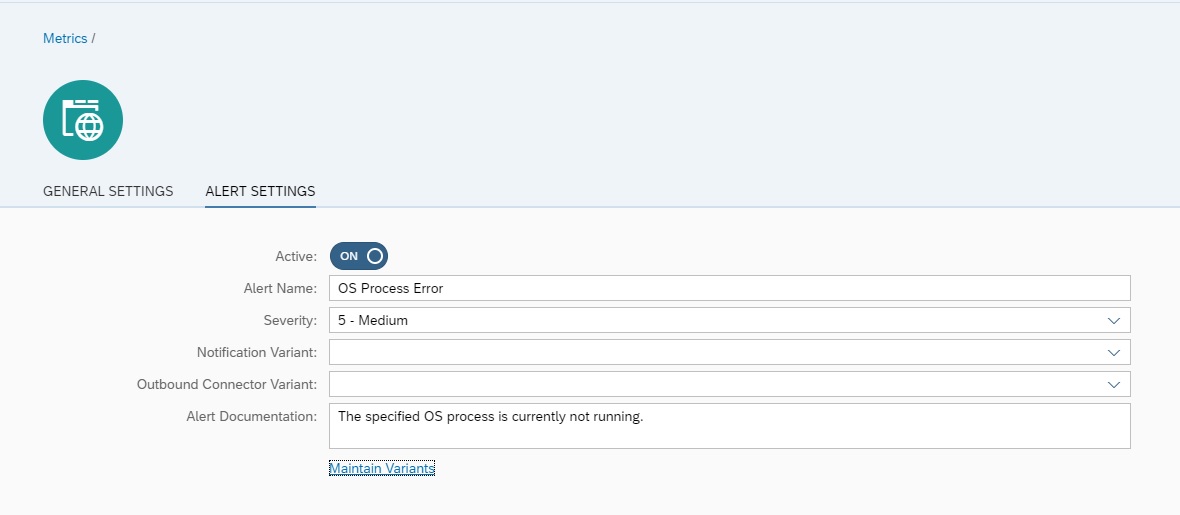
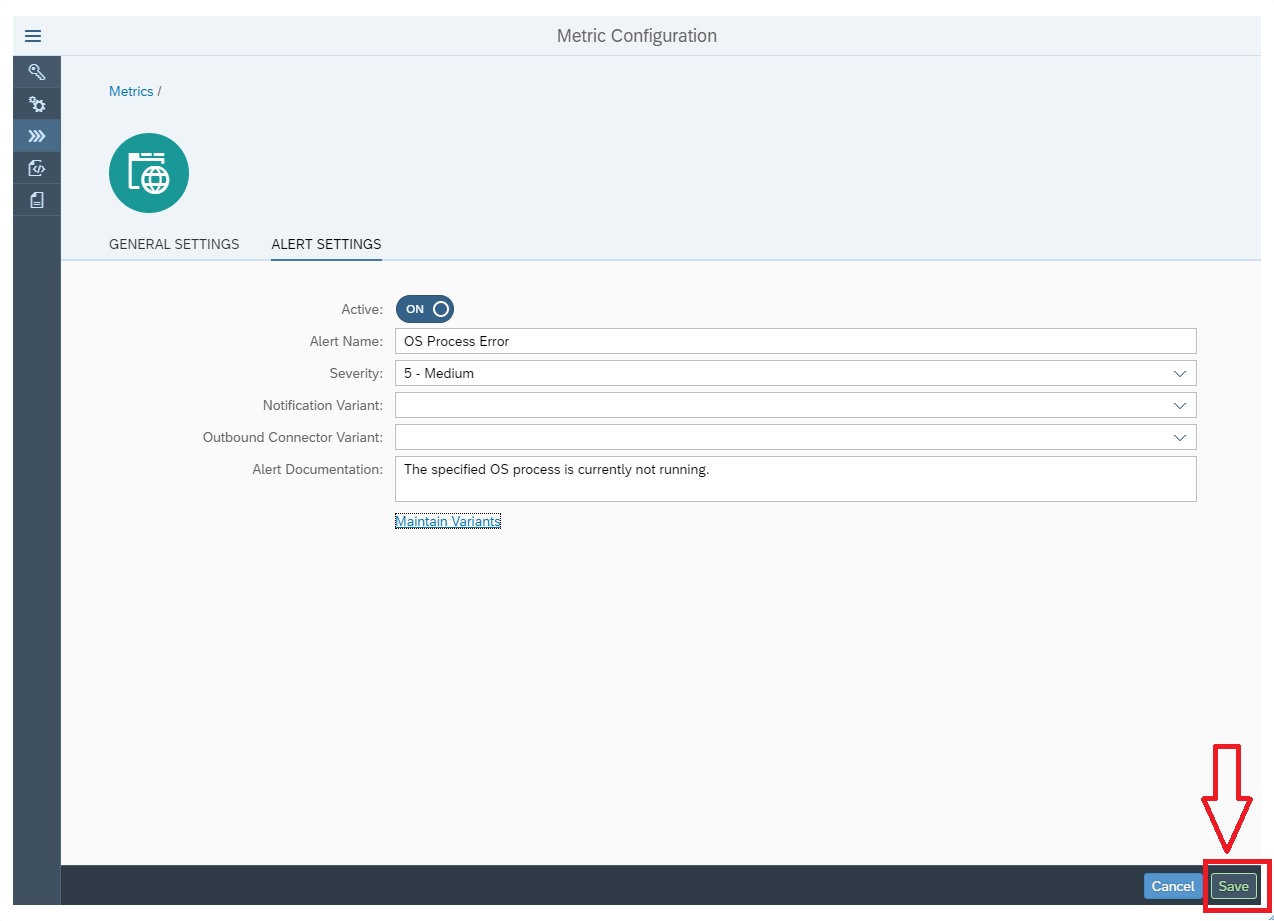
ADobe document server template for monitoring
ADS has a specific Technical instance template.
Make sure you activate it:
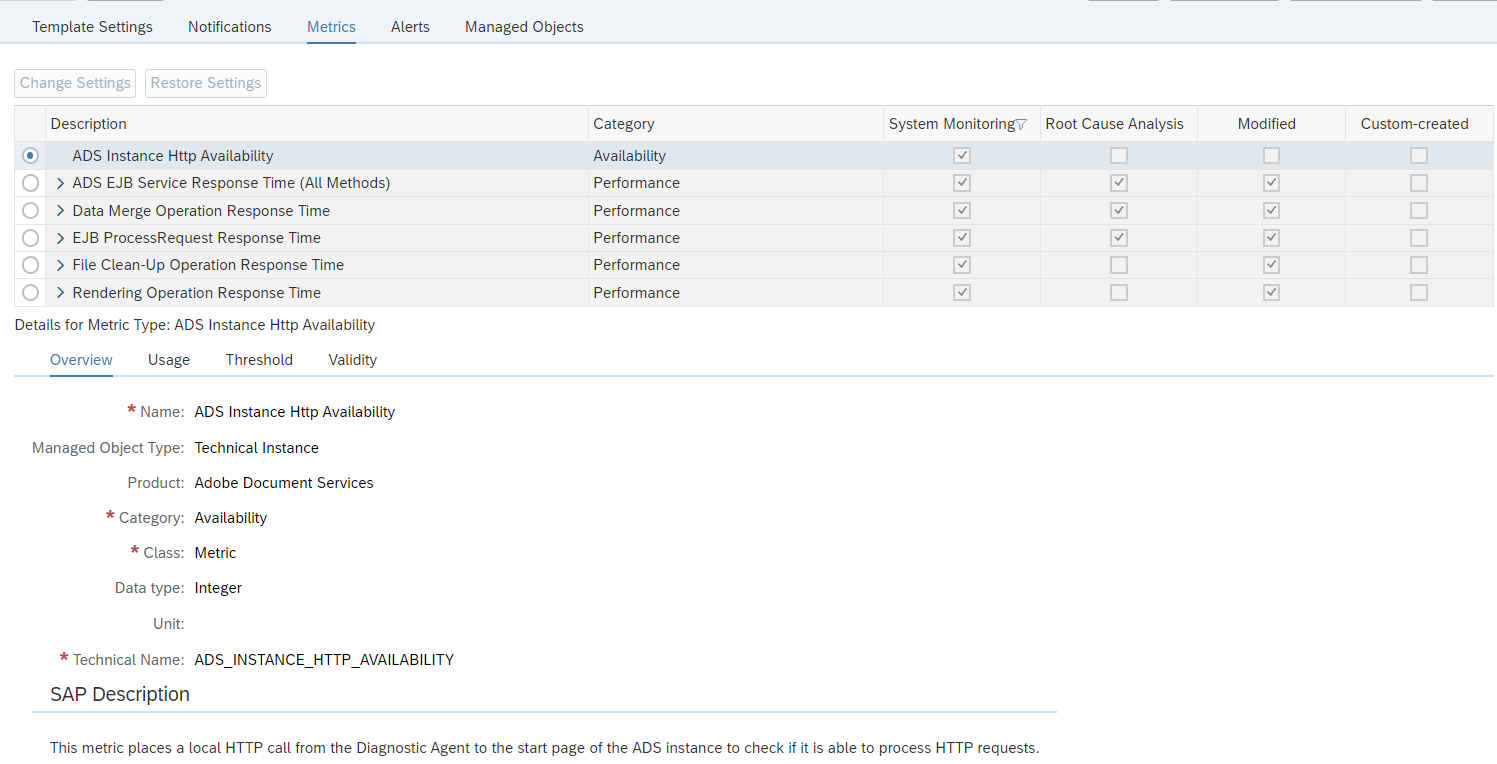
Most important here is the first one: ADS availability. Please make sure you are alerted when this one is not available.
BW application monitoring
BW systems are at the often used as reporting systems within an SAP landscape.
The basic monitoring of a BW system is the same as for any ABAP based system.
For a BW system some numbers are typically higher than on an ECC or S4HANA system. Response times of 1.5 seconds would indicate horrible performance on ECC, but are normal on a BW system.
Process chain monitoring
BW uses process chains. To monitor process chains, read this dedicated blog.
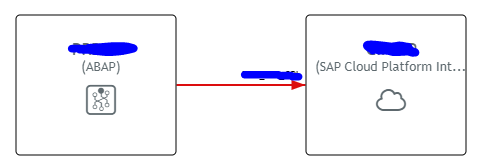
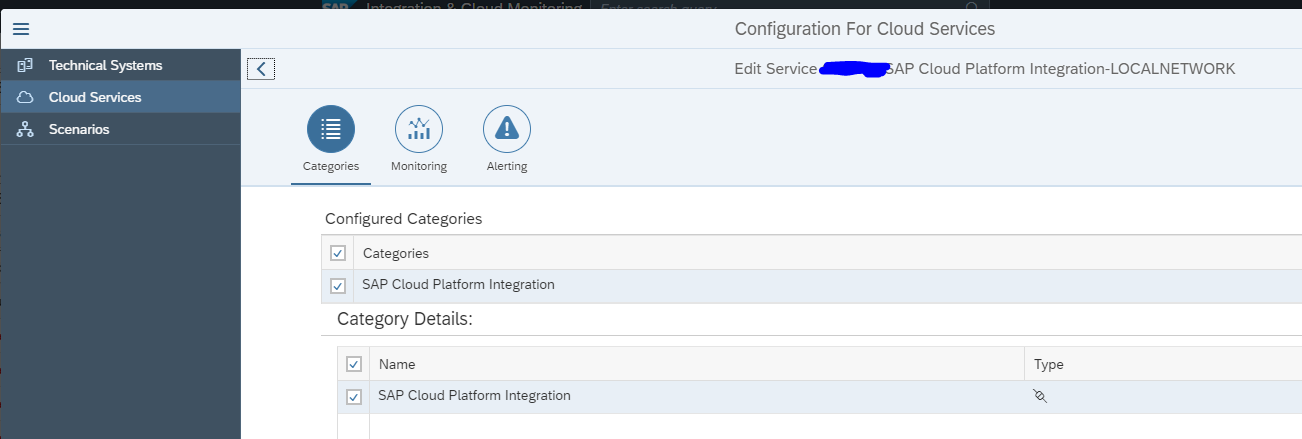
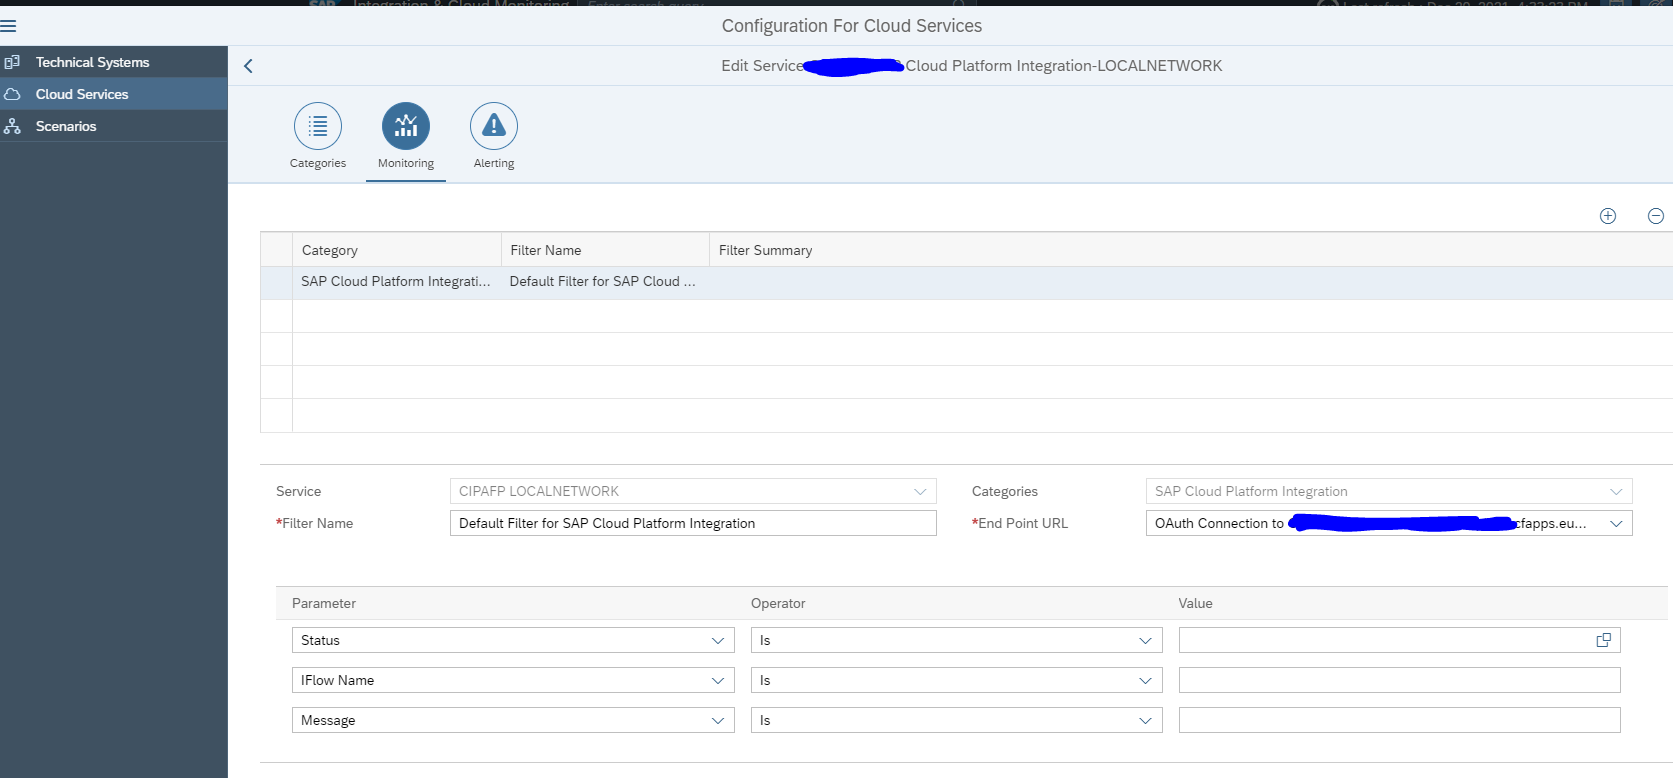
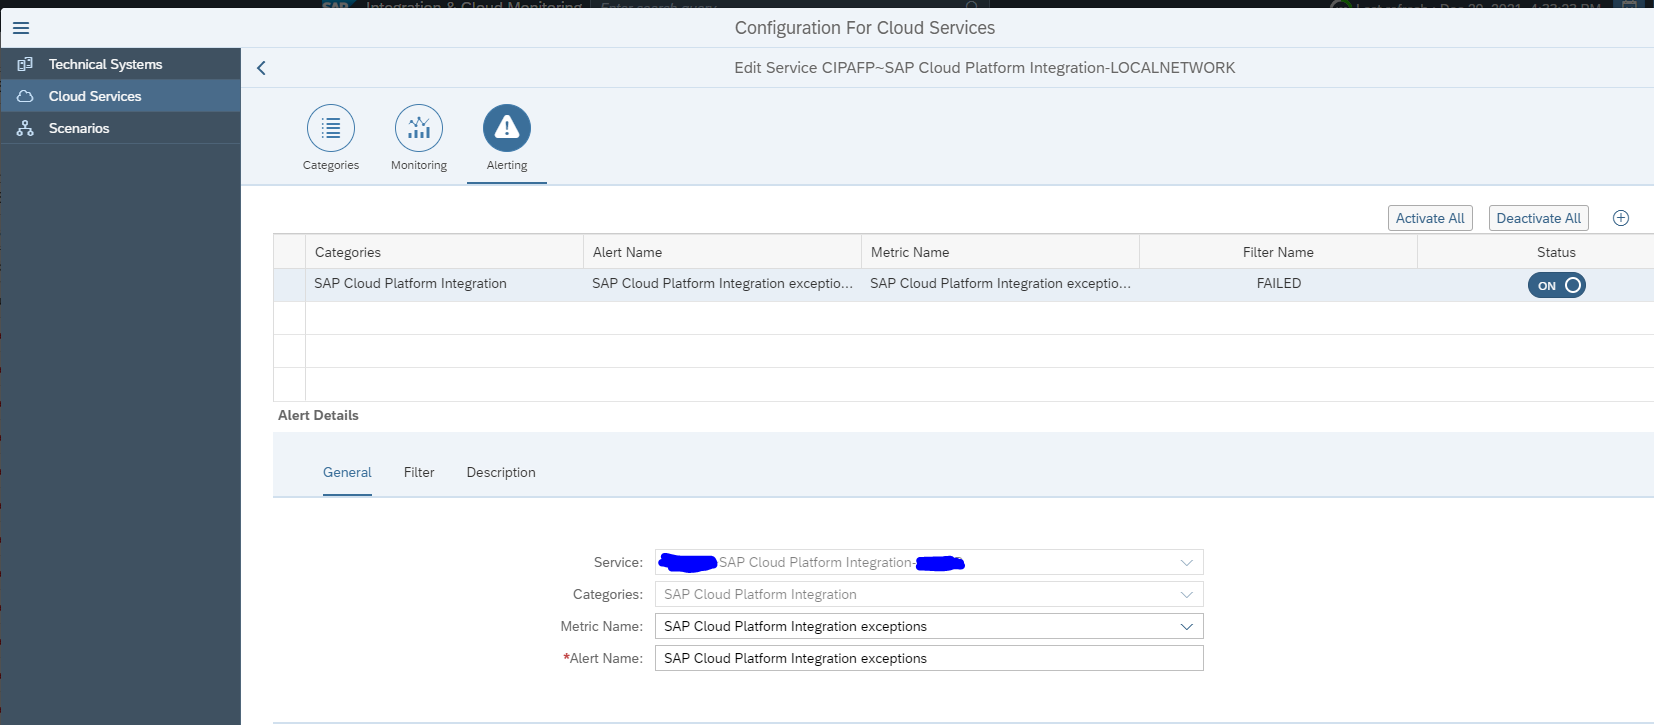
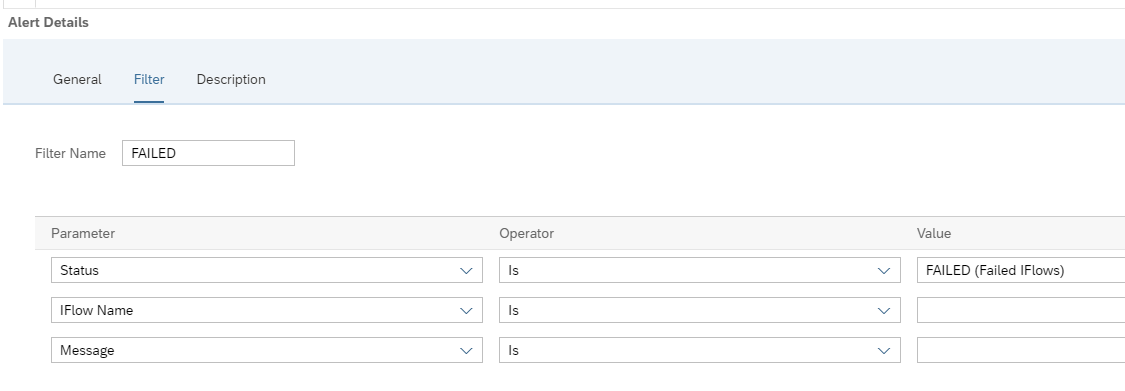
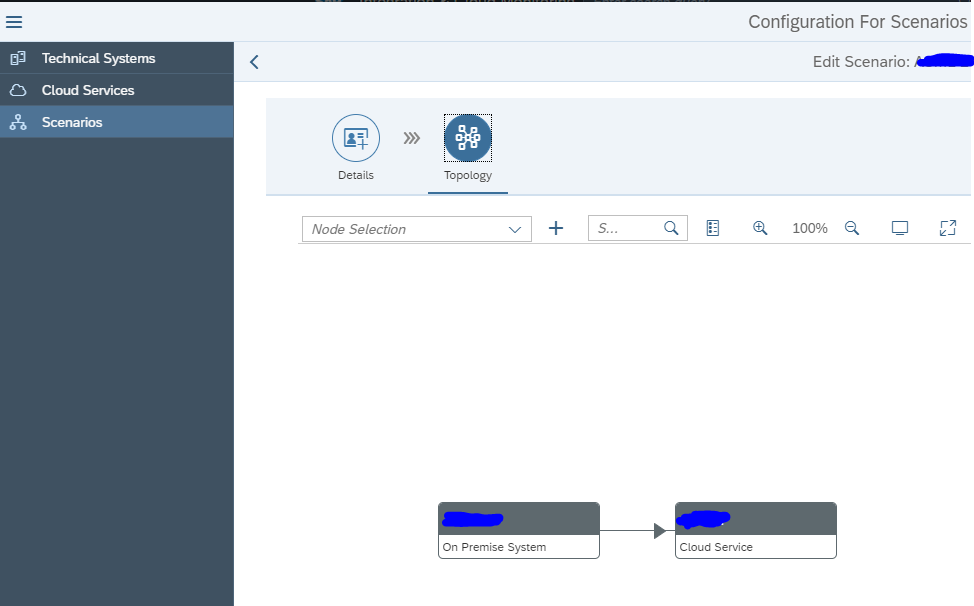
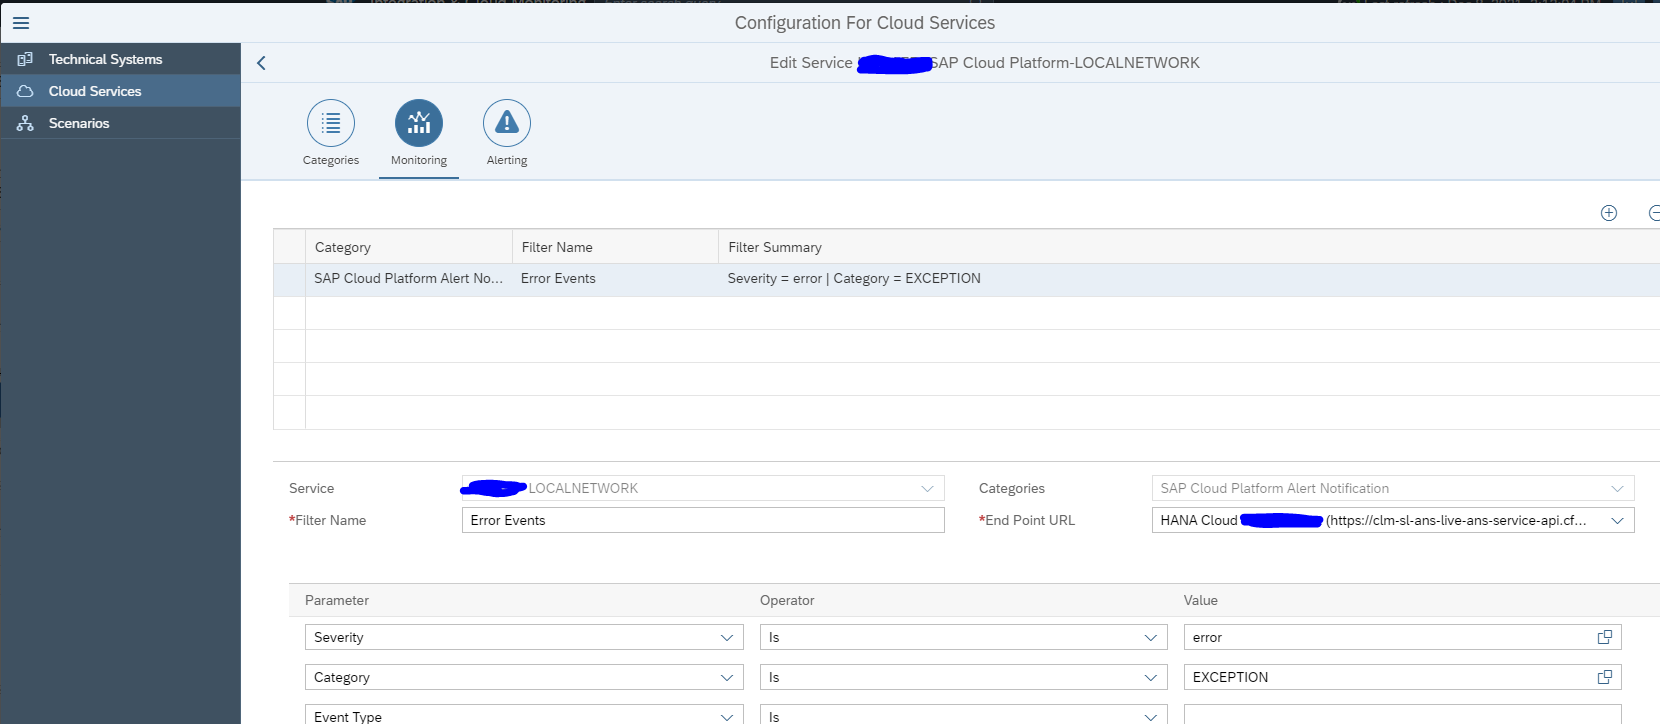
Cloud connector application monitoring
The Cloud connector is used between on premise systems and Cloud solutions provided by SAP.
Monitoring of cloud connector focuses on availability and connectivity.
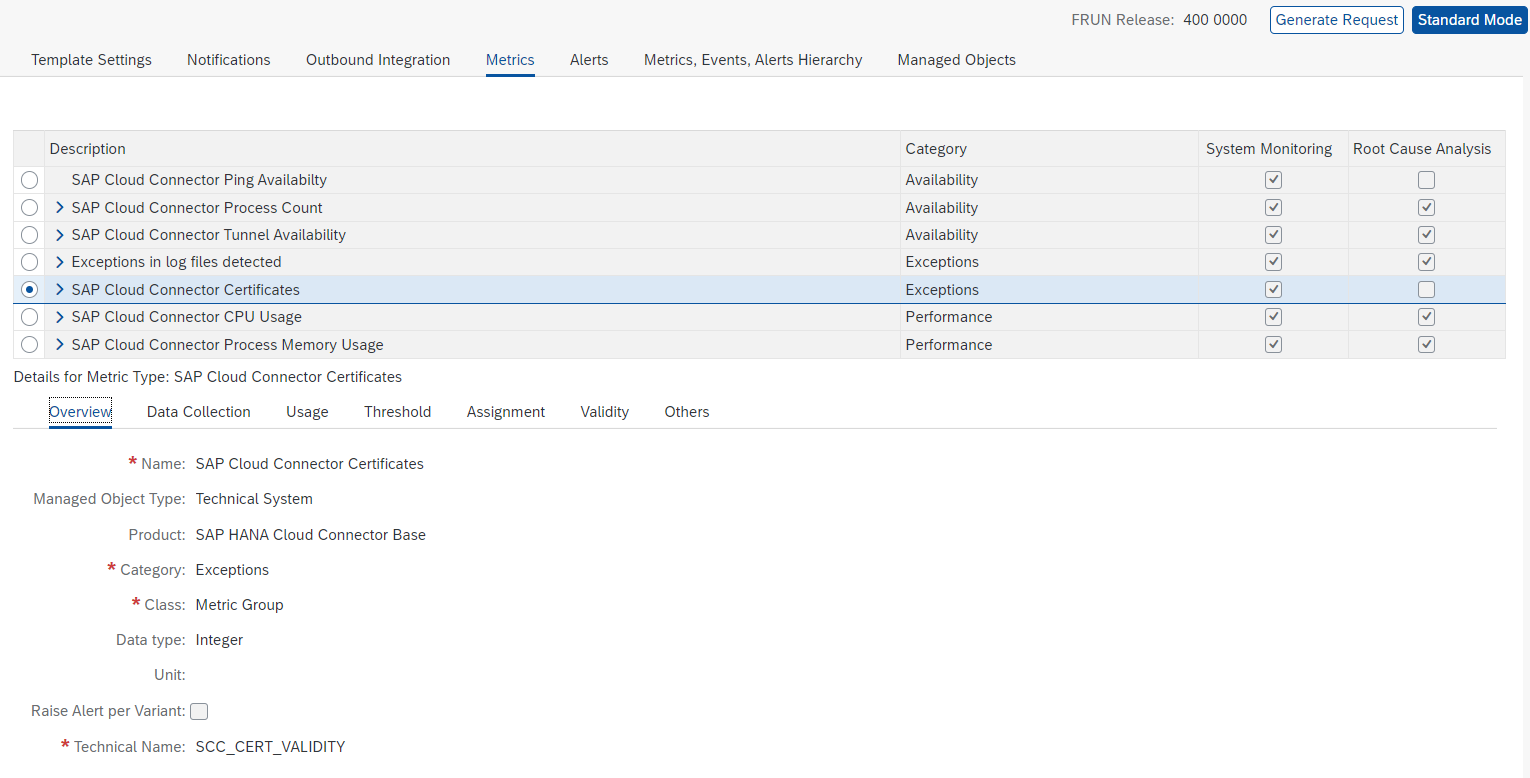
Monitoring productive cloud connector systems
The cloud connector template contains all the needed elements out of the box:
If your landscape has only one cloud connector that is also used for non-productive systems, you might find a lot of issues in the non-productive system. Like expired certificates, channels not working, many logfile entries. If the cloud connector is very important for your business, it is best to split off the productive cloud connector from the non-productive usage. This way you can apply sharp rule settings for production: even single issue will lead to alert. While on non-production the developers will be making a lot of issues as part of their developer process.
Monitoring non-productive cloud connector systems
In your landscape you might have a non-productive cloud connector that is used for testing purposes. In the non-productive cloud connectors you might apply a different template with less sensitive settings on certificates, logfiles and amount of tunnels that are failing.
Relevant OSS notes for cloud connector monitoring
3391143 – Cloud Connector system is not coming into SAP Focus Run LMDB
Content server application monitoring
Content servers are often used to store attachment and data archiving files. They are technical systems with usually no direct access for end user. End users normally fetch and store data form content server via an ABAP or JAVA application.
Technical setup for content server monitoring
The technical setup for monitoring content server in SAP Focused Run is described in detail in a PDF attached to OSS note 3151832 – SAP Content Server 6.40/6.50/7.53 Monitoring with SAP Focus Run. There is no need to repeat here.
The main part of content server monitoring is availability.
ABAP connection to content server monitoring
In some cases both your ABAP stack and content server are up and running, but communication between them is failing on application level. This leads to not working system for end users. Root causes can be firewall issues, certificate issues, or somebody altered settings.
To test the ABAP system connection to content server a custom ABAP program is needed. See this blog. You can schedule the program in batch and set up a new custom metric to capture the system log entry written by the program.
System host template for content server monitoring
For system host the regular CPU, memory, disc template is sufficient. Finetune the thresholds to your comfort level.
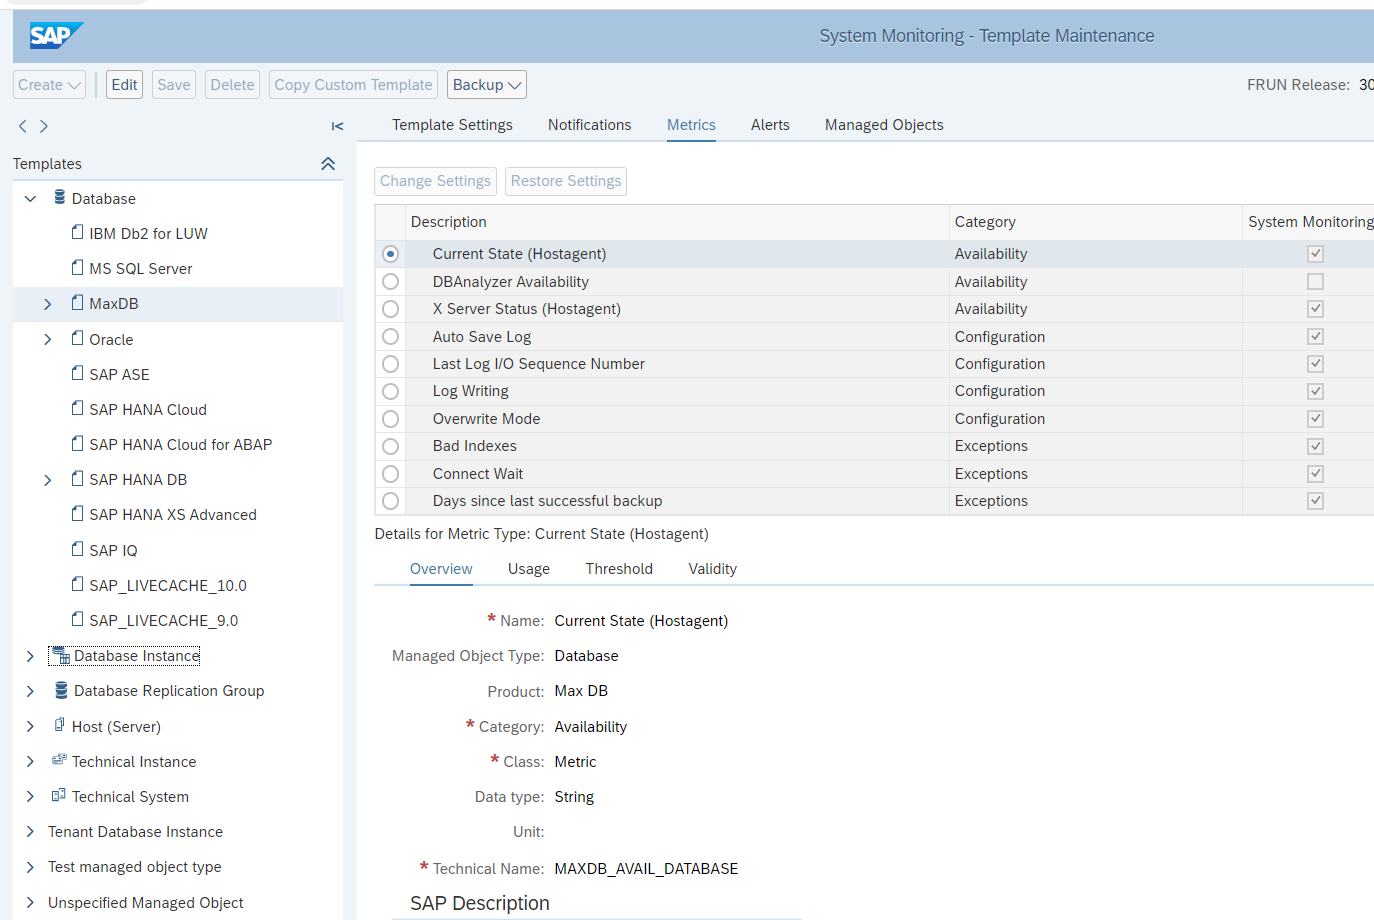
Database template for content server monitoring
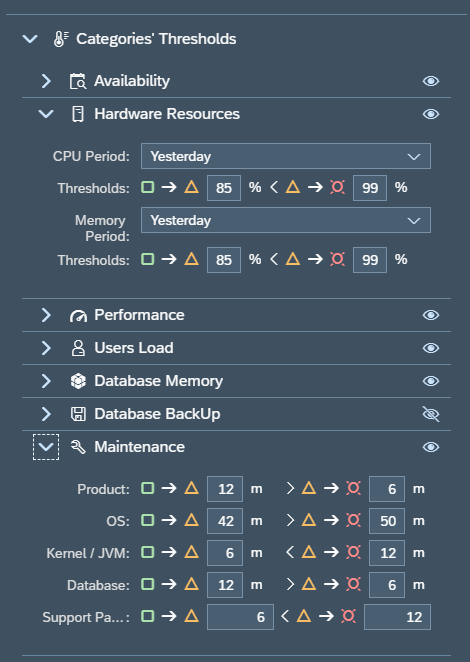
Important items of the database template:
- Database availability
- Database health checks
- Backup
In most installations it is chosen to install Content Server with the SAP MaxDB database (similar to LiveCache).
Relevant OSS notes for content server monitoring
ECC and S4HANA application monitoring
ECC and S4HANA systems are at the core of each SAP landscape, and most vital to the business.
When monitoring a productive system, you will need to finetune the monitoring templates for:
- ABAP 7.10 and higher Application template, for the ABAP application
- ABAP 7.10 and higher Technical instance template, for the ABAP application servers
- System host template
- Database template
ABAP application template
Make sure you cover in the ABAP application template the following items:
Availability:
- Message server HTTP logon
- System logon check
- RFC logon check
- License status
- Certificates expiry
- Update status
Performance and system health:
- Critical number ranges
- Enqueue lock % filled
- SICK detection
- Dumps last hour
- Update errors last hour
- Cancelled jobs last hour
- Long running work processes and jobs (see blog)
Security:
- Global changeability should be that the system is closed
- Locking of critical users like SAP* and DDIC (see blog)
Fine tune the metrics so you are alerted on situation where the system is having issues.
ABAP application server template
Make sure you cover in the ABAP application server template the following items:
Availability:
- Local RFC logon test
- Local HTTP logon test
- Local Logon test
- Message server disconnects (see blog)
Application server performance and health:
- Amount of critical SM21 messages
- No more free work processes (see blog)
- Update response times
You can consider to setup extra custom metrics for the application servers:
- Checking specific SM21 system log messages: errors in table locking of table TBTCO
- Checking for specific logon group to be active and working
- Detecting missing hardware ID
- Detecting OS signal
- Detecting PRIV modes
- Detecting resource exhaustion
- Detecting specific ABAP short dumps
System host template
For system host the regular CPU, memory, disc template is sufficient. Finetune the thresholds to your comfort level.
Database template
Important items of the database template:
- Database availability
- Database health checks
- Backup
Functions monitoring
Next to the availability and performance mentioned above, check also for monitoring certain functions:
- Interface monitoring: idoc, ODATA, RFC, qRFC, web services
- Batch job monitoring
- Security monitoring
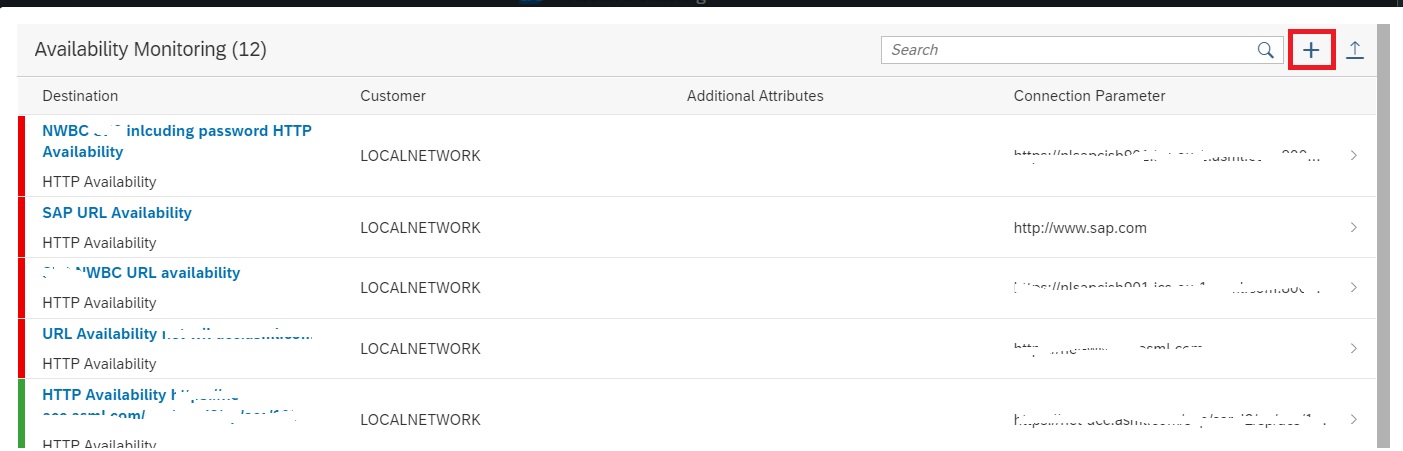
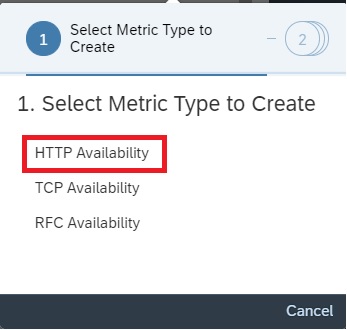
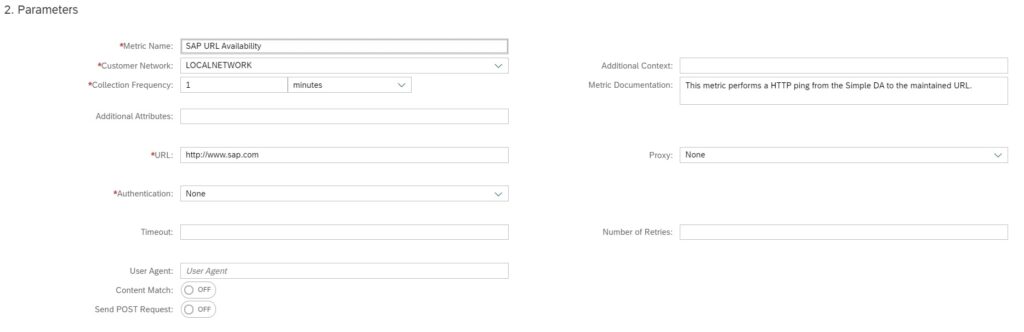
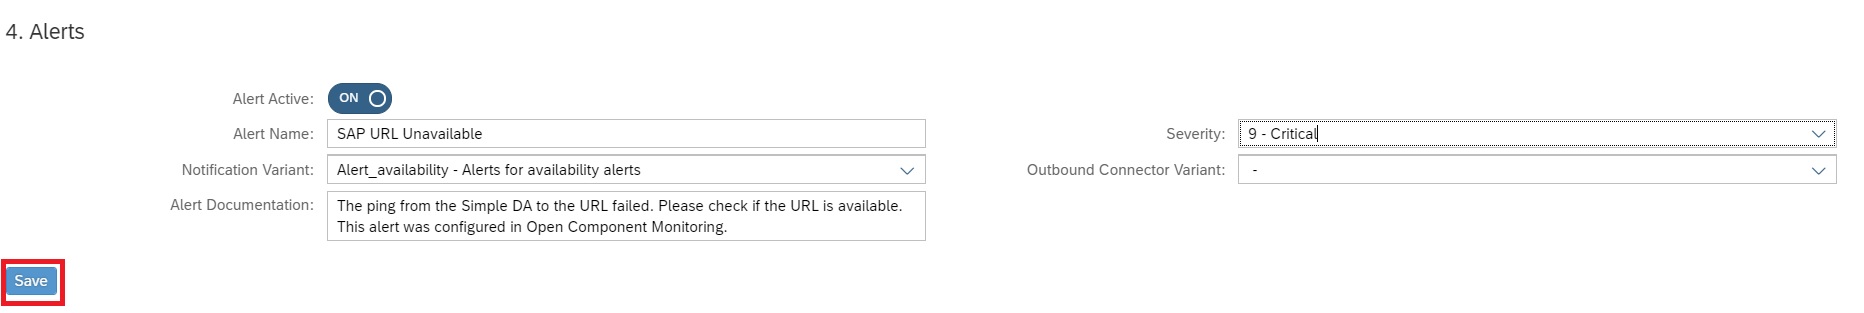
- URL availability monitoring
EWM (enterprise warehouse management) application monitoring
EWM systems are at the often used as stand alone systems that make sure logistics and warehousing can keep running at high availability. If the connected ECC or S4HANA system is down, EWM can continue to support logistics operations.
EWM can be older version based on SCM/BI system core. Newer EWM systems are using S4HANA with EWM activated as standalone.
Extra in an EWM system are the use of qRFC and the CIF (Core interface). And many EWM systems have users that interact with the system via ITS GUI based handheld scanners.
CIF monitoring
The CIF is the core interface between SCM and ECC system. The interface typically uses RFC and qRFC. And it is working both ways.
Setup for the CIF specific RFC’s and qRFC’s the monitoring:
Handheld scanners
Many EWM systems are having interaction with scanners via the ITS server. Basically this is a small web page on a scanning device.
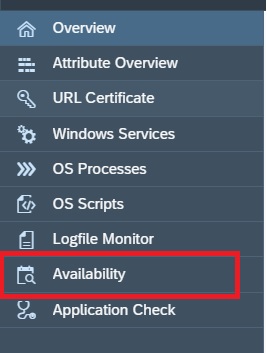
Make sure you monitor the availability of the URL’s that the scanners are using. More on URL monitoring can be found in this blog.
GTS (global trade system) application monitoring
GTS systems are at the not frequent in use. When in use they do play a vital role in import and export business scenario’s when good are crossing borders.
Since a GTS system is normally installed, and often no to little maintenance and software changes are performed on the system. Also basis teams tend not to look at it too often, since it normally runs stable.
In case of non-availability of GTS, ECC scenario’s linked to GTS might fail and can causes severe business disruptions.
For this reason it is important to set up monitoring in FRUN for your GTS system and also configure mail alerts in case of issues. They will not happen too often, but when they happen you can act fast. This will also save the basis team spending a lot of time on checking GTS system for log (most cases, the checks are good).
When monitoring a productive system, you will need to finetune the monitoring templates for:
- ABAP 7.10 and higher Application template, for the ABAP application
- ABAP 7.10 and higher Technical instance template, for the ABAP application servers
- System host template
- Database template
The next step is to set up interface monitoring for RFC from the ECC system towards the GTS system.
Netweaver Gateway Fiori hub system application monitoring
Netweaver Gateway systems are used to host Fiori applications.
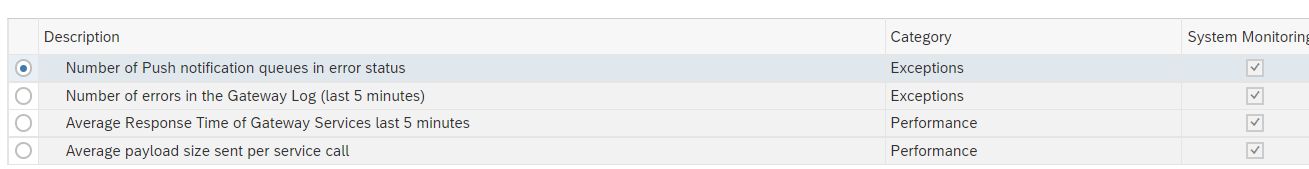
Netweaver gateway template
For Netweaver gateway, also assign and fine tune the Gateway template:
The important custom check on URL availability is best to setup as well: read this blog for instructions.
Consider to setup interface monitoring for RFC‘s from End User to Gateway and Gateway to ECC backends.
SCM (supply chain management) application monitoring
SCM systems are at the often used logistics optimization systems. They are mainly used in combination with traditional ECC systems. They are less needed in combination with S4HANA systems (or you can use the embedded SCM of HANA).
The core of an SCM system is a BI system. Many data is using similar extractors and process chains as a BI system. Hence follow the tuning needed for a BI system.
Extra in an SCM system are the LiveCache and the CIF (Core interface).
The basic monitoring of an SCM system is the same as for any ABAP based system.
For an SCM system some numbers are typically higher than on an ECC or S4HANA system. Response times of 1.5 seconds would indicate horrible performance on ECC, but are normal on an SCM system.
LiveCache monitoring
LiveCache is normally running on a MaxDB database.
So it is important to activate, assign and finetune the metrics for the MaxDB database:
Focus on:
- Availability
- Backup
- Performance
Next to the database, you also need to activate, assign and finetune the LiveCache specific application template:
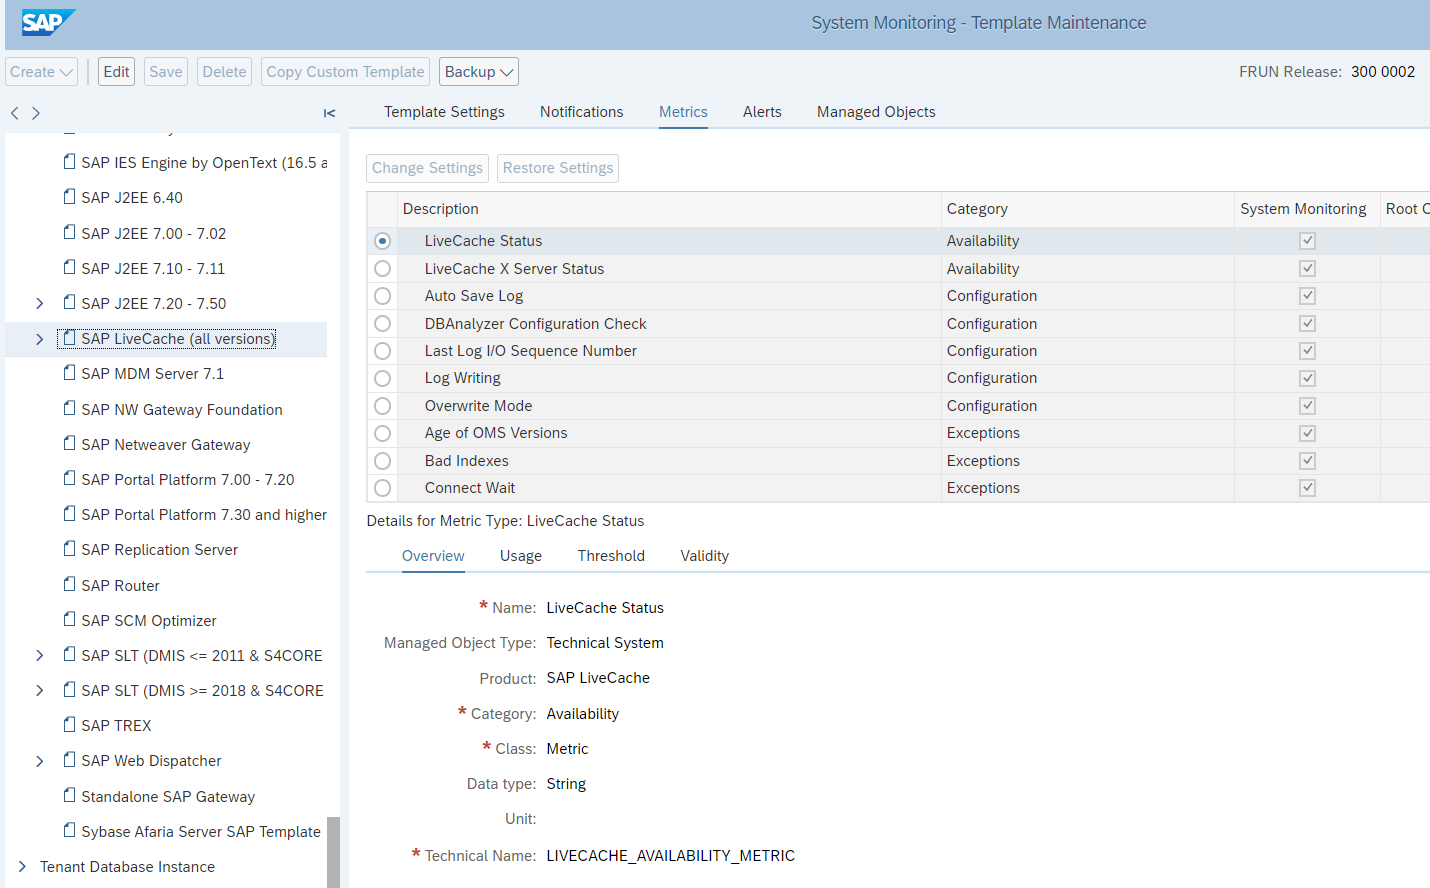
This template contains the primary elements to monitor for the LiveCache functions like:
- Availability of LiveCache as a function
- Structure check for LiveCache
- Memory issues for LiveCache specifically
Fine tune the metrics so you are alerted on situation where the system is having issues.
CIF monitoring
The CIF is the core interface between SCM and ECC system. The interface typically uses RFC and qRFC. And it is working both ways.
Setup for the CIF specific RFC’s and qRFC’s the monitoring:
Process chain monitoring
SCM uses process chains. To monitor process chains, read this dedicated blog.
SLT system application monitoring
SLT systems are mainly used to replicate data from source systems like ECC and S4HANA towards target systems like Enterprise HANA, HANA cloud and other data pool systems.
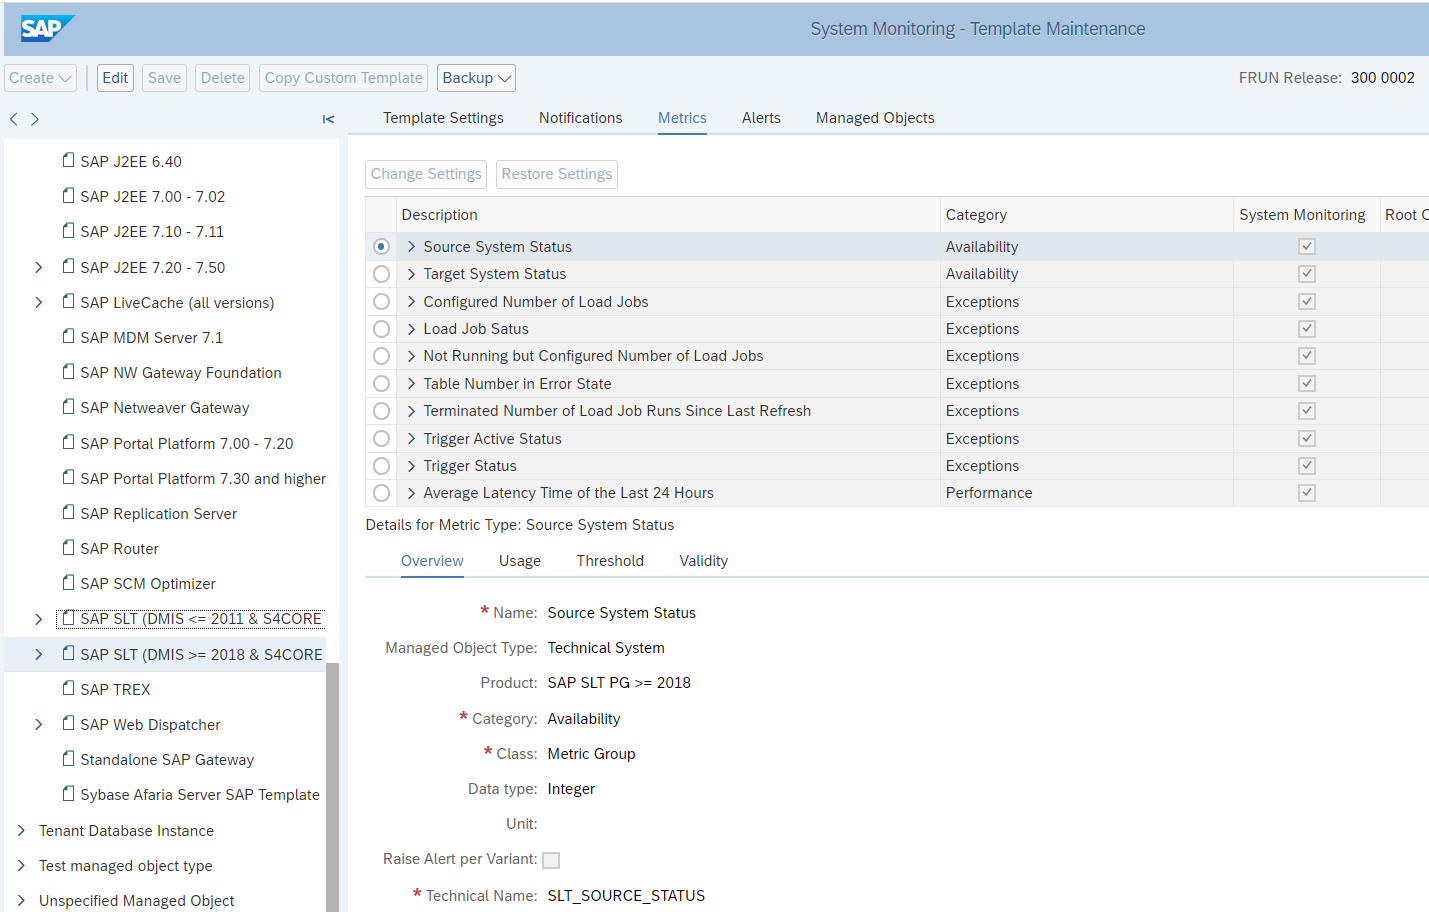
SLT DMIS template for SLT system
For SLT systems, apply the SLT DMIS template:
In the SLT system itself, make sure job /1LT/IUC_HEALTH_C with program R_DMC_HC_RUN_CHECKS runs. This will collect data that is needed for SLT itself, but which is also re-used by SAP Focused Run.
OSS notes to apply and check:
- 2850664 – Display health check results log not showing up – SLT
- 3116187 – SLT Central System (DMIS 2011 SP11-21): Health Check Job not scheduled
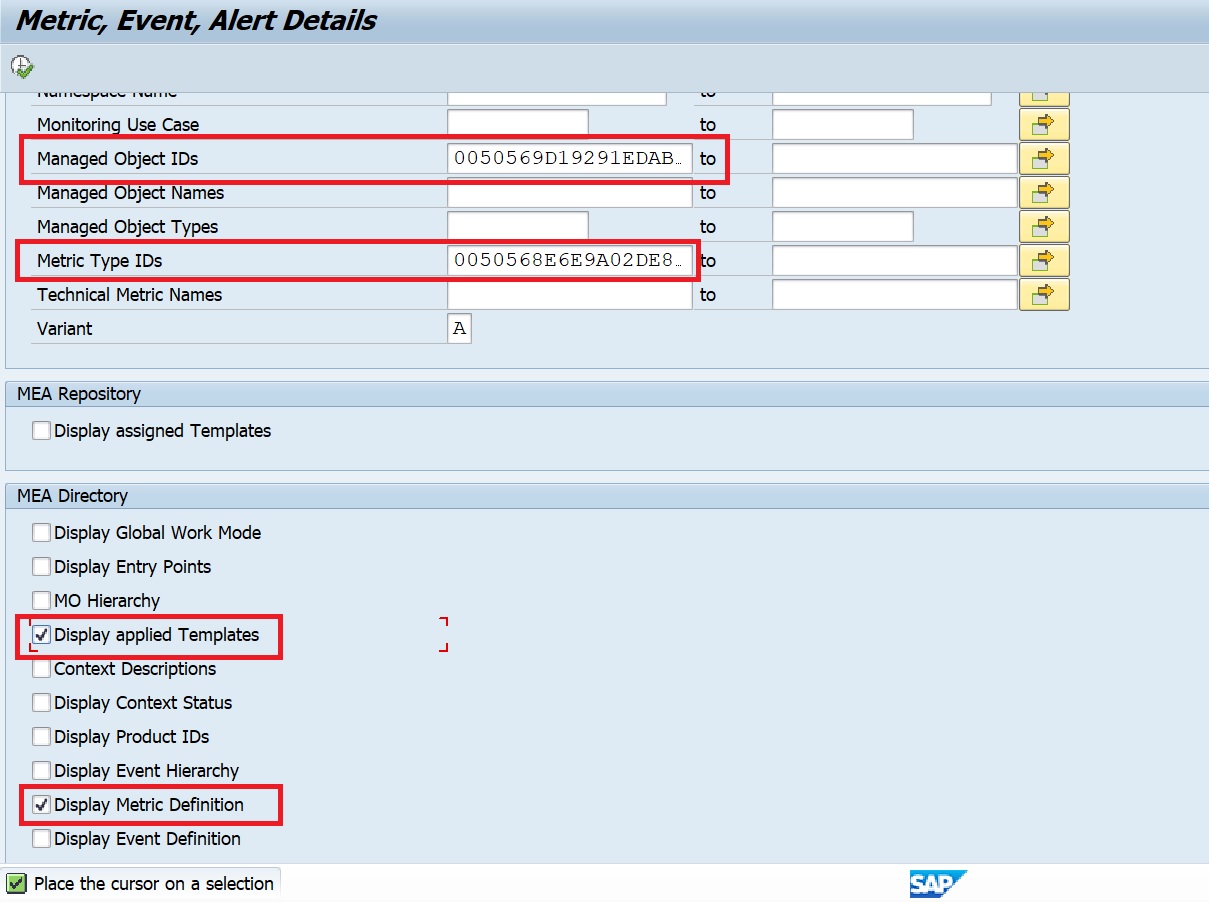
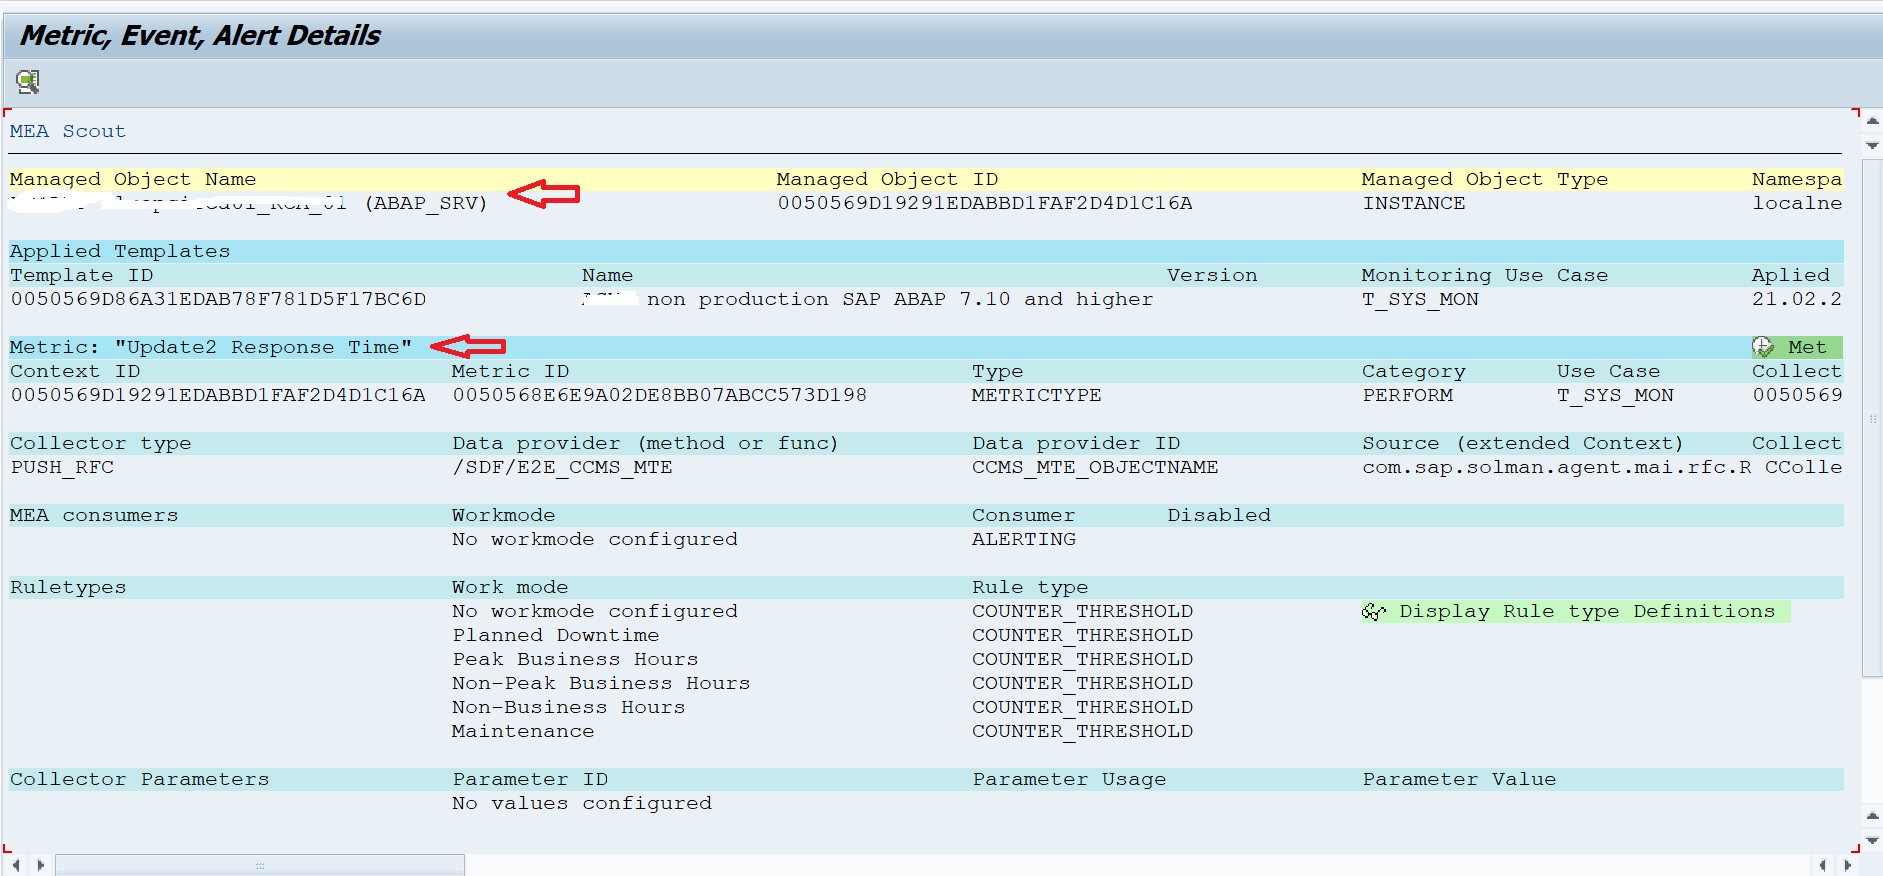
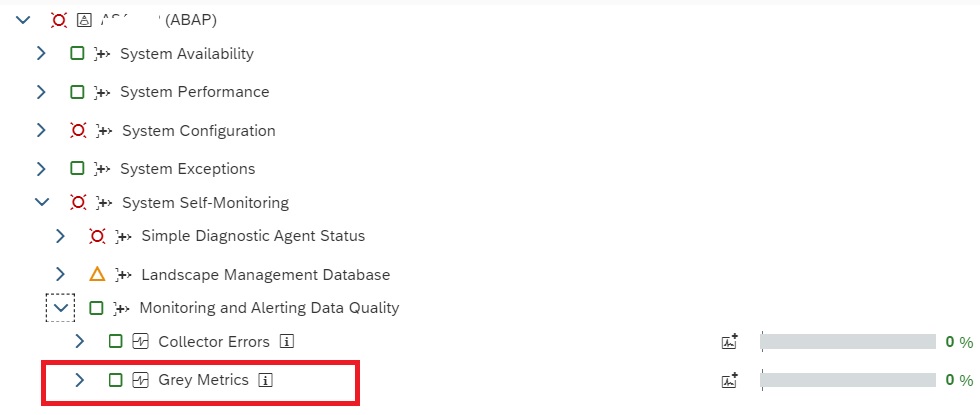
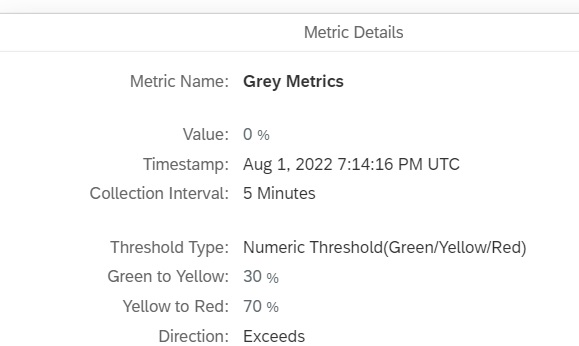
- 3228773 – SLT Metric in Blue/Grey status in a Focused Run system
- 3299955 – SLT (DMIS 2018 / S/4HANA) Central System: Health Check is not scheduled or stuck
Anyhow you should make sure to regularly apply the notes for the DMIS component. See this blog.
SLT DMIS dummy template backend system
For SLT to work, the DMIS component is installed in both the SLT system and the backend system. For the backend system SLT component, Focused Run will pick up the template as well. But this will not make any sense in monitoring, since it is the source system and not the SLT system.
For this reason, set up a dummy empty template with every monitoring item disabled:
Assign this dummy template to your backend system.
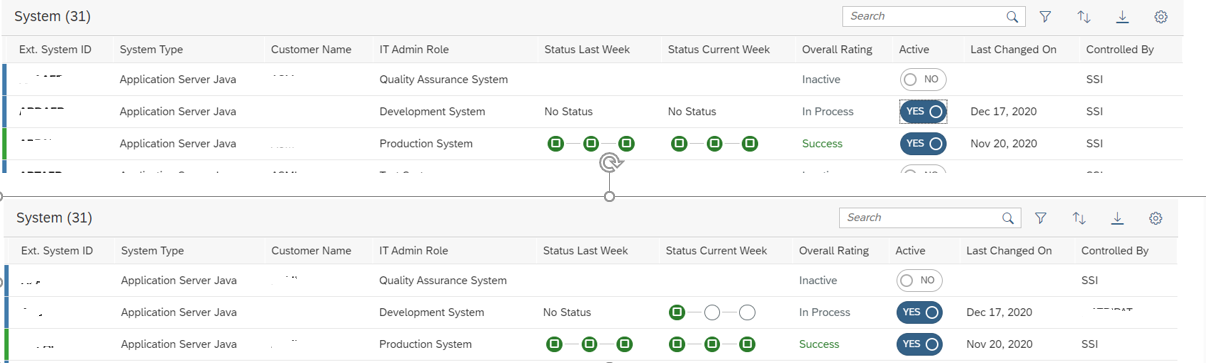
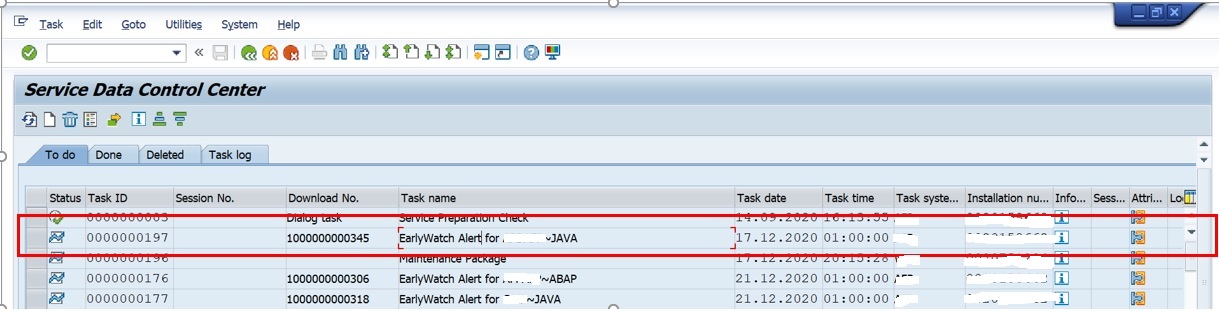
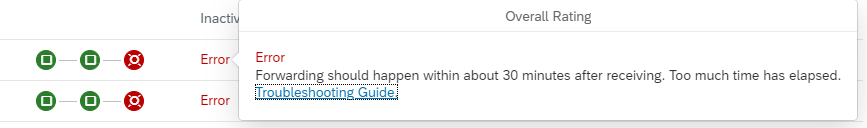
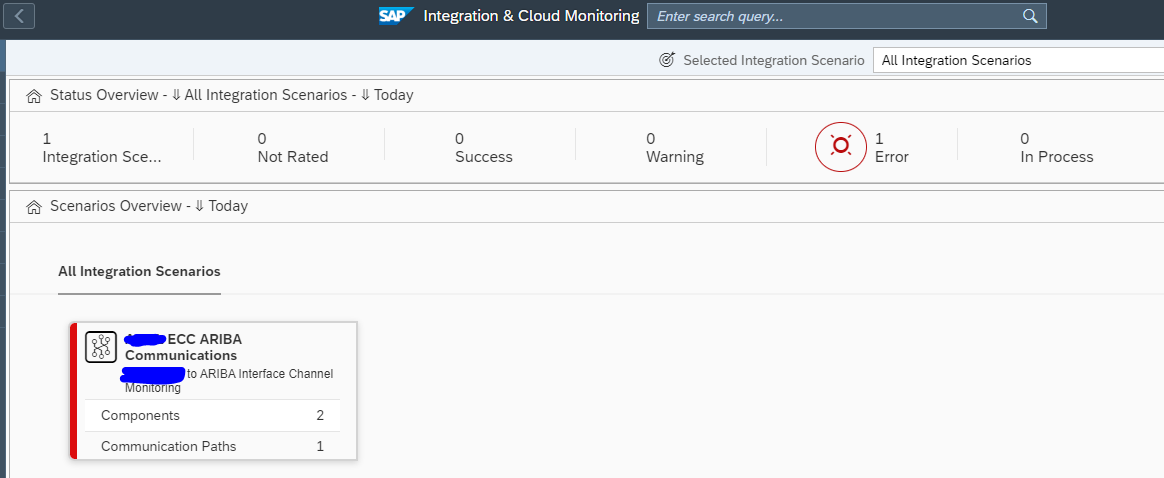
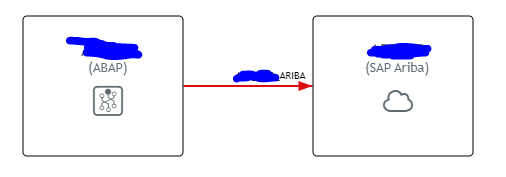
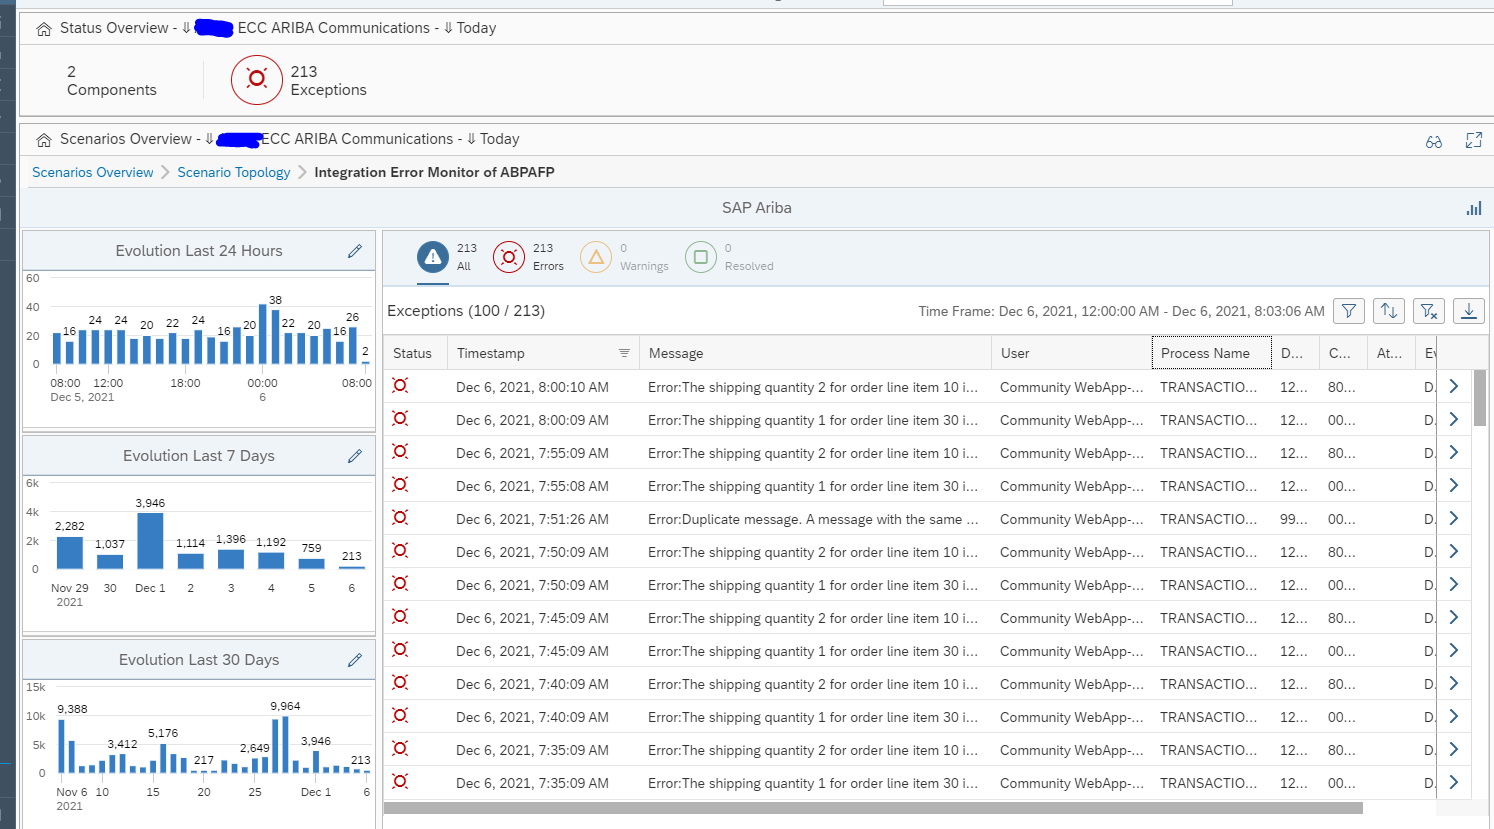
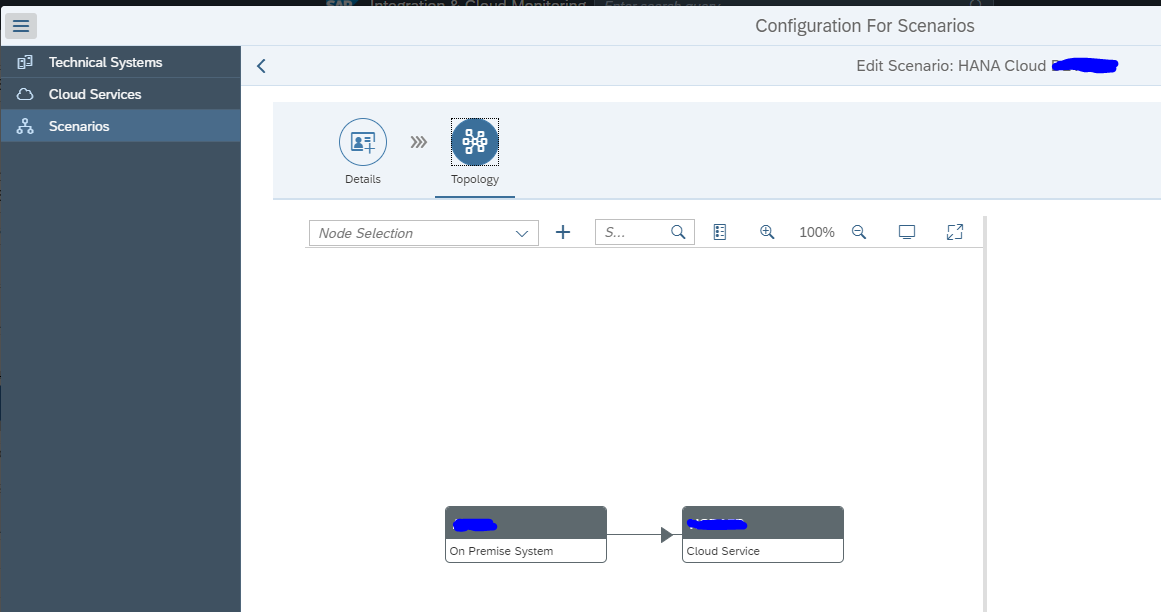
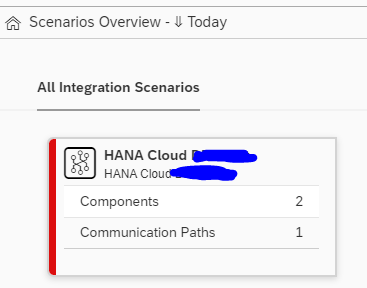
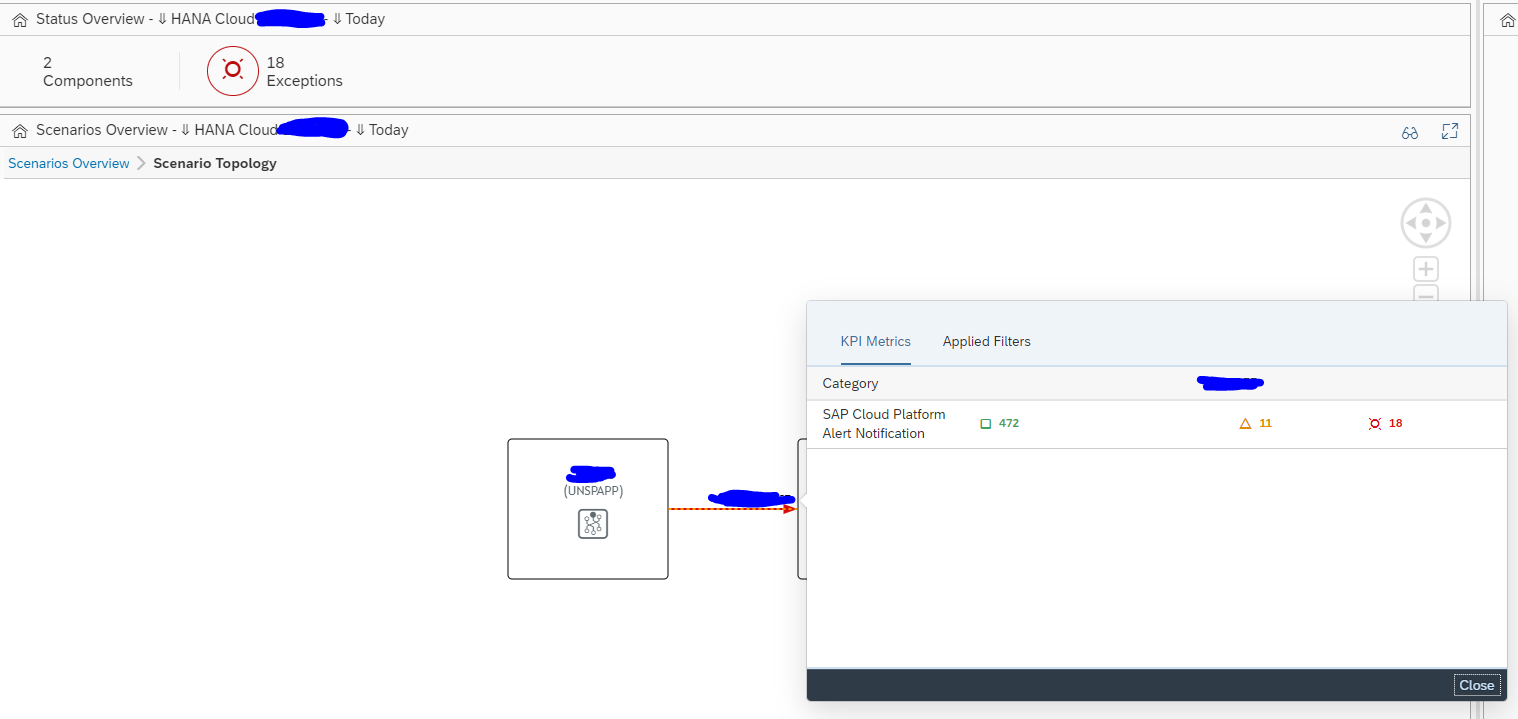
SLT integration monitoring
Set up the SLT integration monitoring to monitoring communication.
Web dispatcher application monitoring
Standalone web dispatchers are used to load balance web traffic towards ABAP and/or JAVA systems. Common use case is to have web dispatcher for a large Netweaver Gateway FIORI installation.
Monitoring productive cloud web dispatchers
Monitoring of web dispatchers focuses on availability, connectivity and performance.
The web dispatcher template contains most needed elements out of the box:
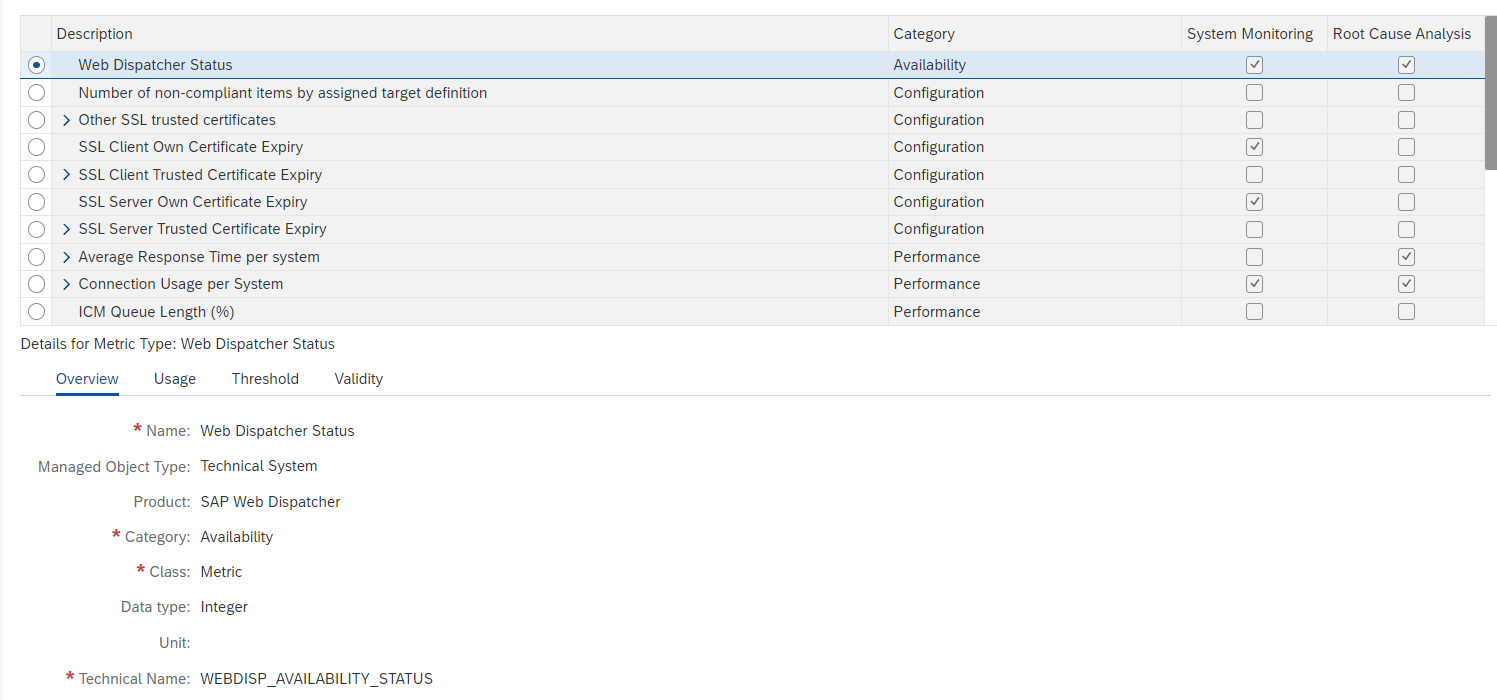
Issues with performance are often caused by limitations set in the web dispatcher configuration. Keep these settings active.
You might want to add specific custom metric to monitor the most important URL for your web dispatcher. Read more in this specific blog.
Next to this setup the normal host monitoring to make sure the file system and CPU of the web dispatcher are not filling up and causing availability issues for the web dispatcher function.
Monitoring non-productive web dispatcher systems
For monitoring non-productive web dispatcher systems, it is normally sufficient to restrict to host and availability monitoring.
Relevant OSS notes for web dispatcher monitoring
3373764 – Issue with Content Server on Web dispatcher templates
LMDB OSS notes
3104059 – Troubleshooting ABAP Data supplier populating LMDB
<< This blog was originally posted on SAP Focused Run Guru by Frank Umans. Repost done with permission. >>