SAP Focused Run alert management outbound integration to ServiceNow

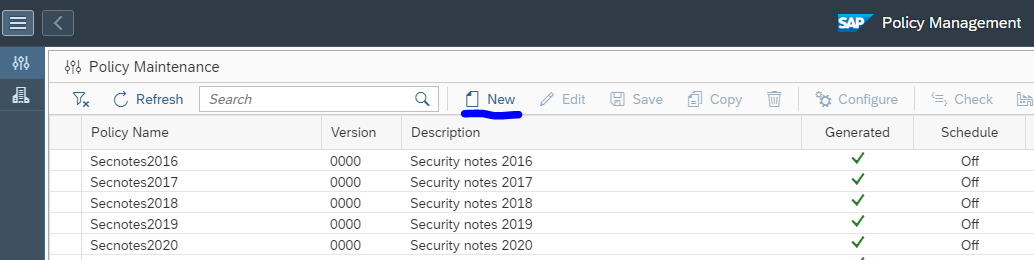
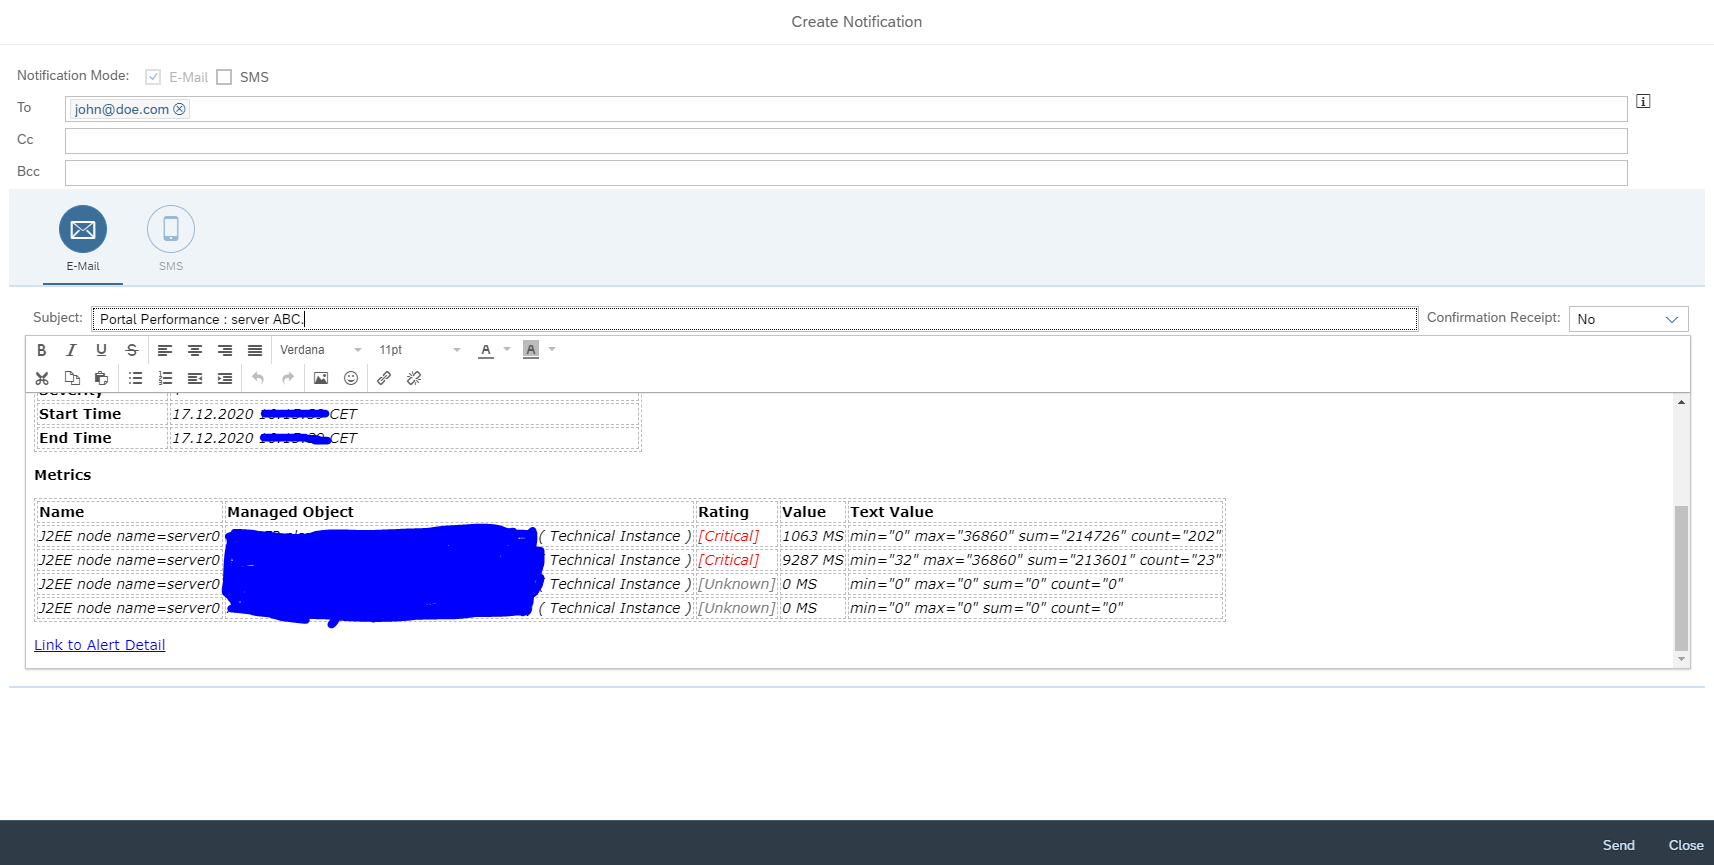
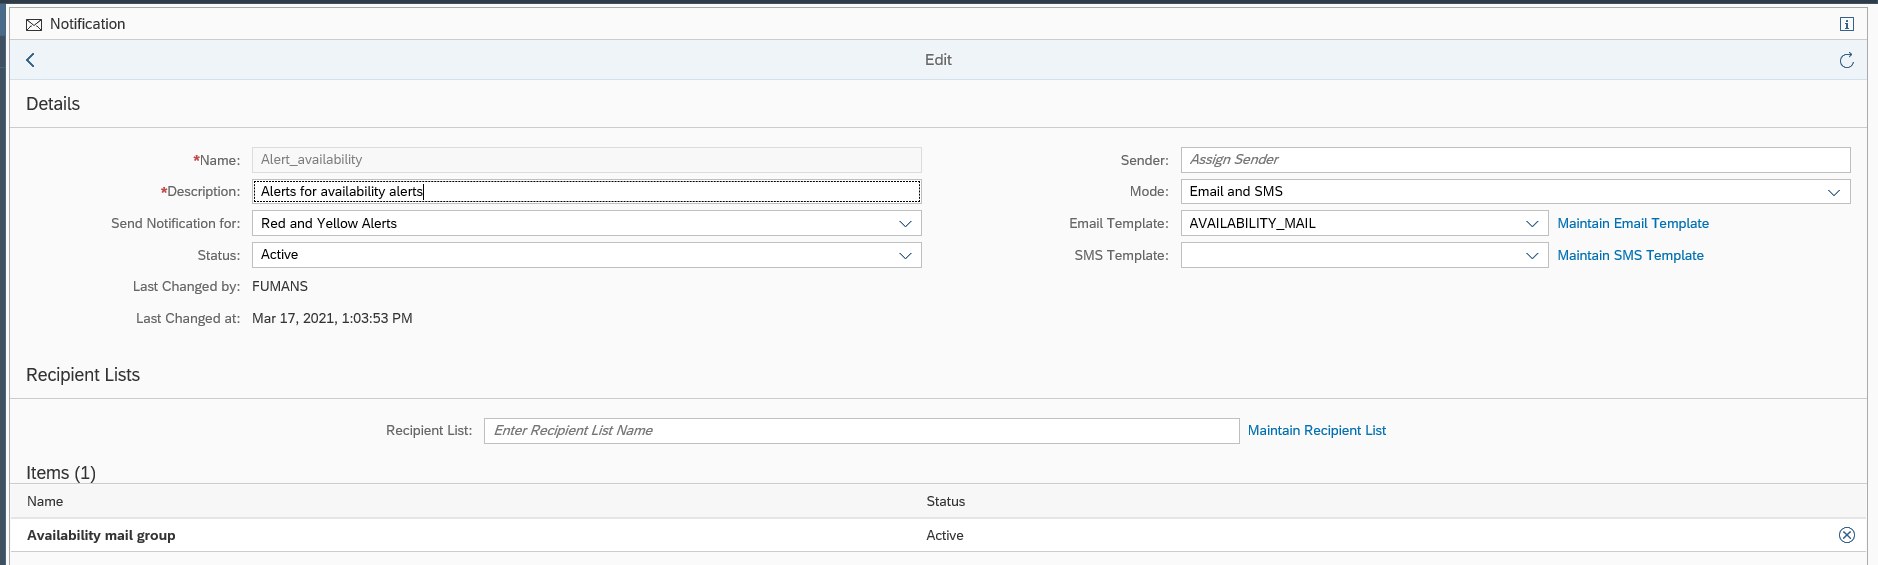
SAP Focused Run alert management function can send out mails to alert to mail addresses (see this blog).

SAP Focused Run can also call an outbound integration to a ITIL tool like ServiceNow. This can help to speed up incident creation.

It needs implementation on ABAP level. The coding is given at the end of the blog.

Questions that will be answered in this blog are:

  • How does the high level integration between SAP Focused Run and ServiceNow look like?
  • Where can I find information on the to-be-implemented ABAP BADI?
  • How can I send an alert directly to ServiceNow from the Alert management detailed page?
  • How can I automate in template settings to send an alert via outbound integration towards ServiceNow?
  • How do I connect from the ABAP stack towards the midserver?
  • Which BADI do I need to activate for the outbound integration?
  • How do I call the midserver connection from the BADI?
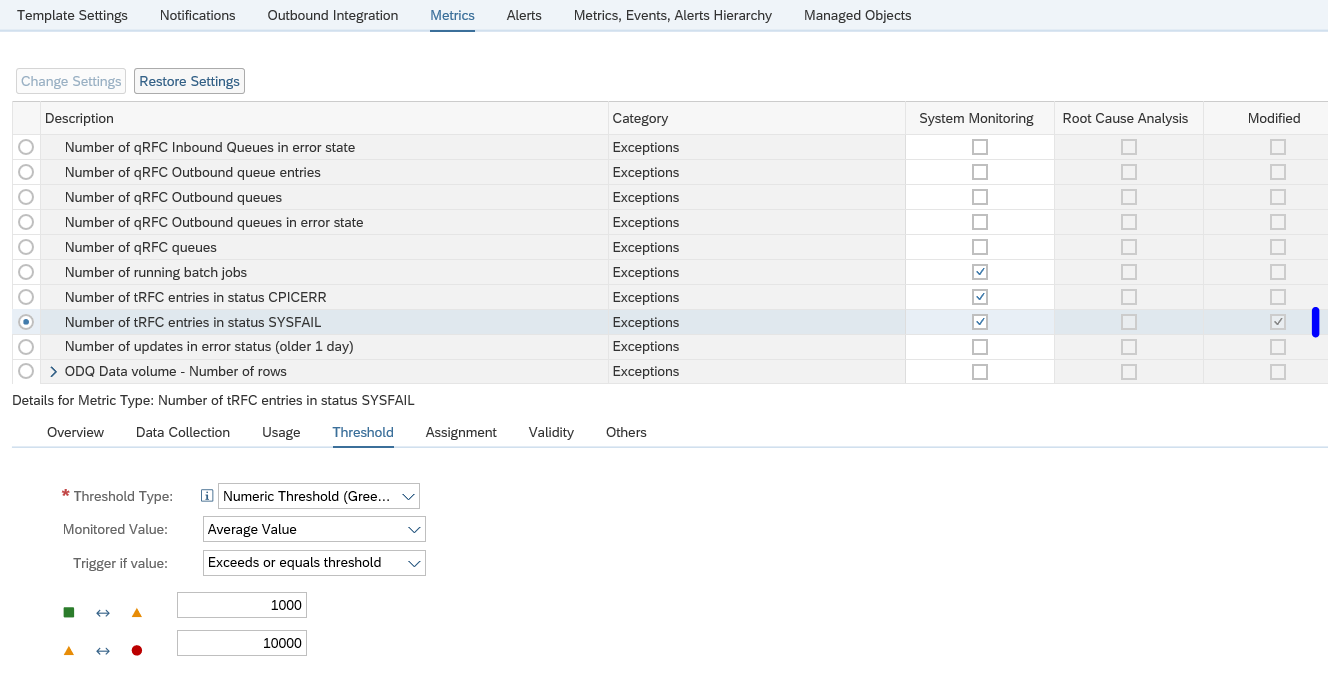
  • How do I deal with the differences in severity definition between ServiceNow and SAP Focused Run?
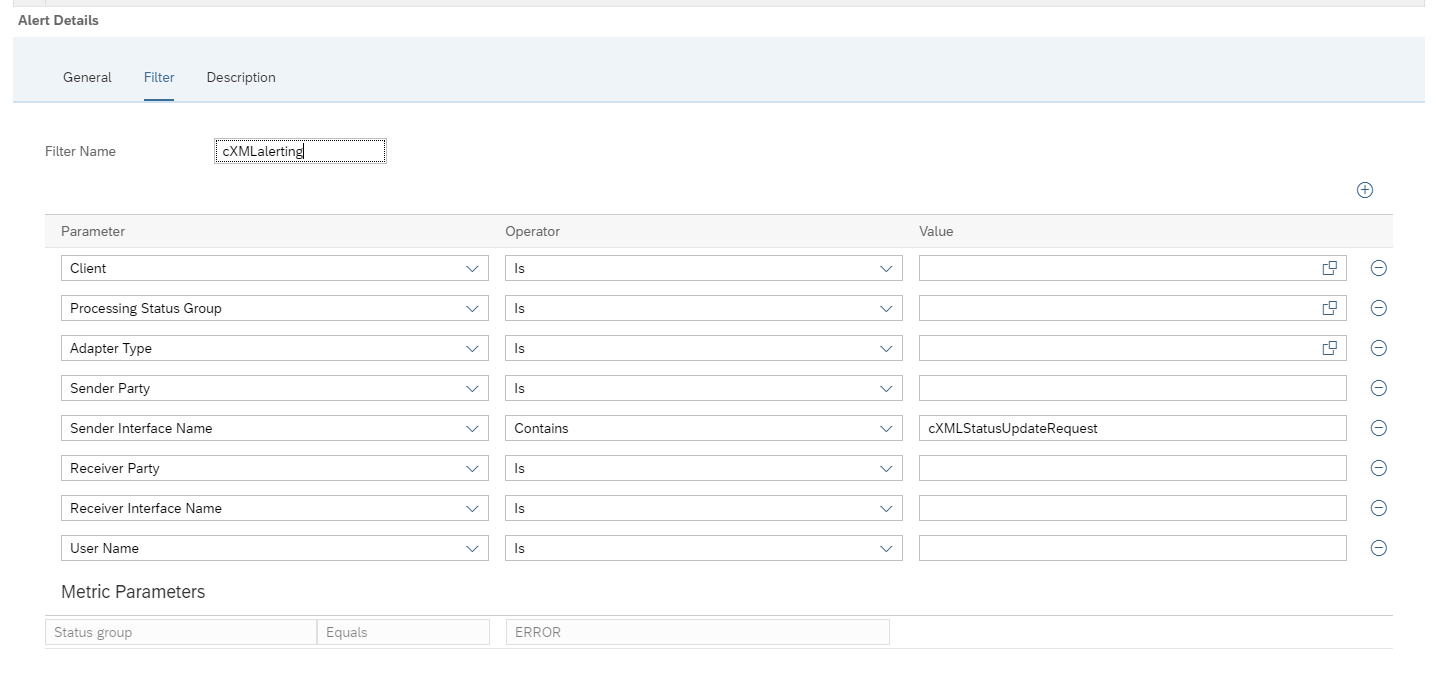
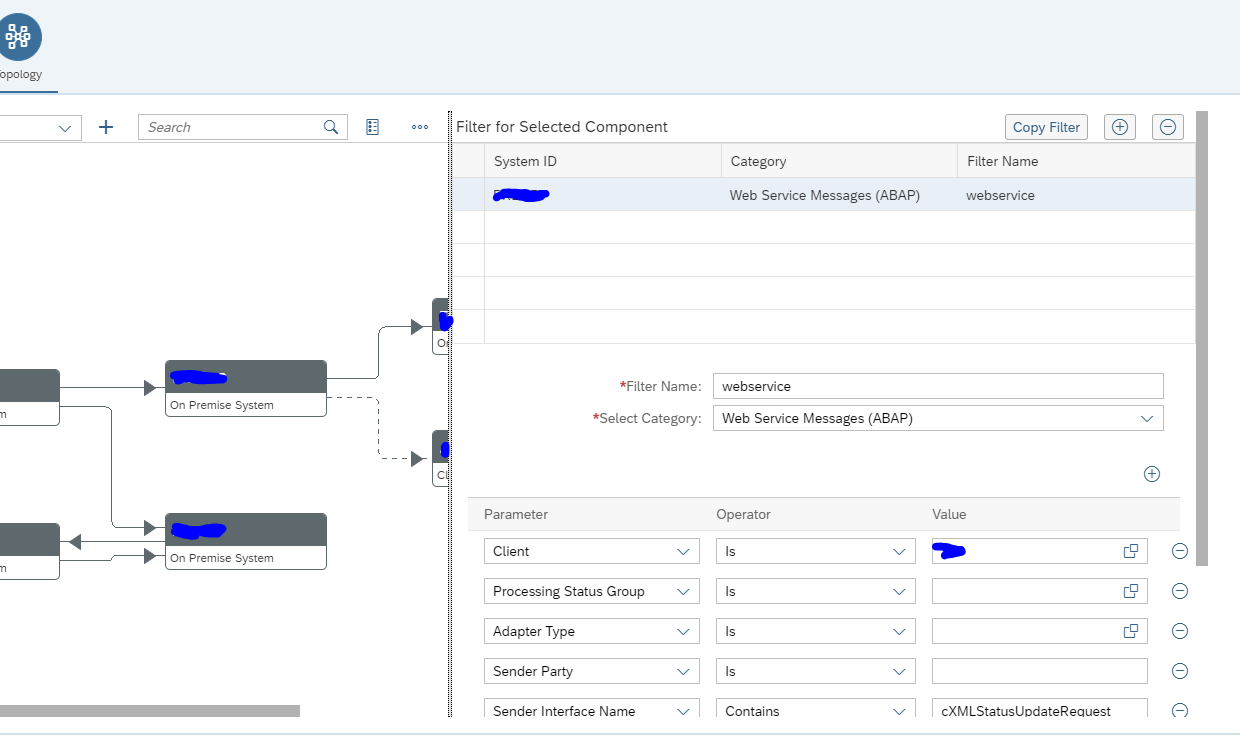
  • If I want to set up the connection via web services, what do I need to do?
  • How can I include application logging in such a way that I can monitor the calls and issues in SLG1?
  • Where can I find the ABAP code needed?

Setting up the integration

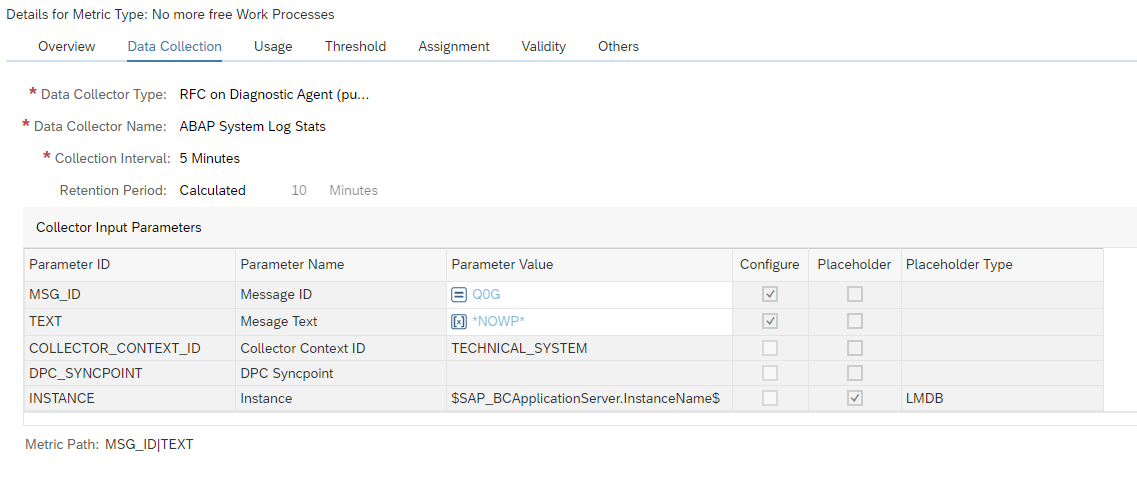
For setting up the integration to ServiceNow the AEM third party consumer connection BADI must be implemented. The full manual for the BADI itself can be found on the SAP Focused Run Expert portal.

The documents describes the BADI in generic way.

To call ServiceNow you have to use one of the following 2 integration methods:

  • Call webservice: in this case you import the WSDL from ServiceNow and generate the proxy and execute the SOAMANAGER settings to logon to ServiceNow. You need ABAP code in the BADI to call the proxy. See this blog for generic use of setting up webservice consumption in ABAP stack. Available webservices for ServiceNow can be found on the ServiceNow page.
  • Call the ServiceNow midserver: in this case you call a REST interface. In this case you need to setup a HTTP RFC connection to the midserver. ABAP code in the BADI is needed to make the REST call. See this blog for generic use of REST call in ABAP stack. REST API references from ServiceNow can be found on the ServiceNow page.

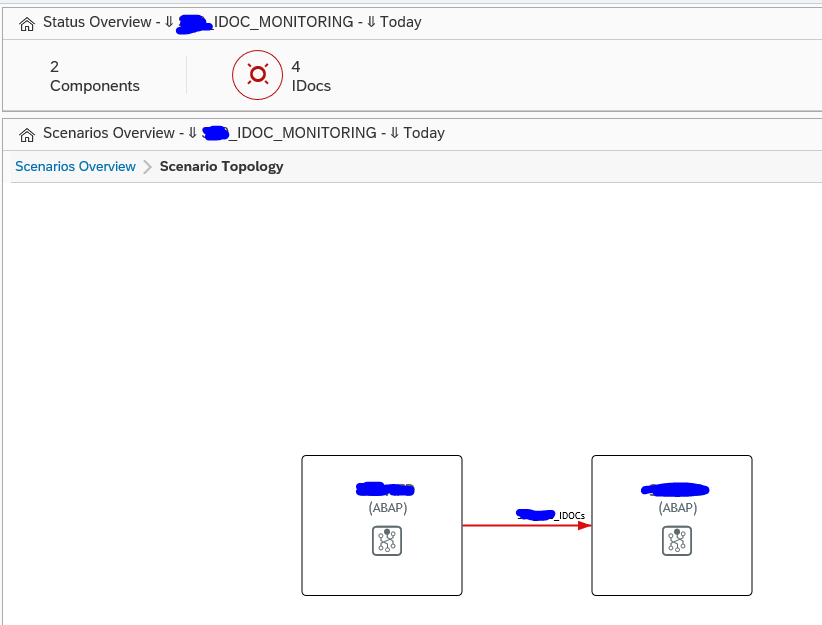
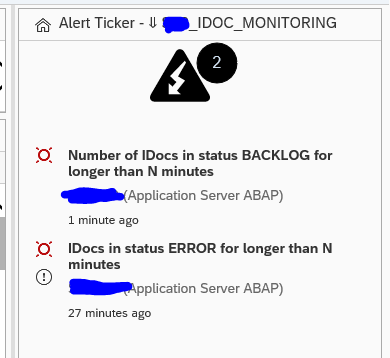
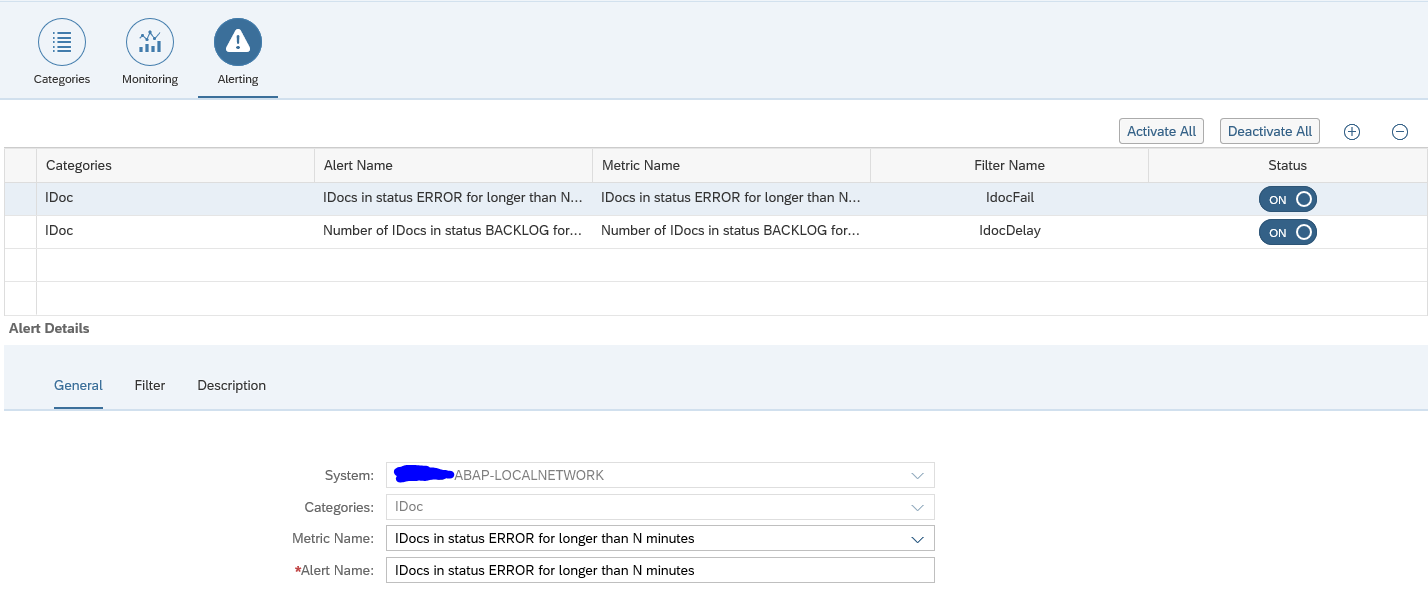
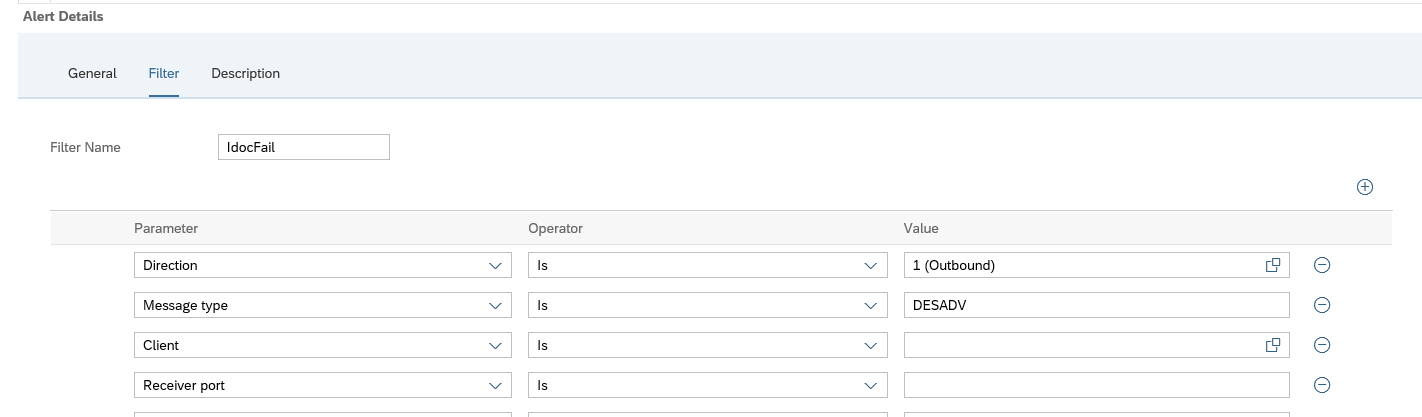
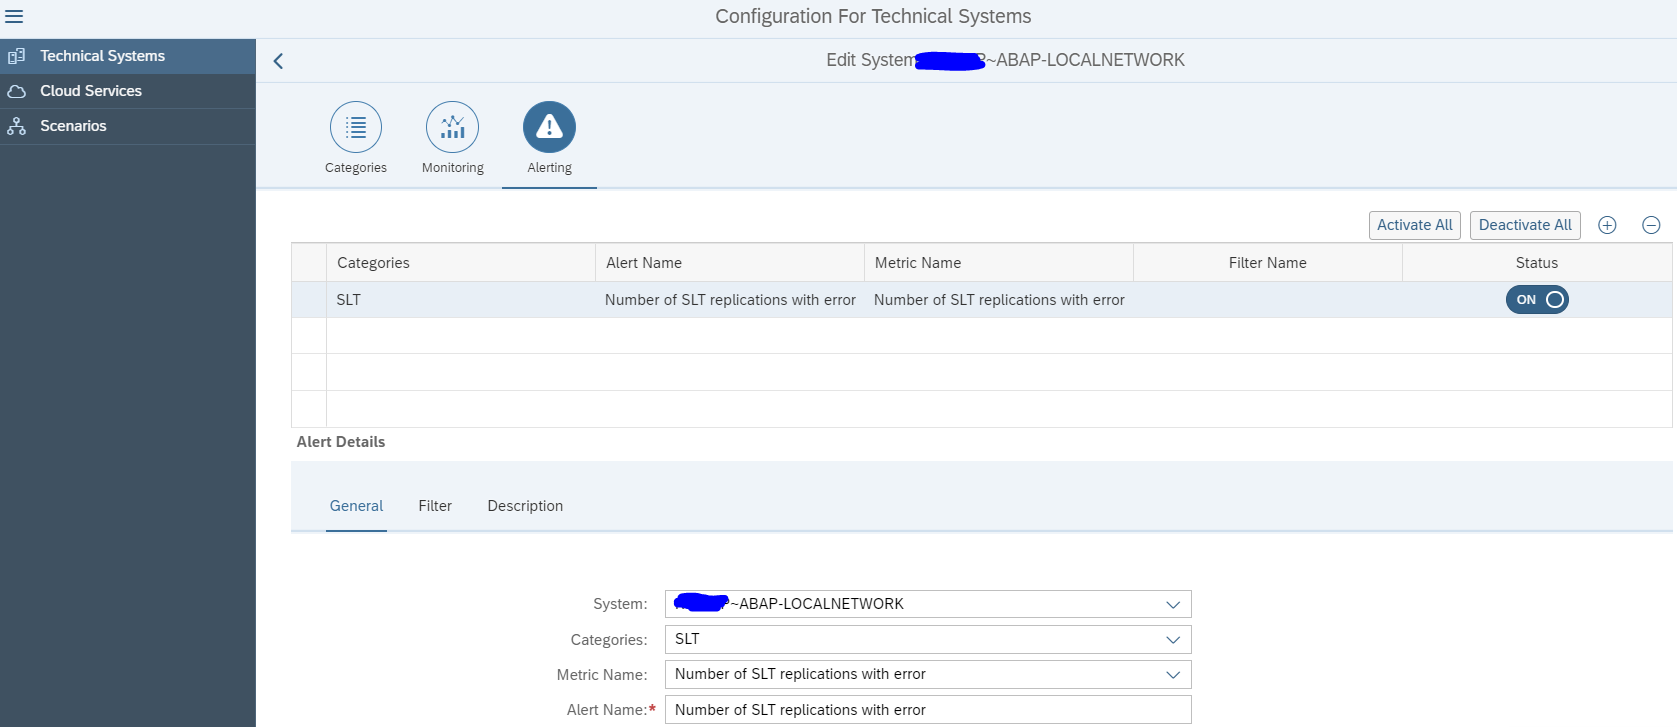
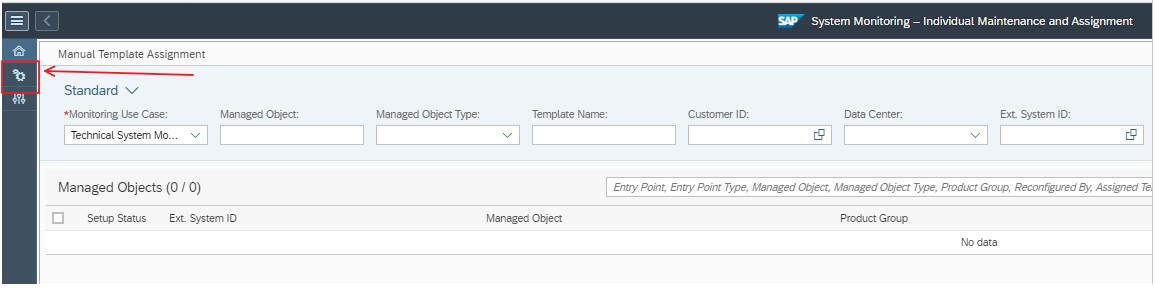
Alert trigger integration

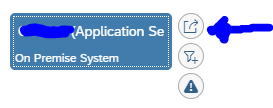
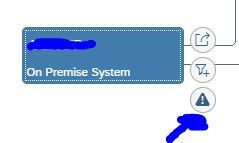
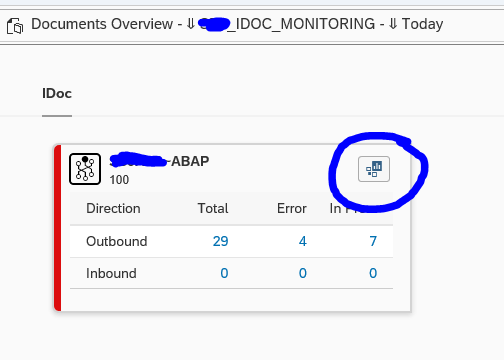
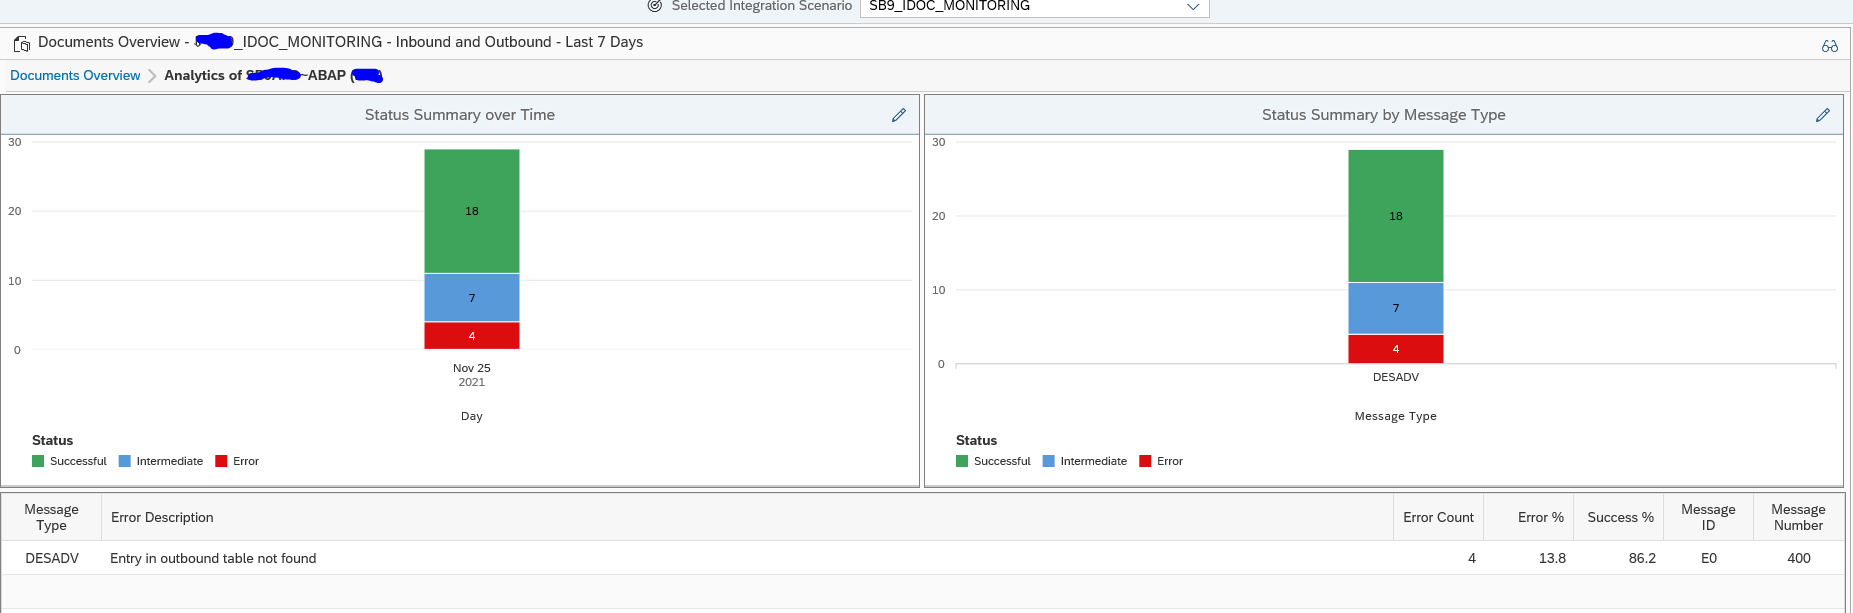
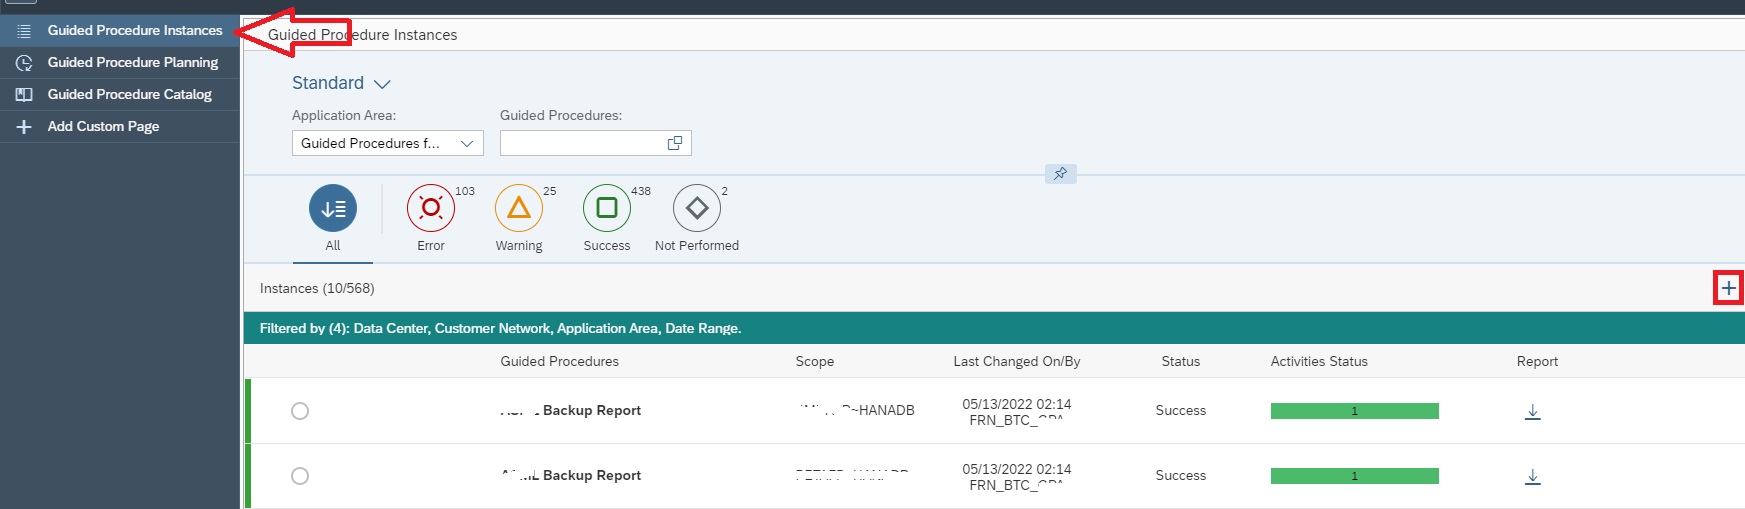
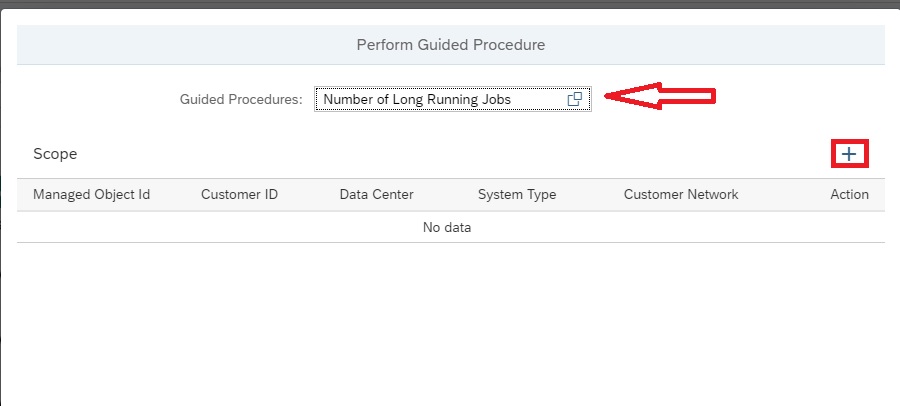
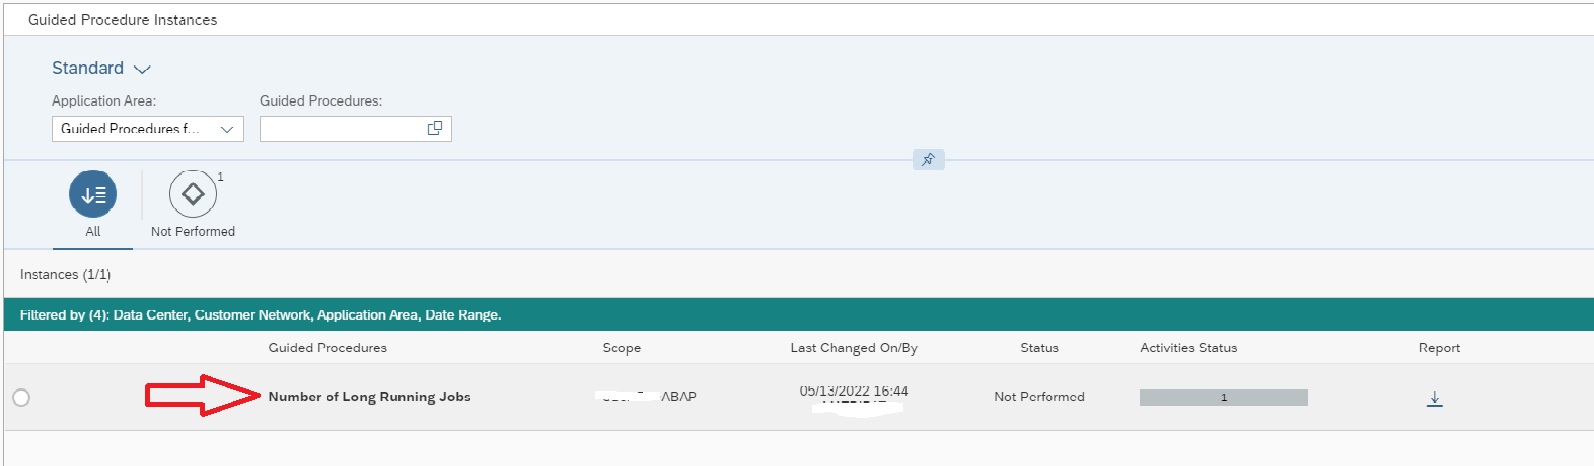
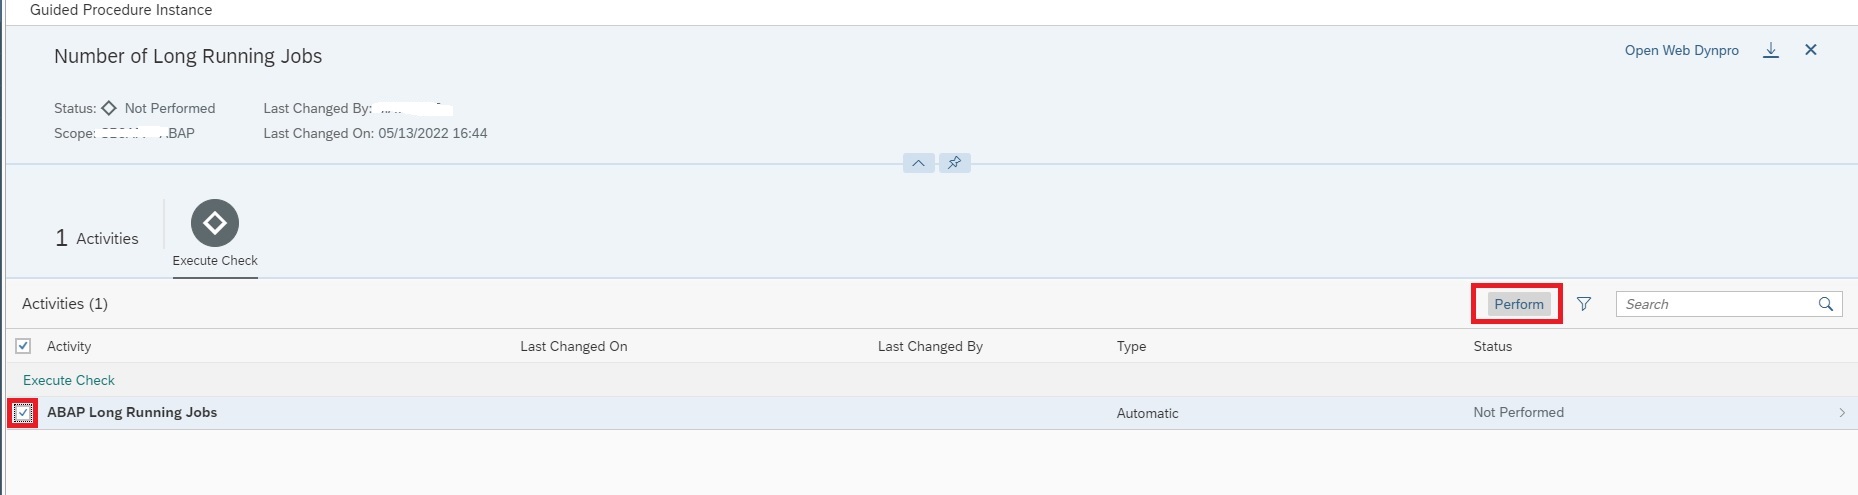
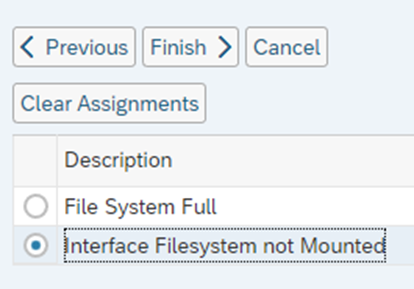
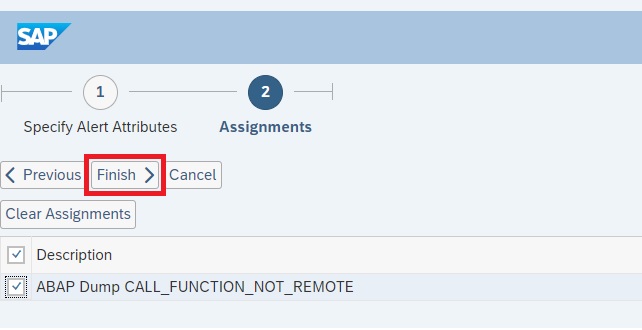
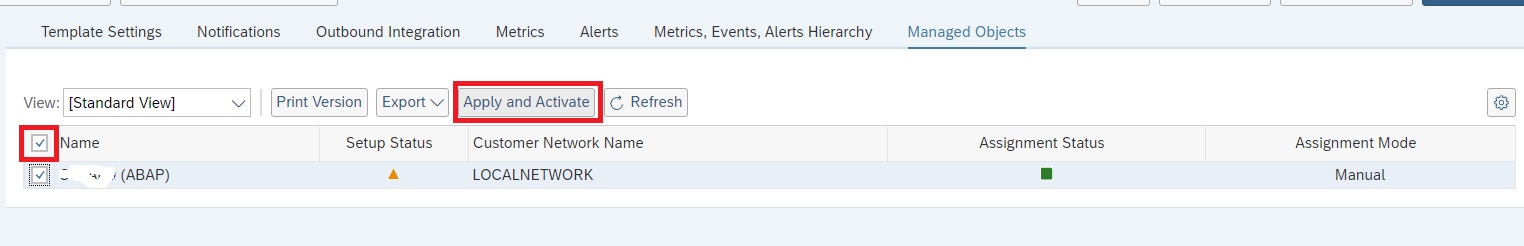
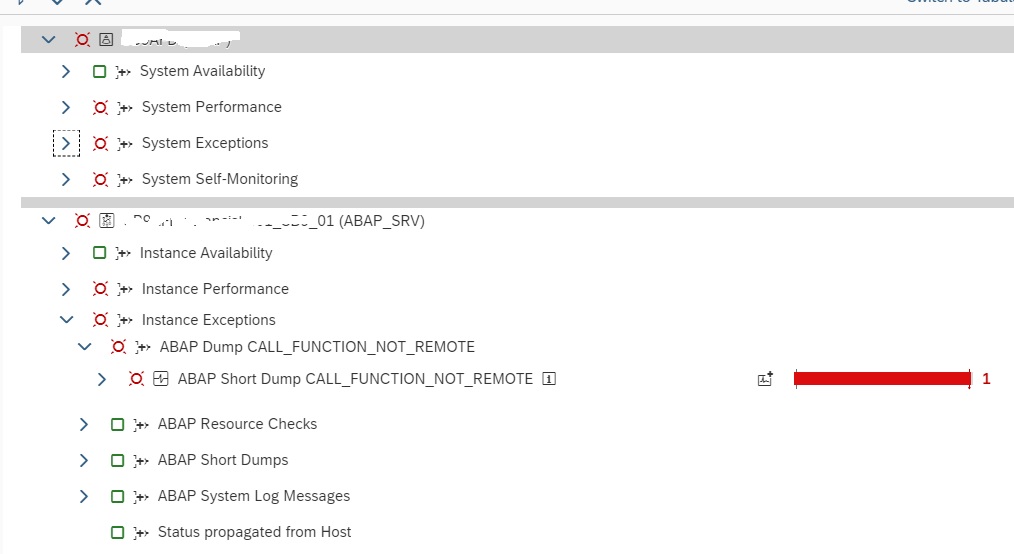
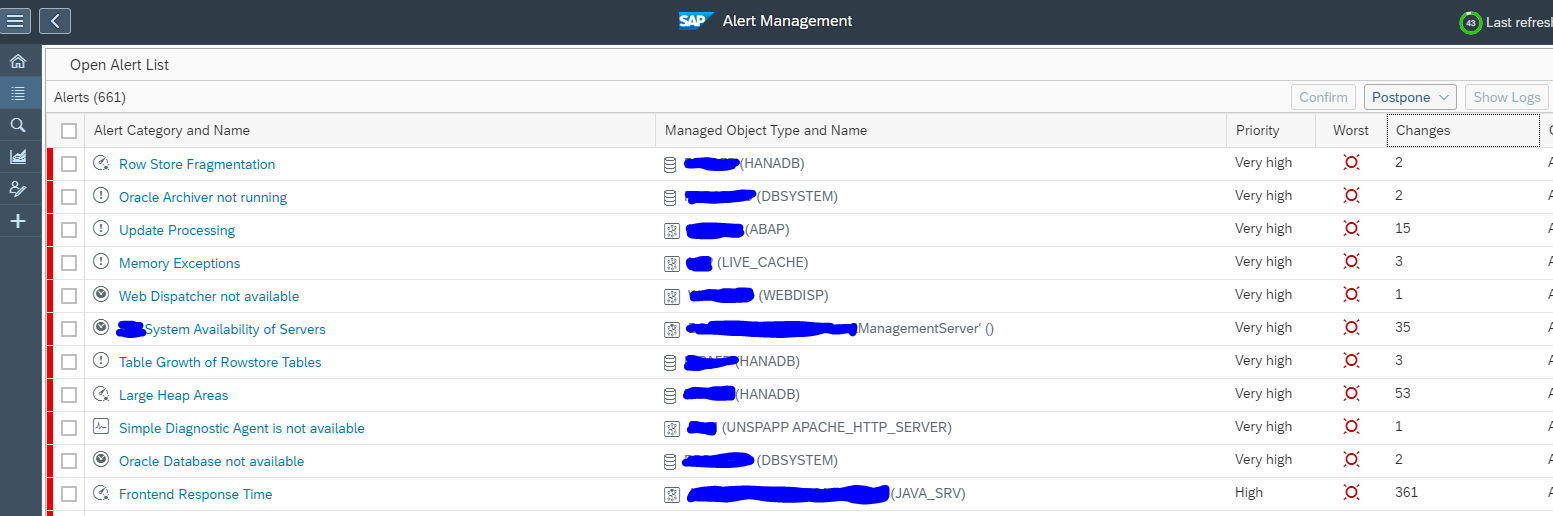
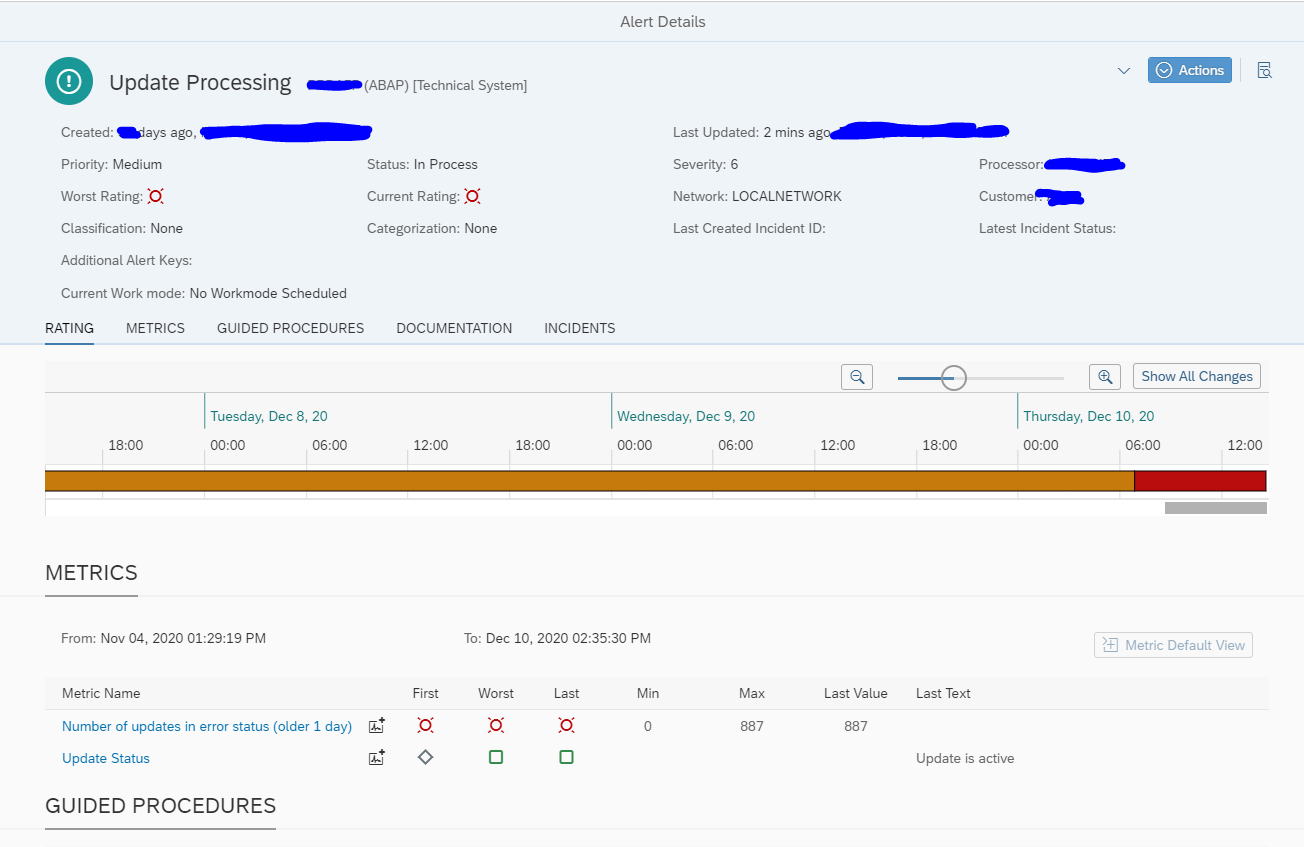
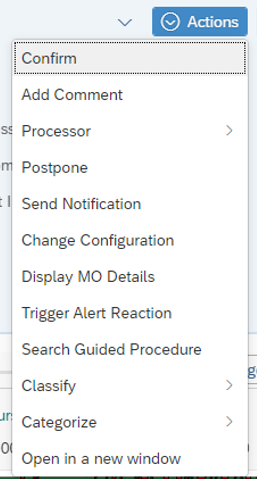
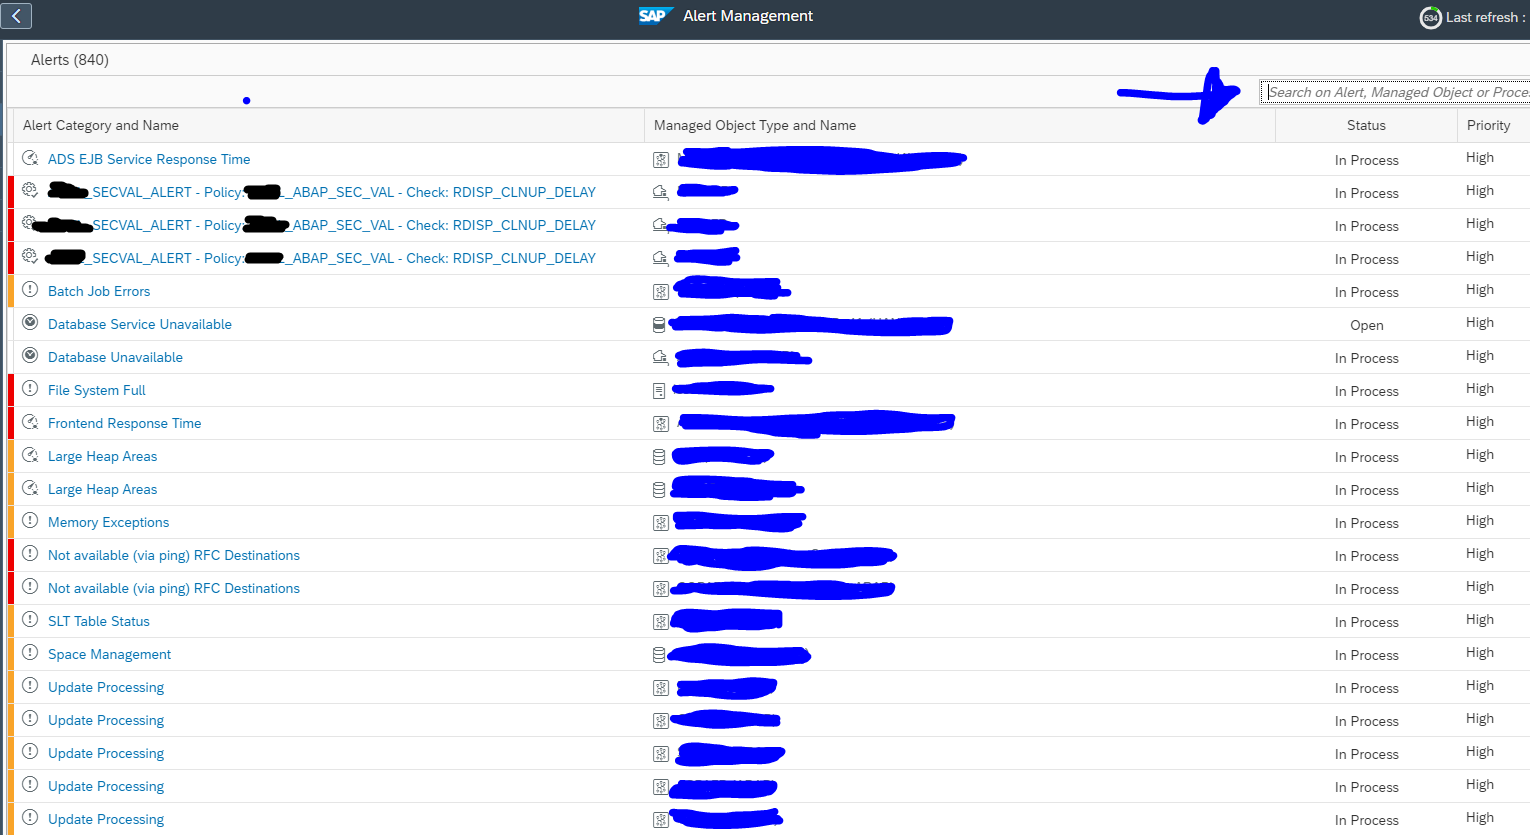
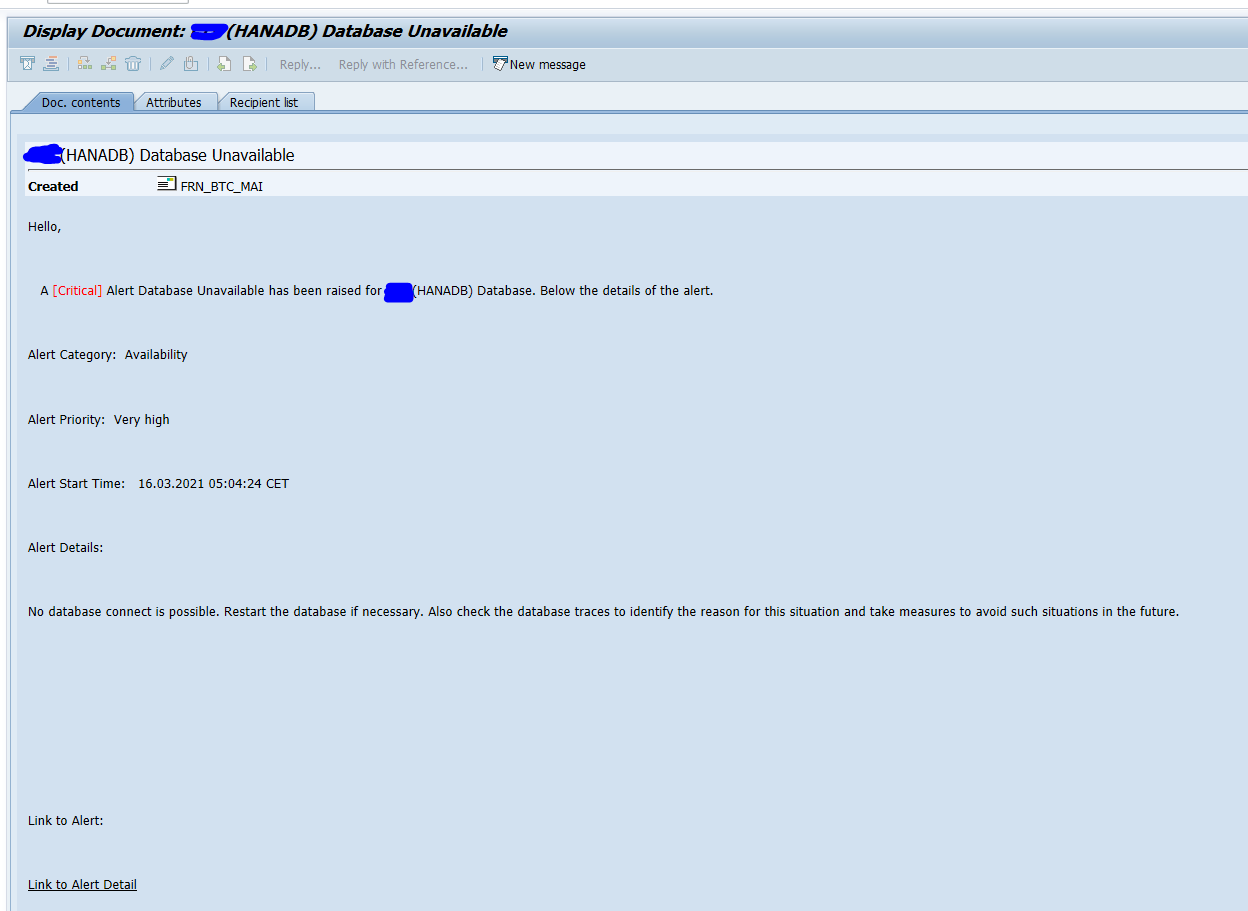
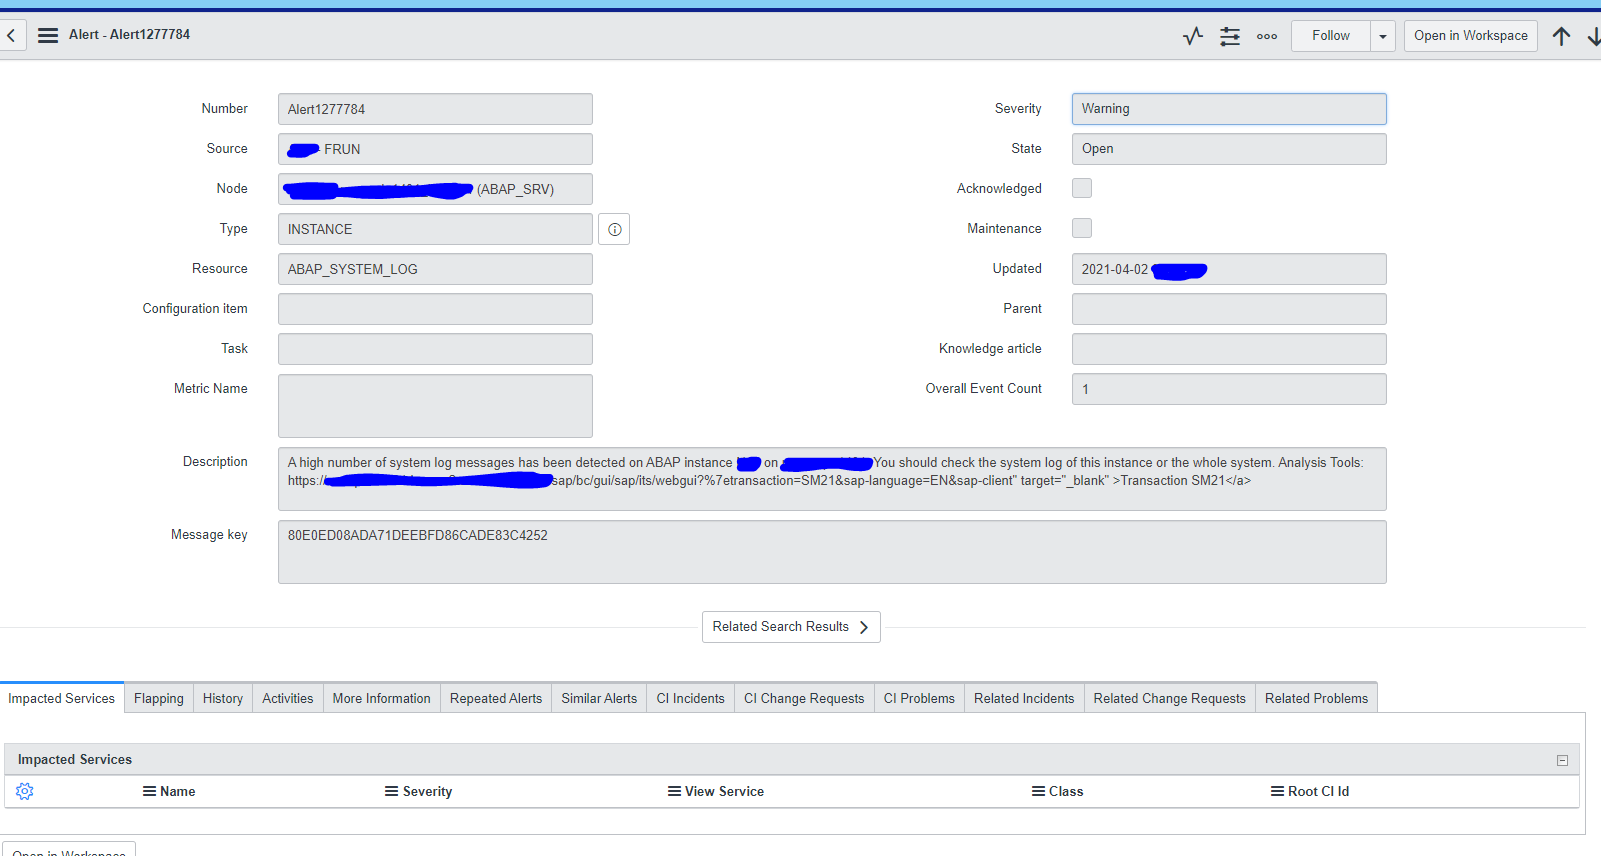
If you are inside an alert, you can trigger the alert reaction:

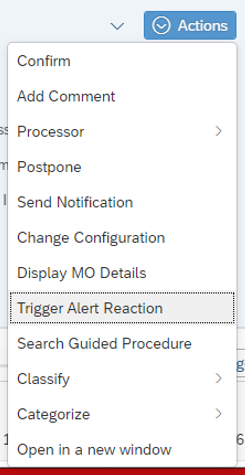
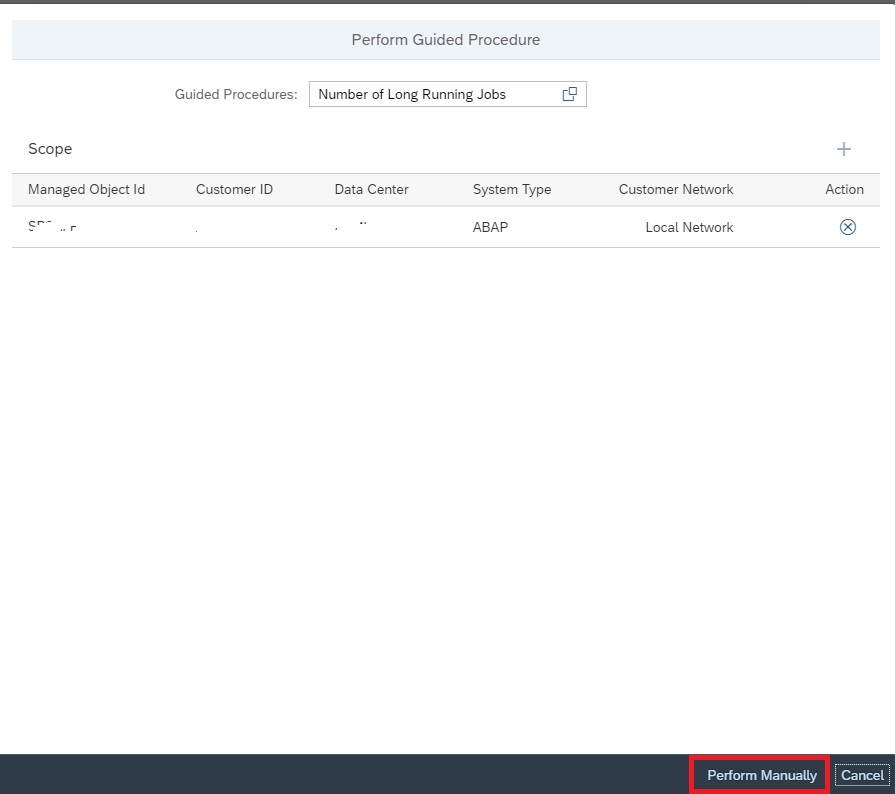
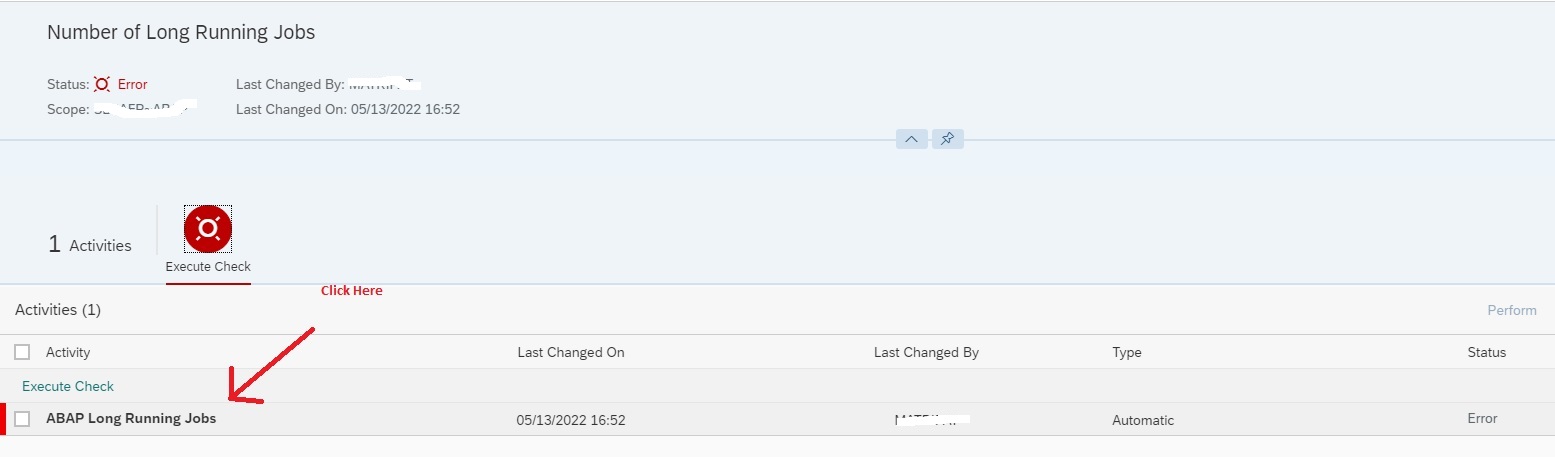
Then select the reaction to forward to ServiceNow:

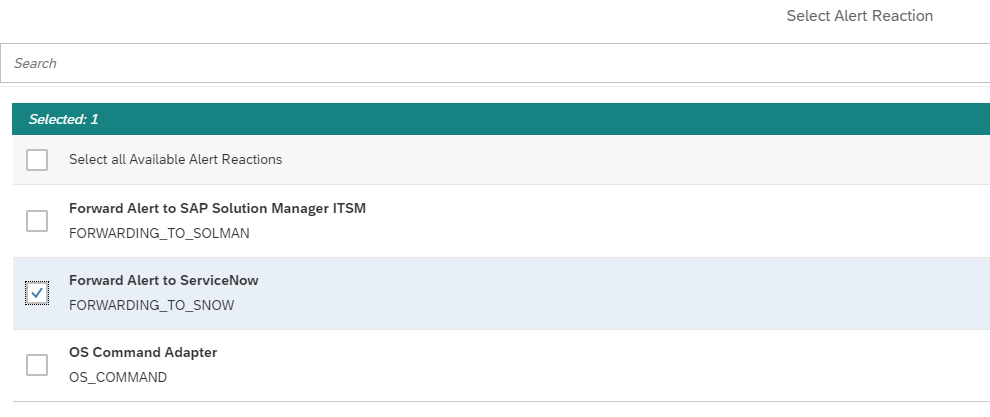
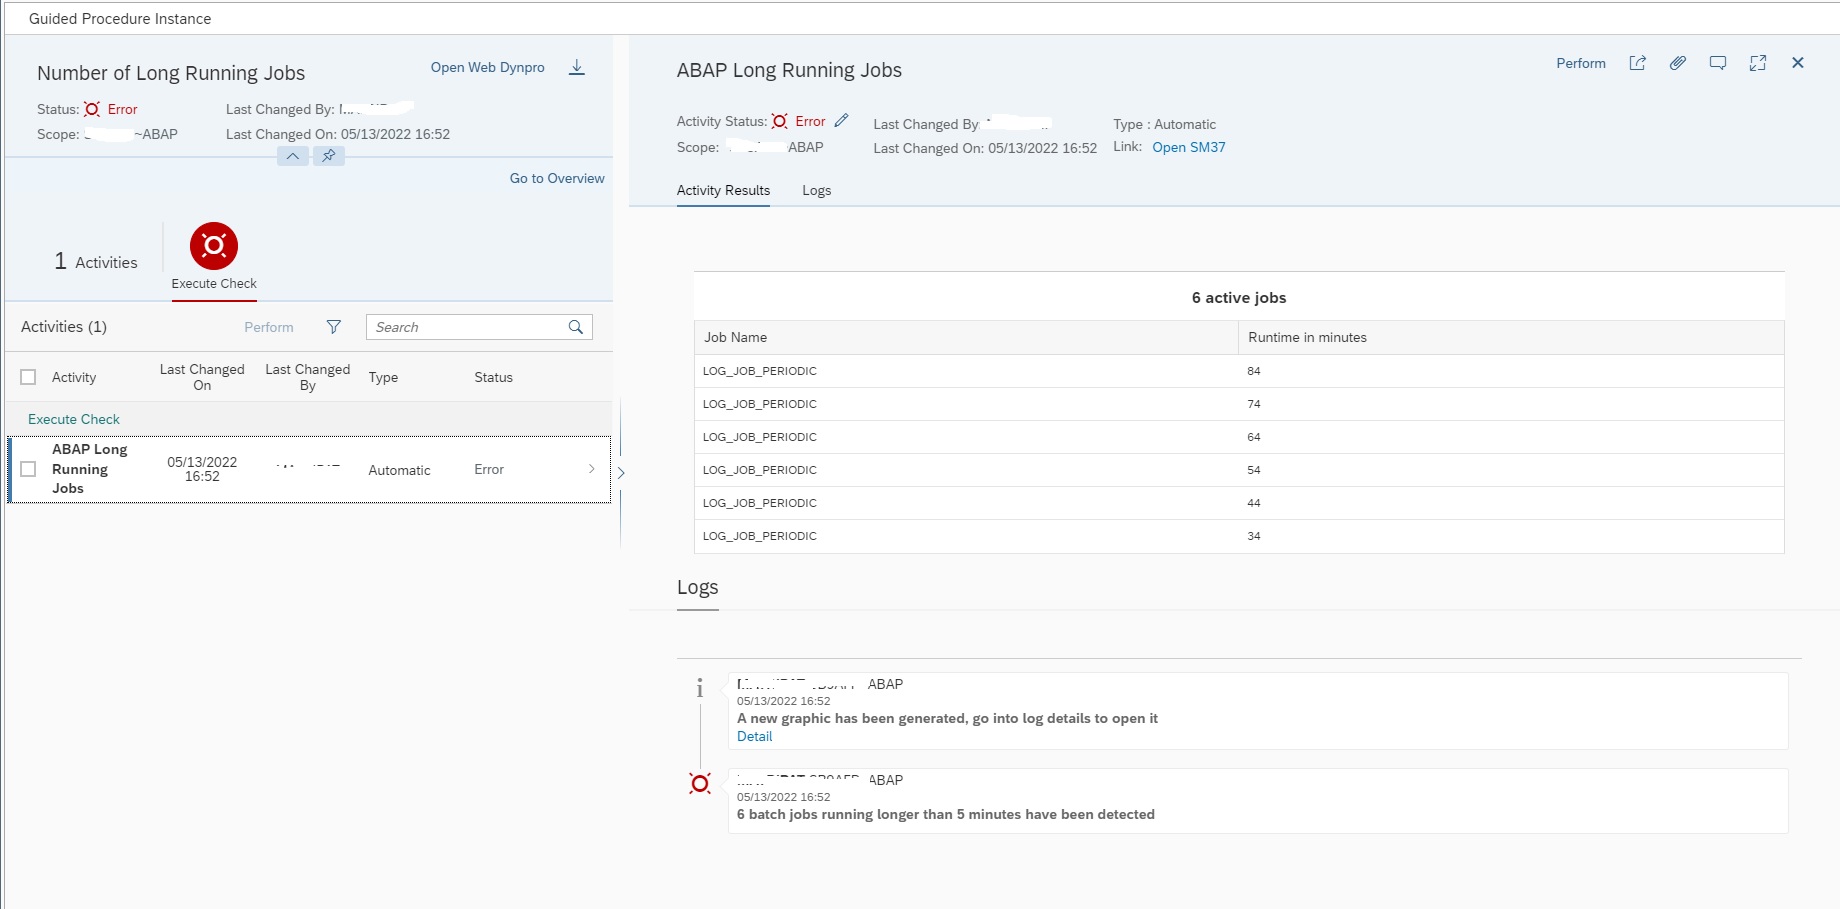
Within few seconds the alert in ServiceNow is created:

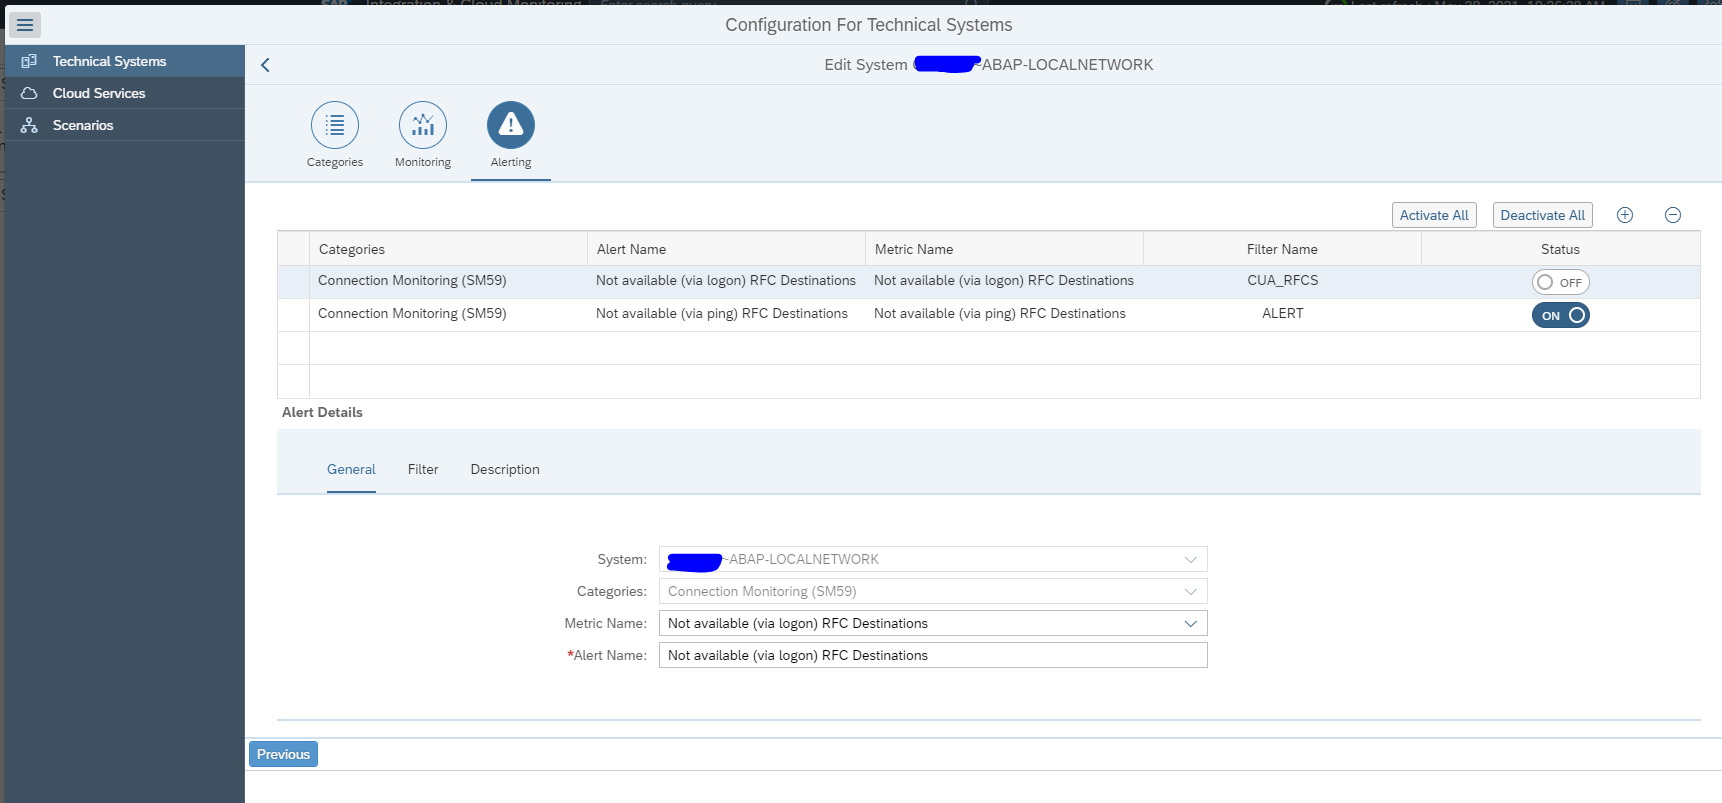
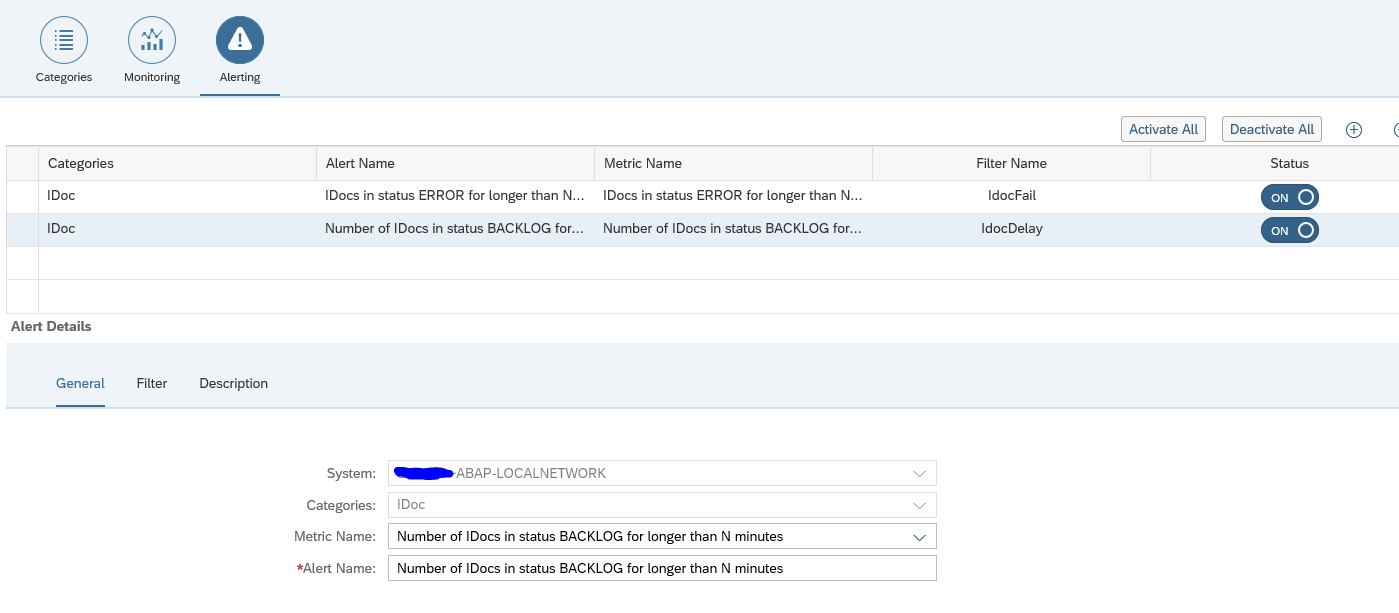
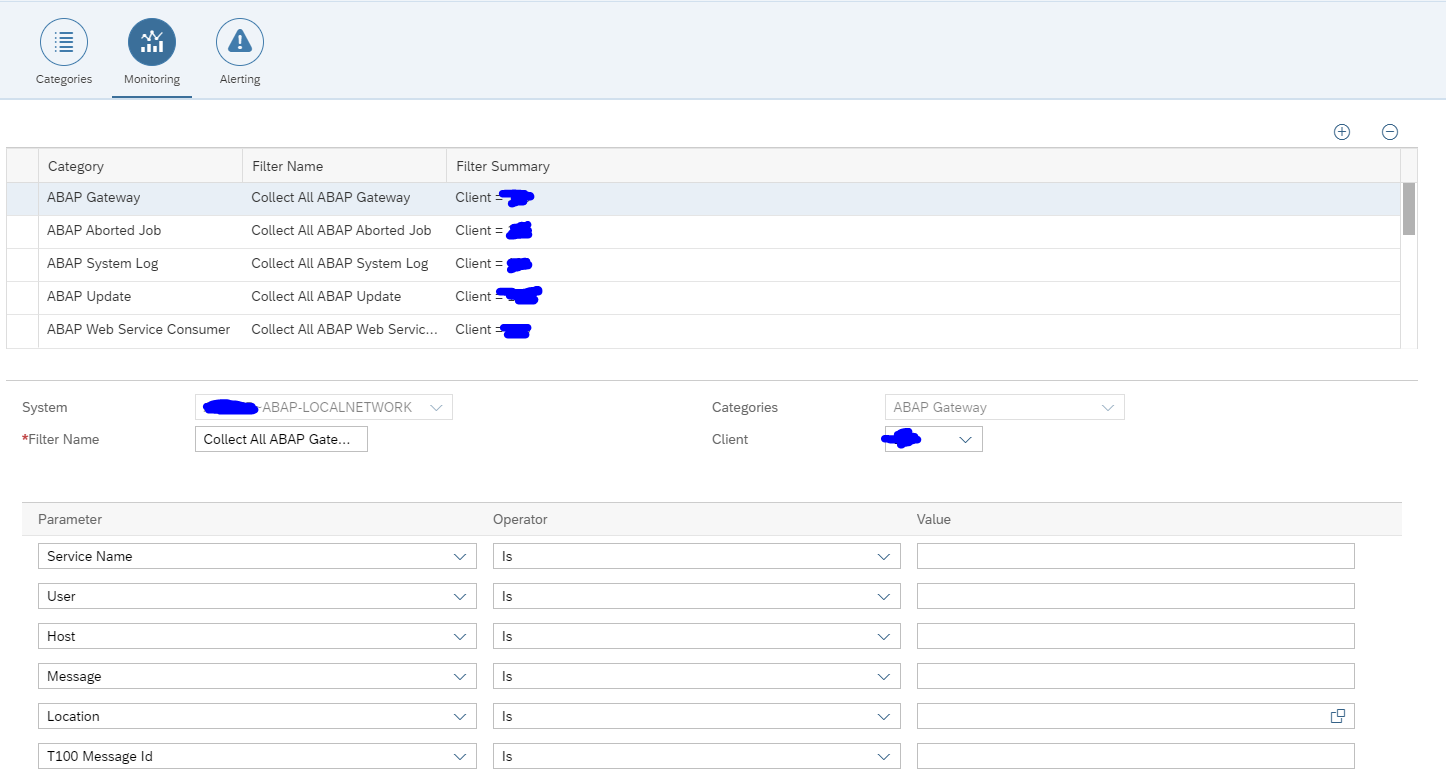
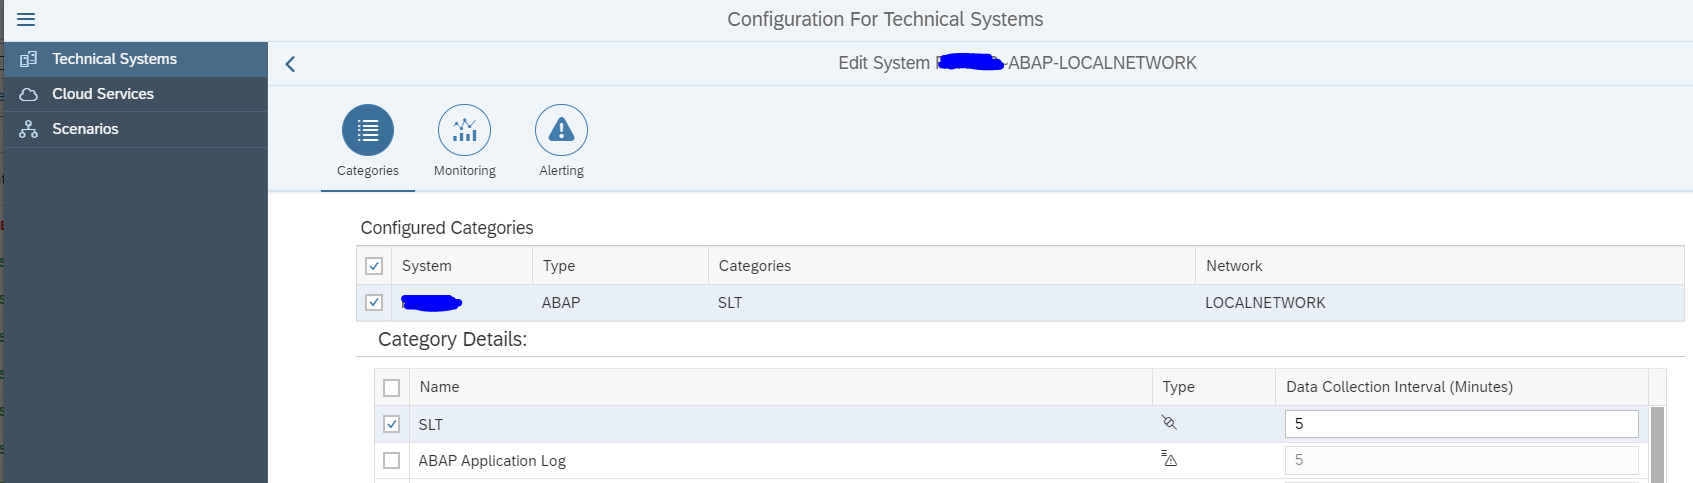
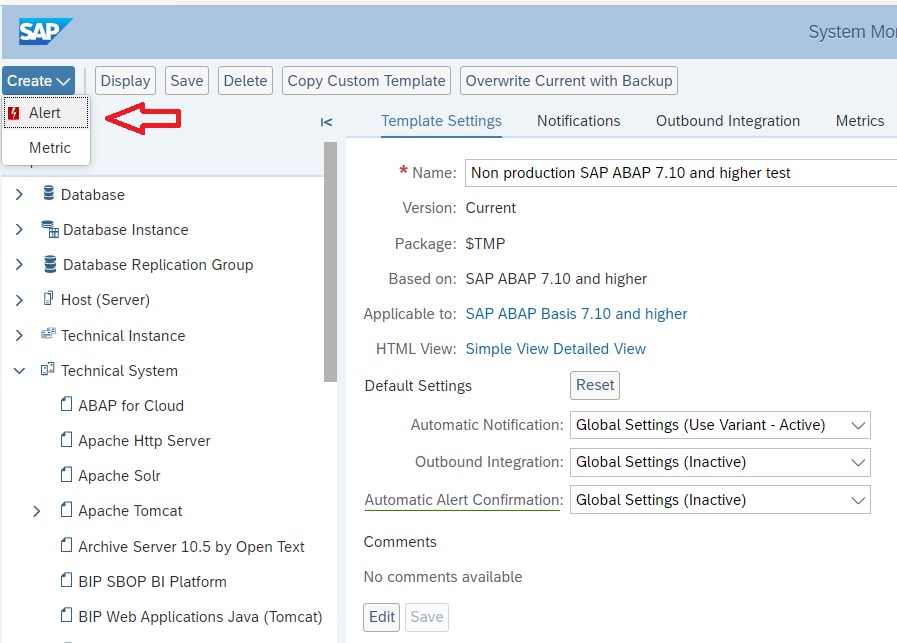
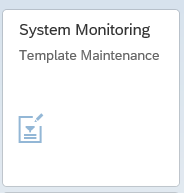
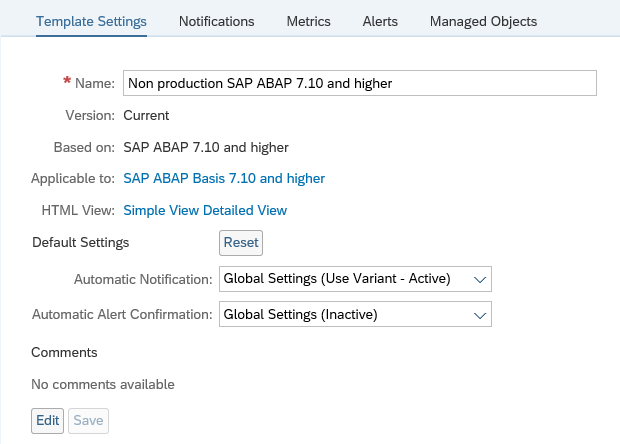
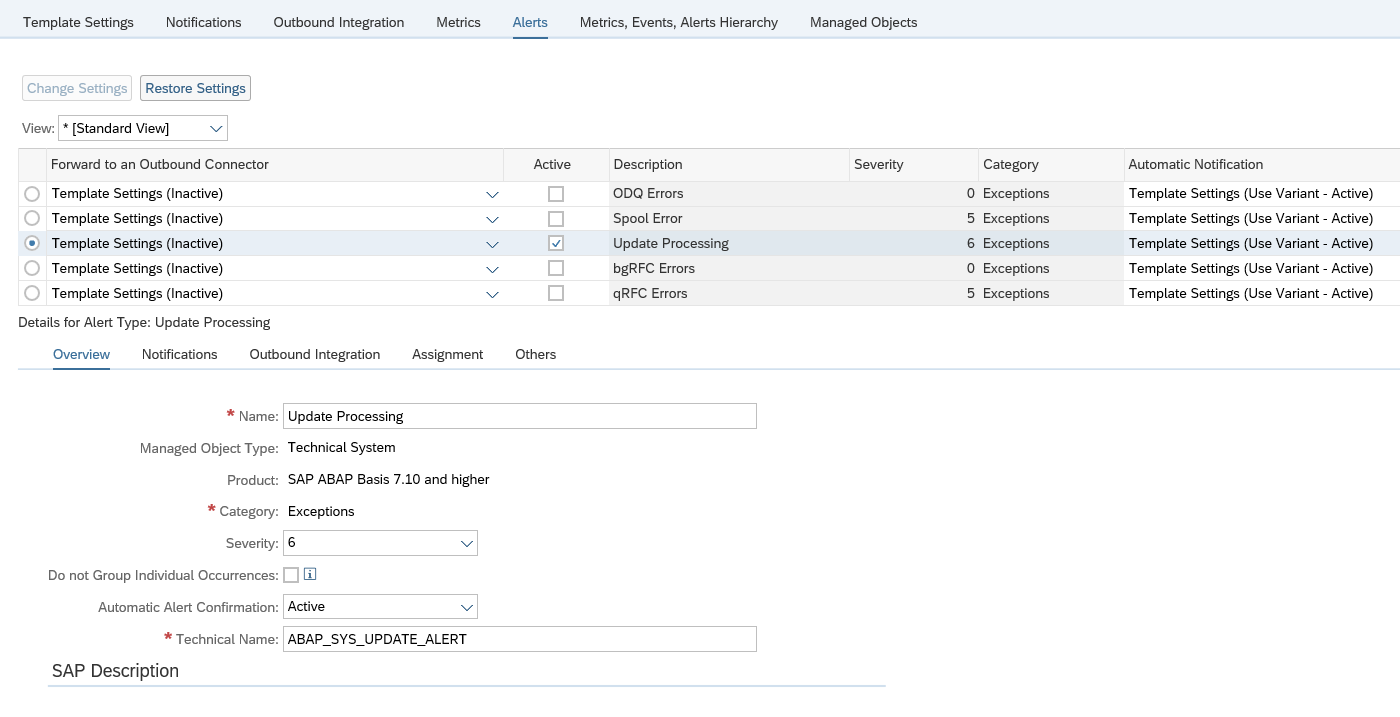
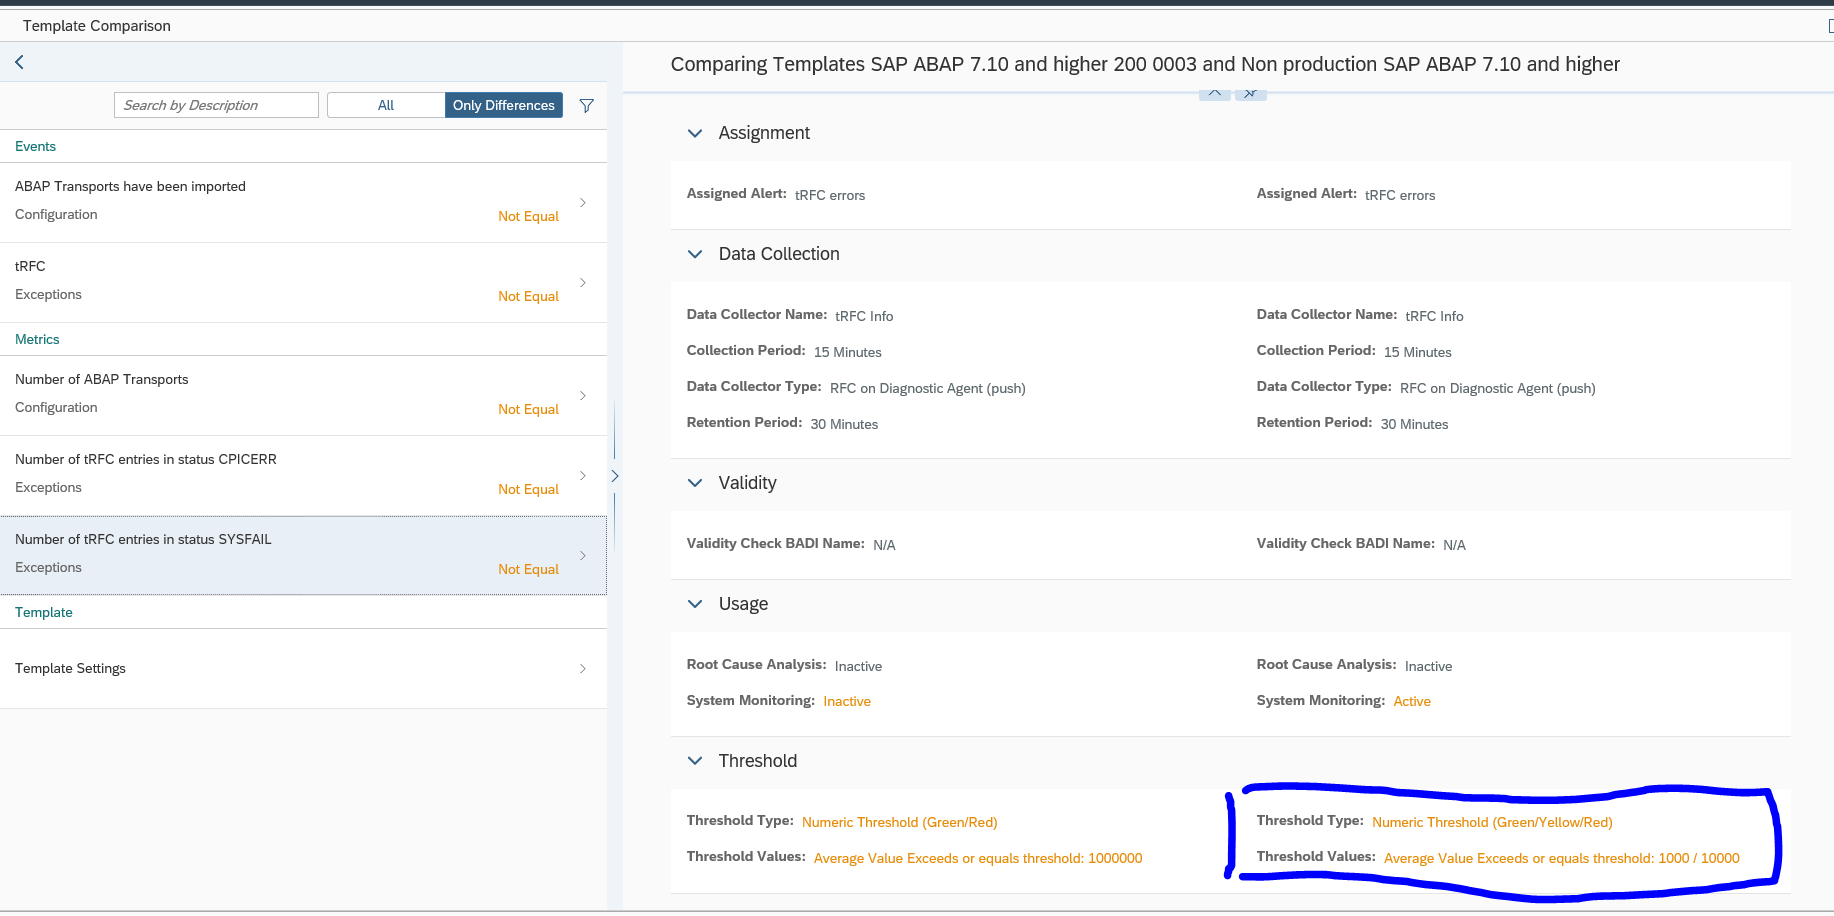
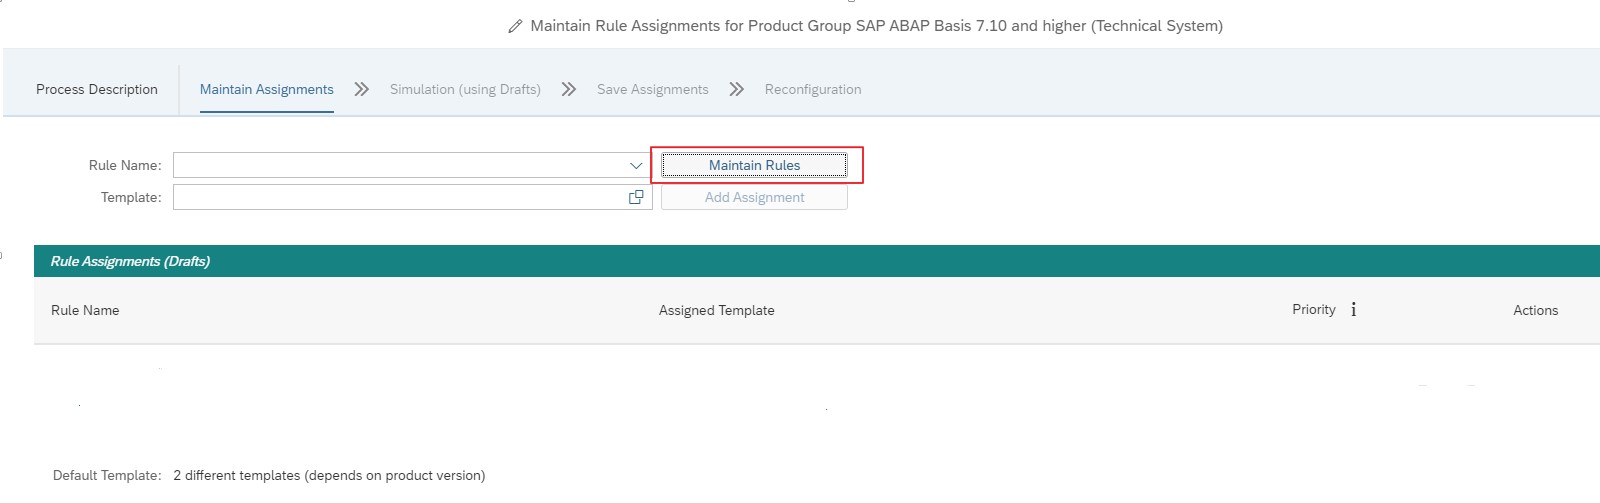
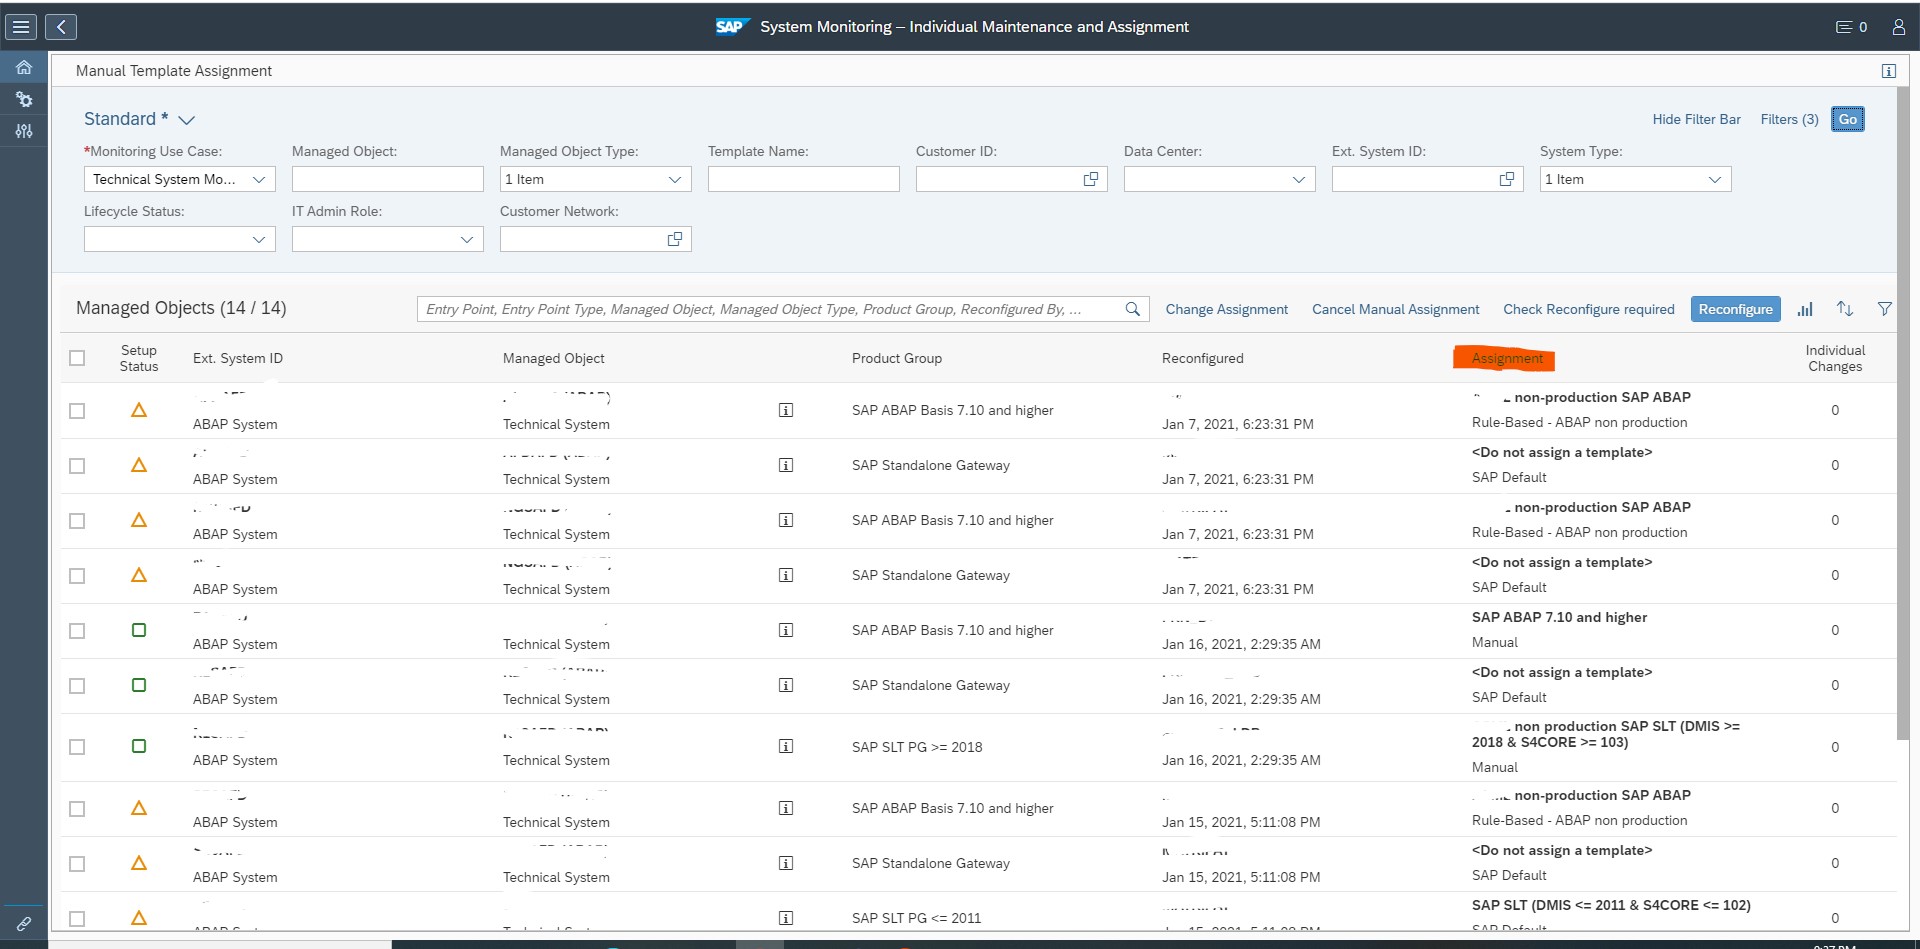
Alert reaction automation in template settings

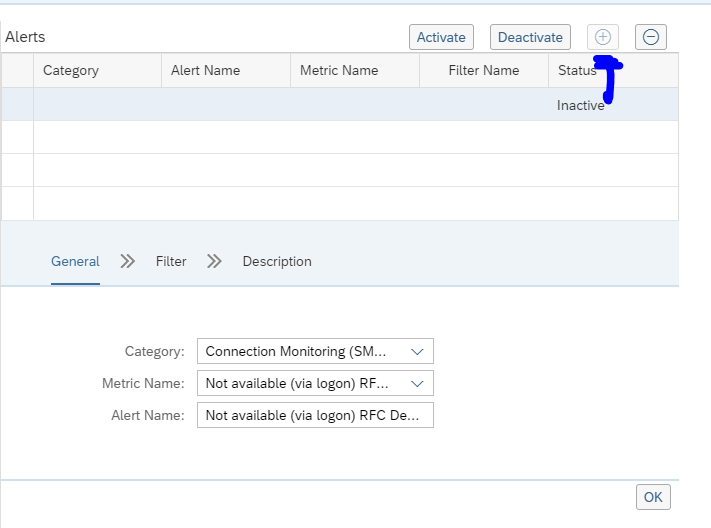
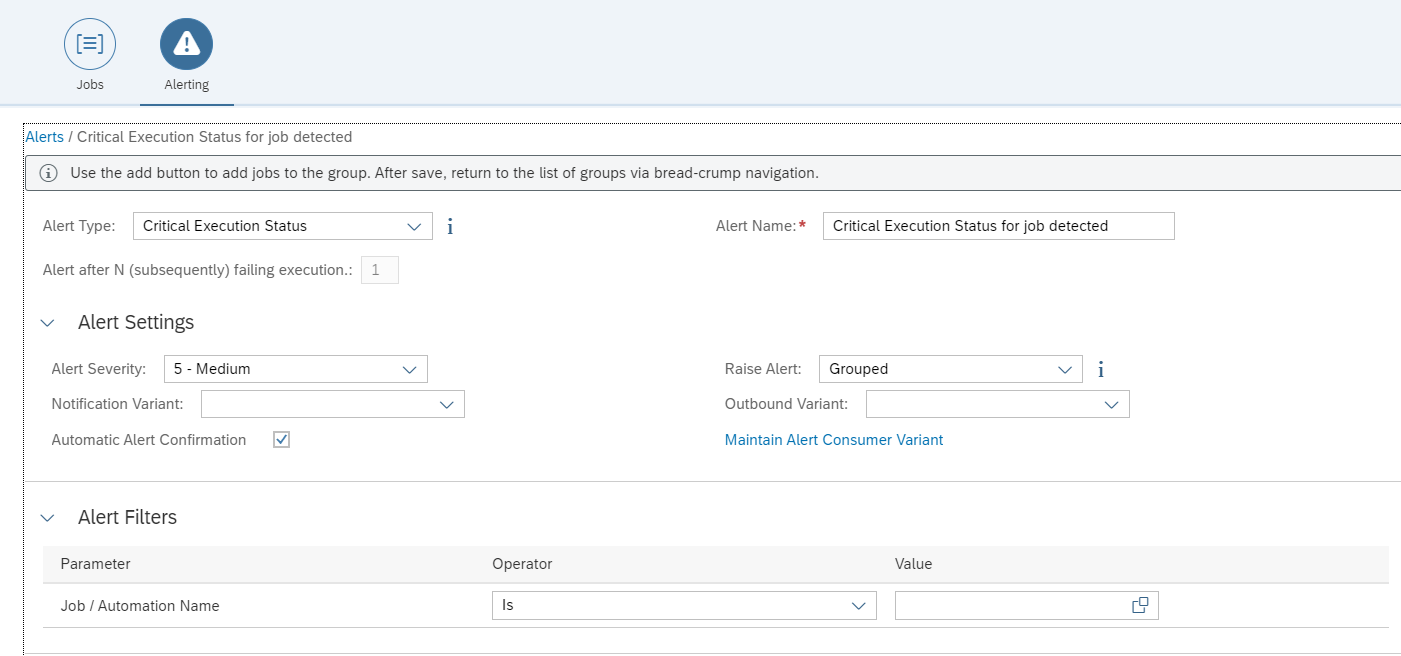
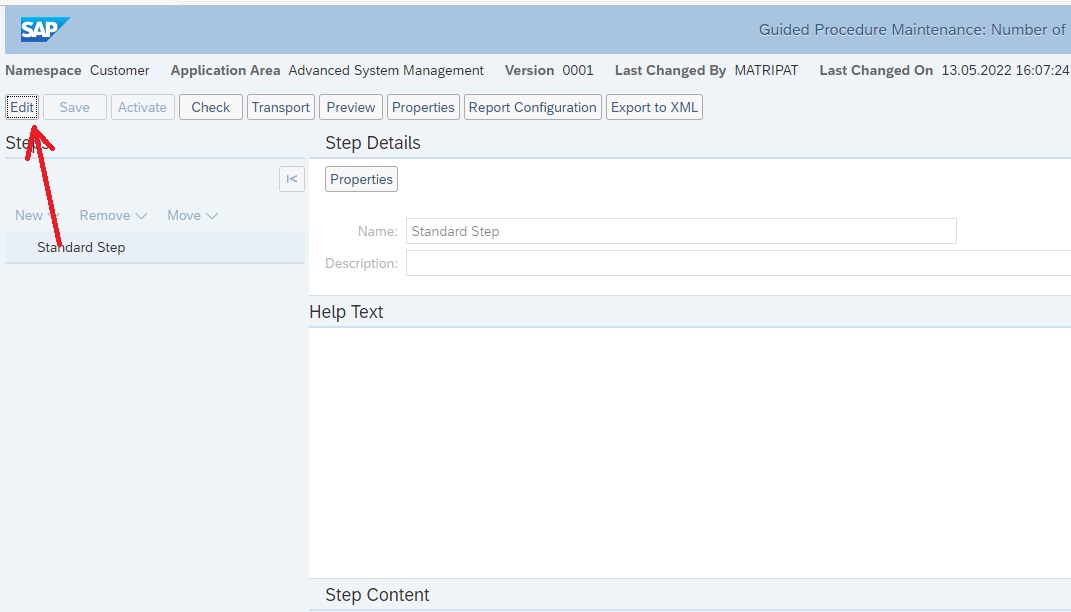
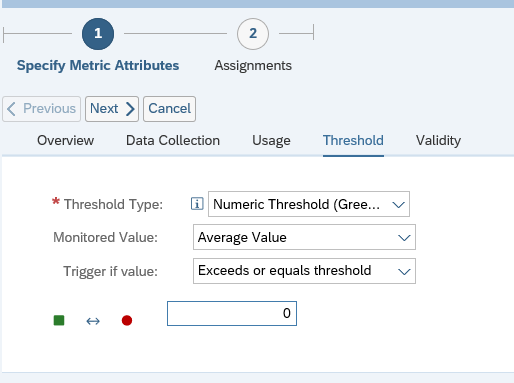
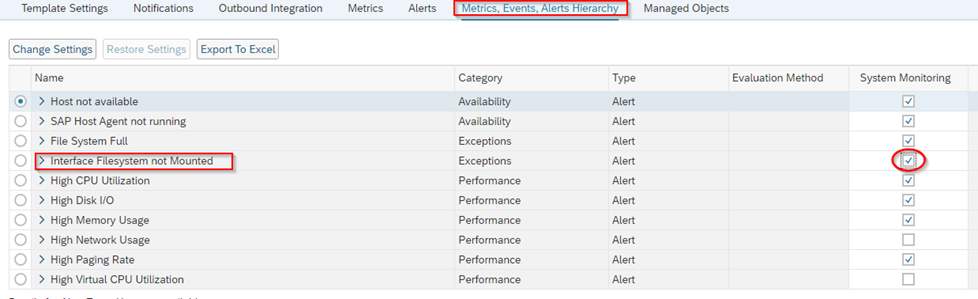
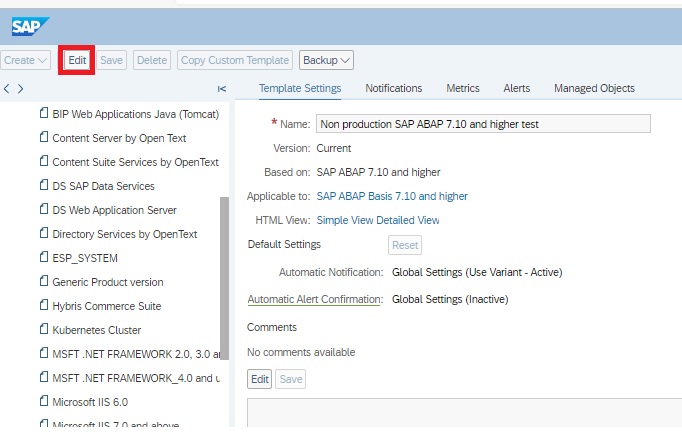
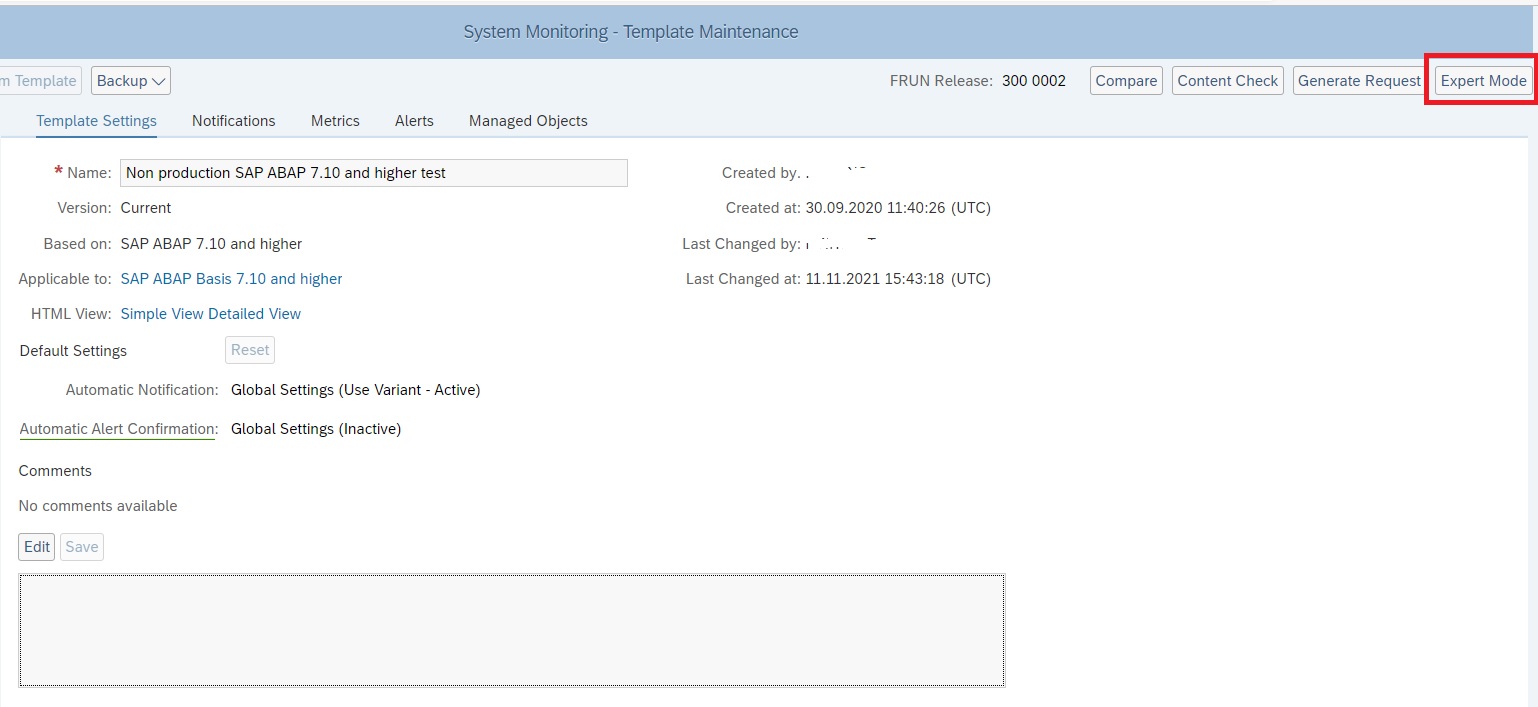
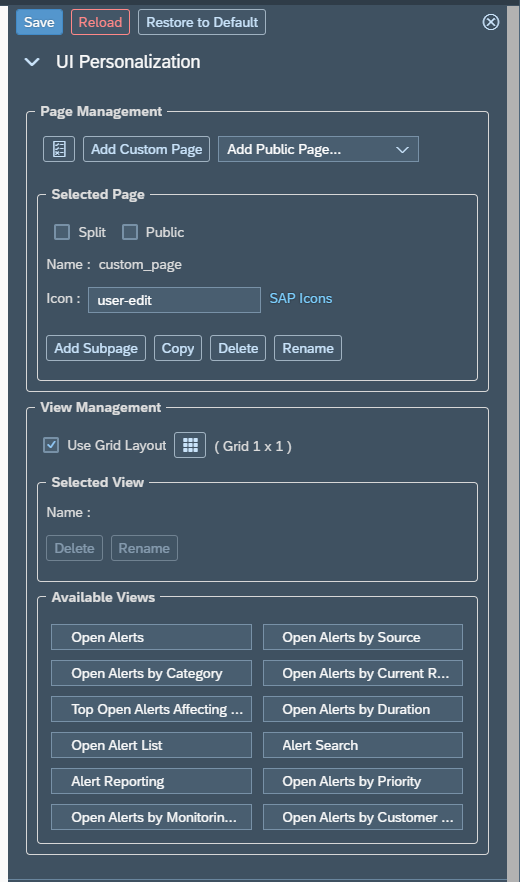
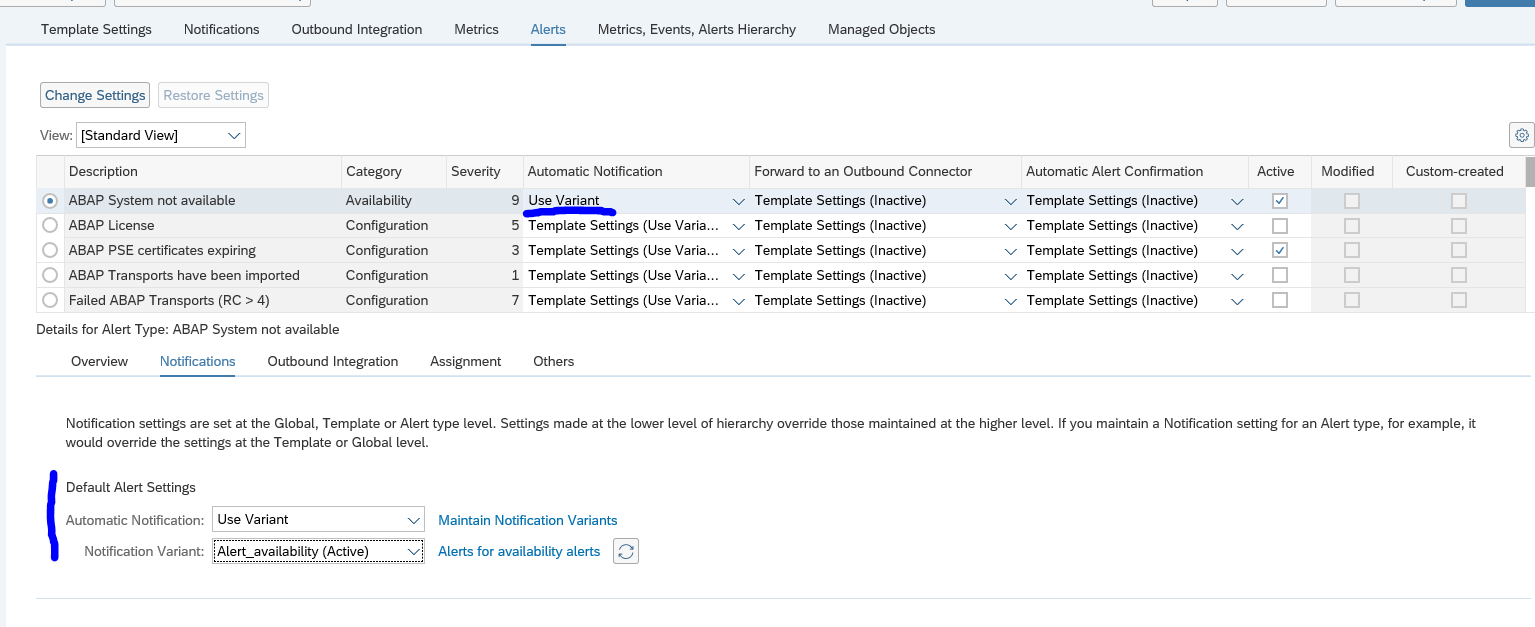
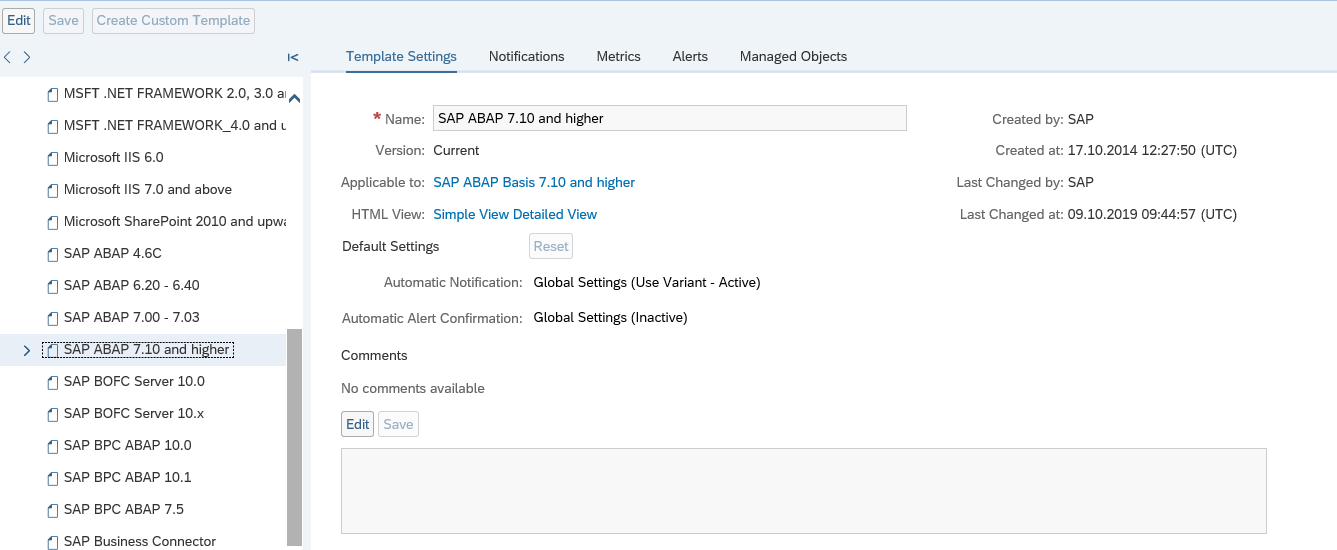
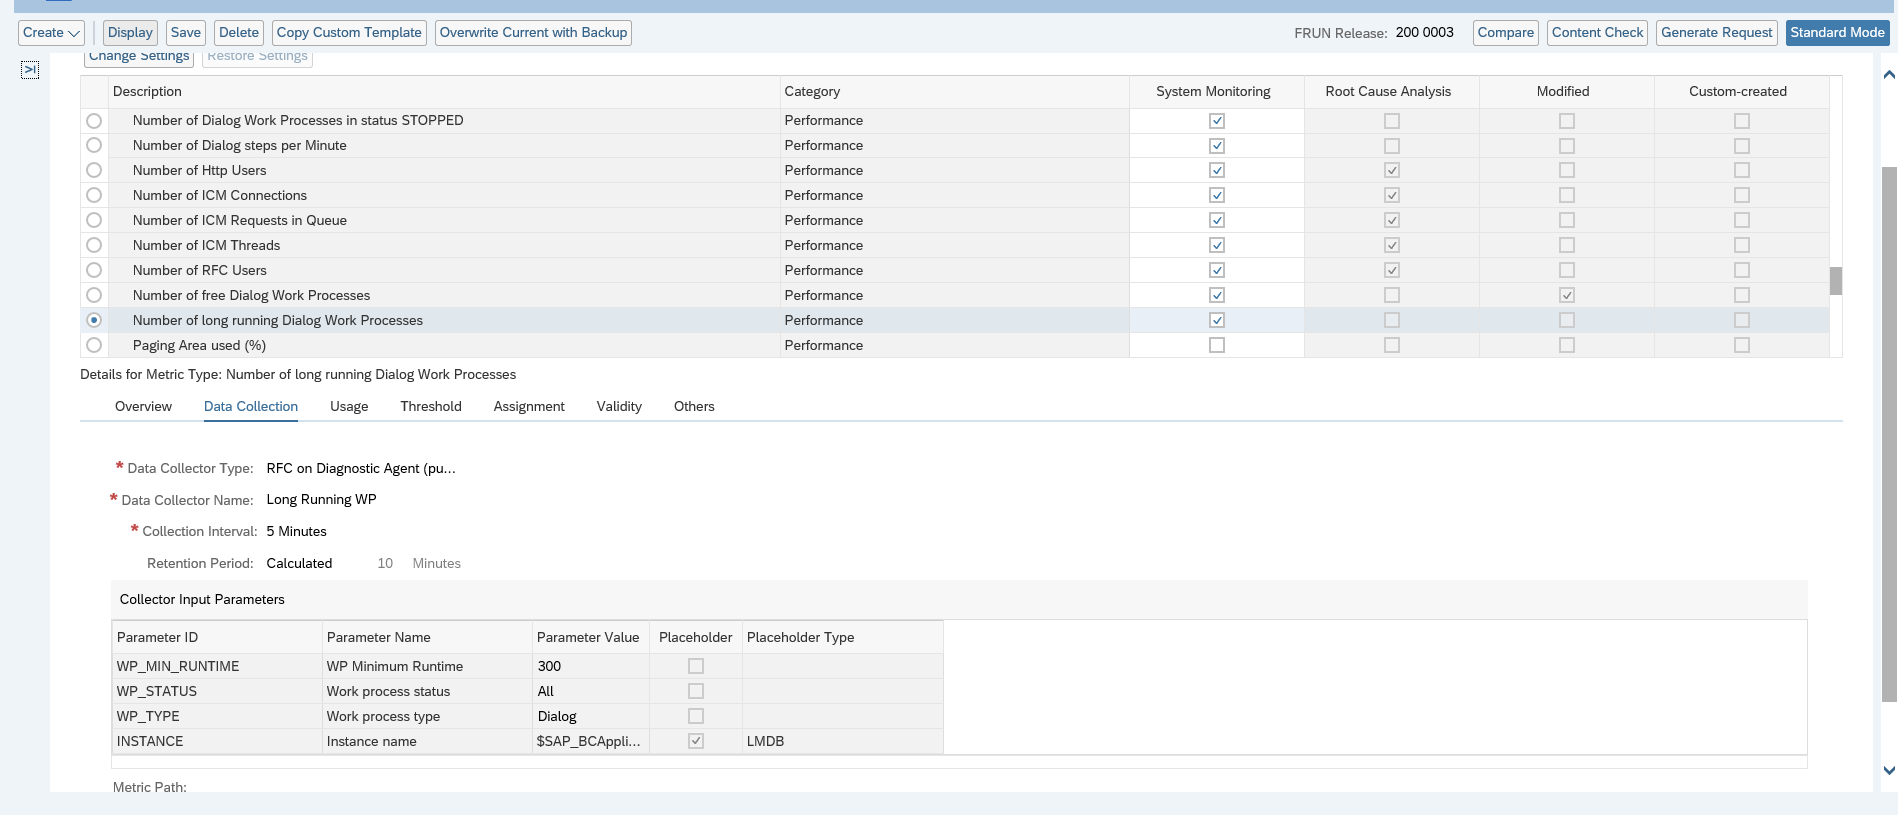
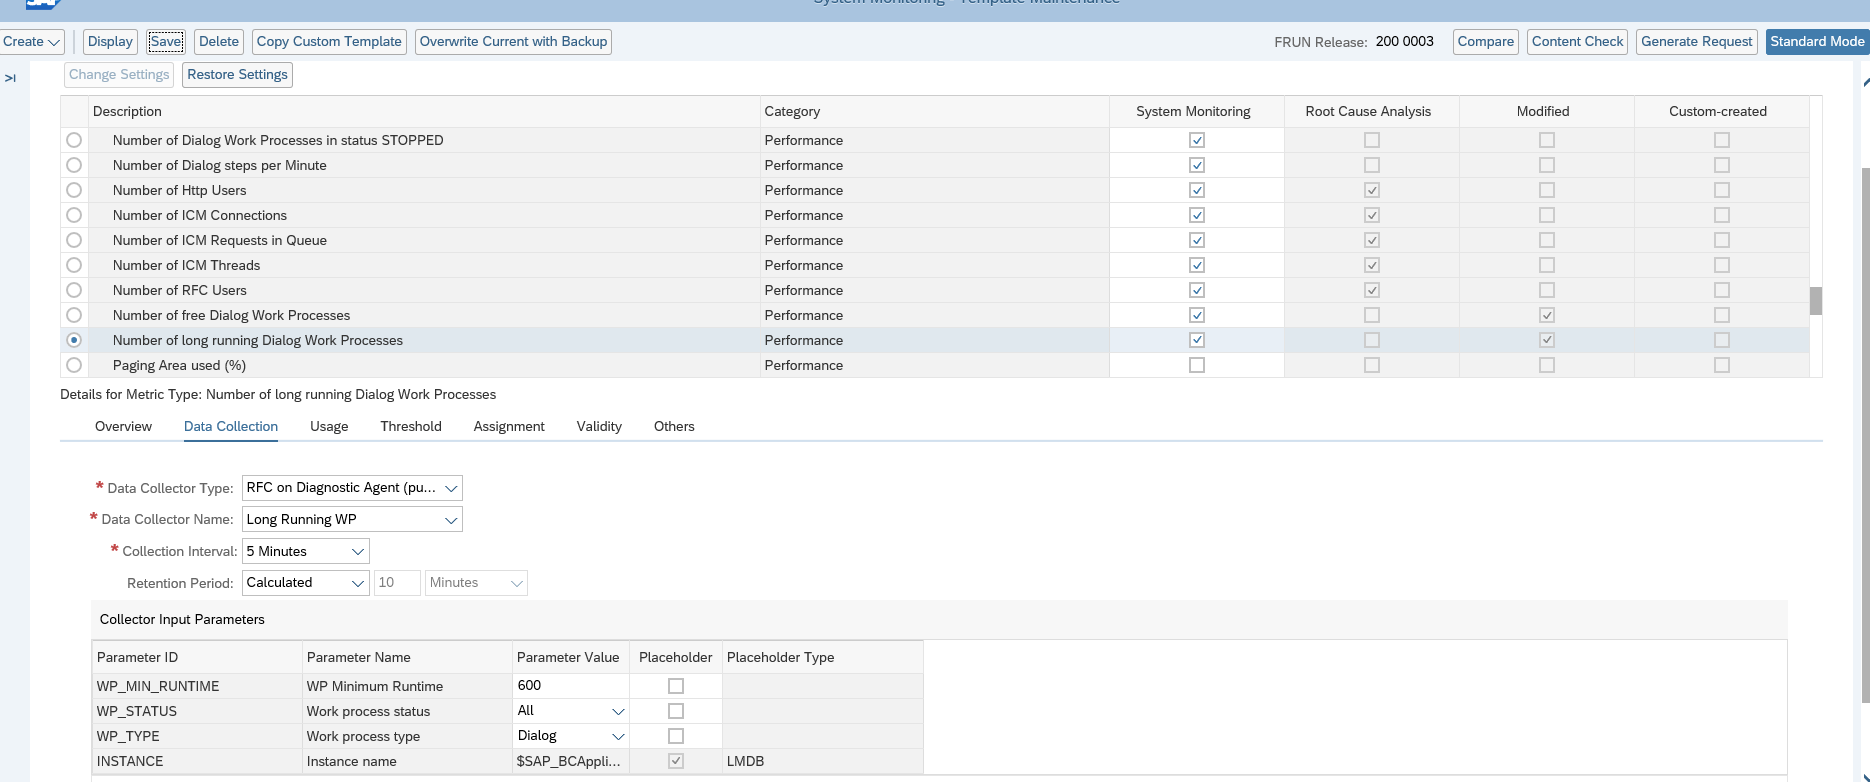
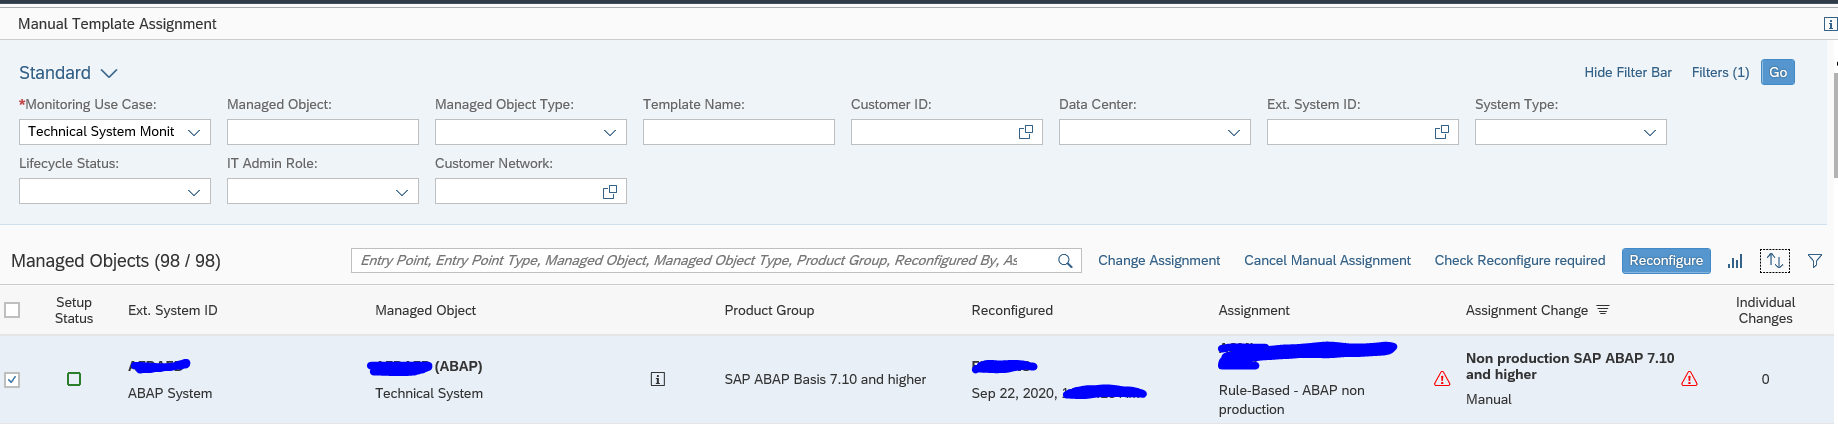
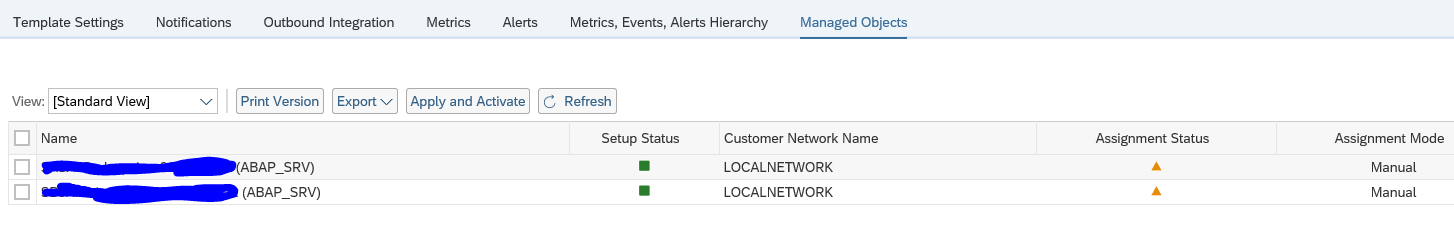
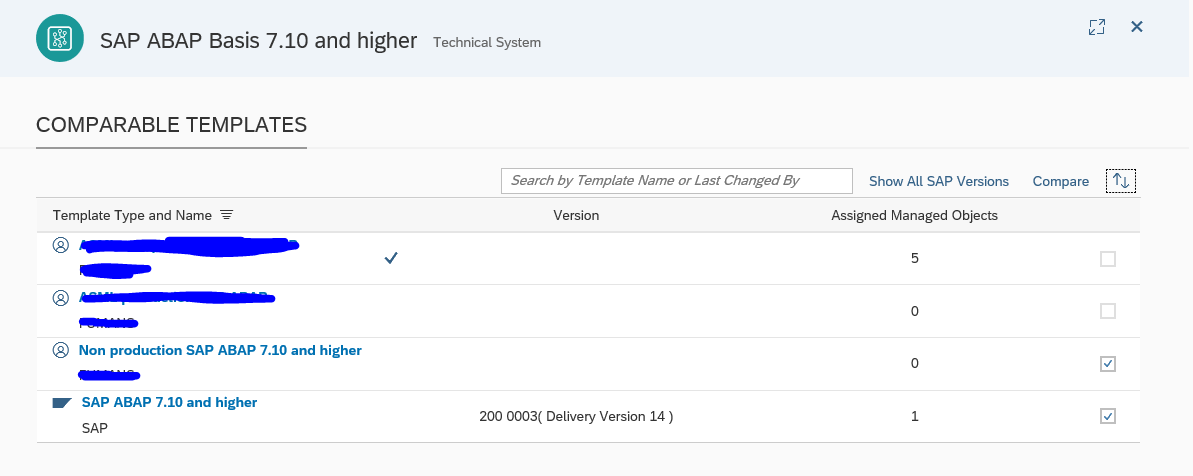
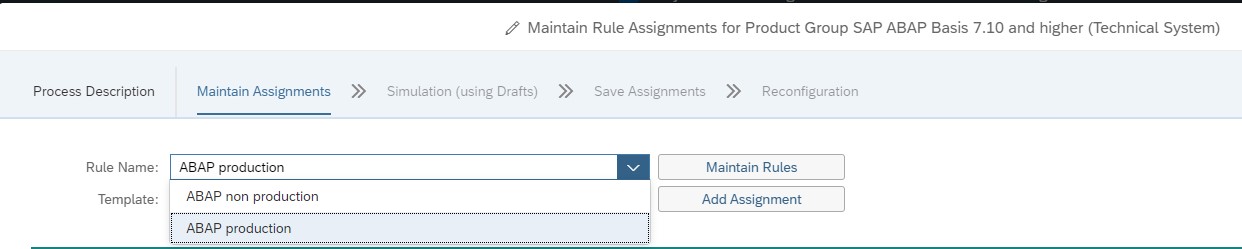
The alert reaction to ServiceNow can also be automated as Outbound Integration. If you are in template maintenance mode, switch to Expert mode.

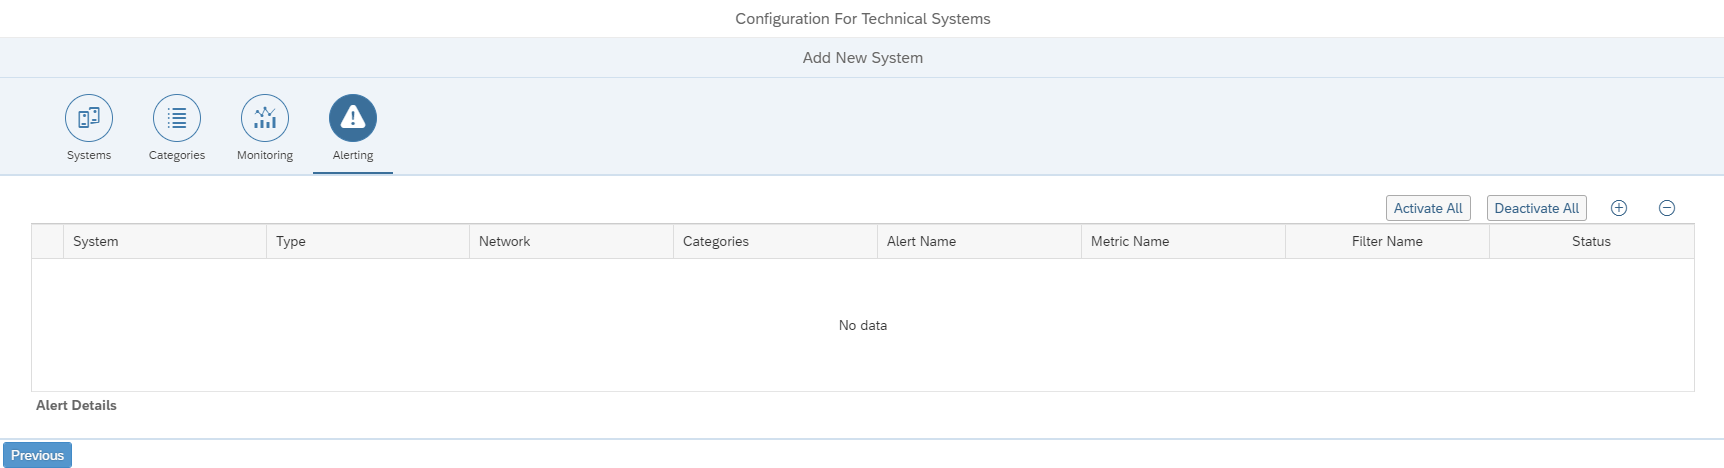
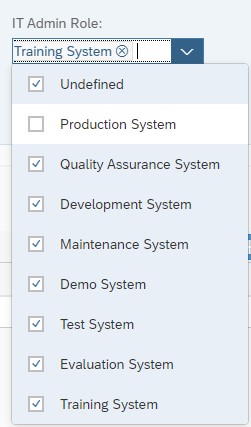
In the alerts tab now configure the alert type for Forward to and Outbound Connector:

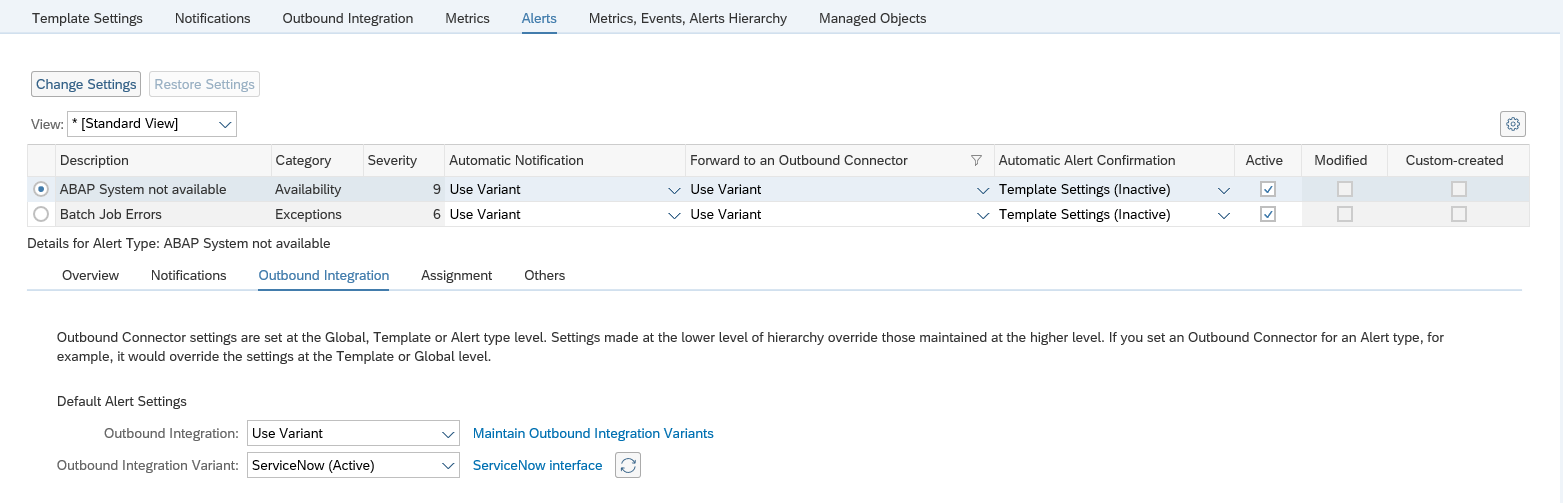
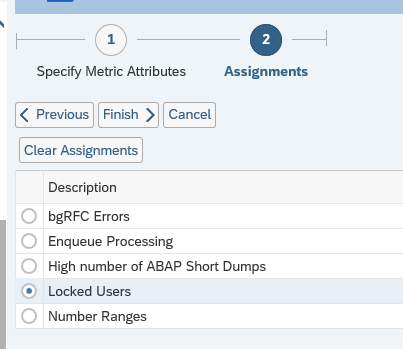
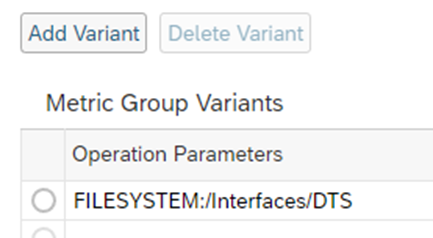
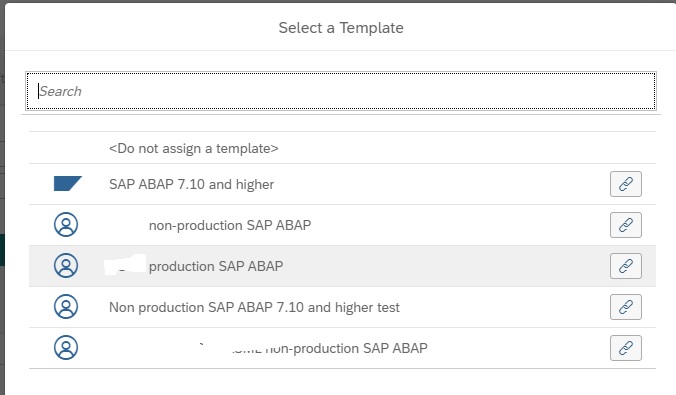
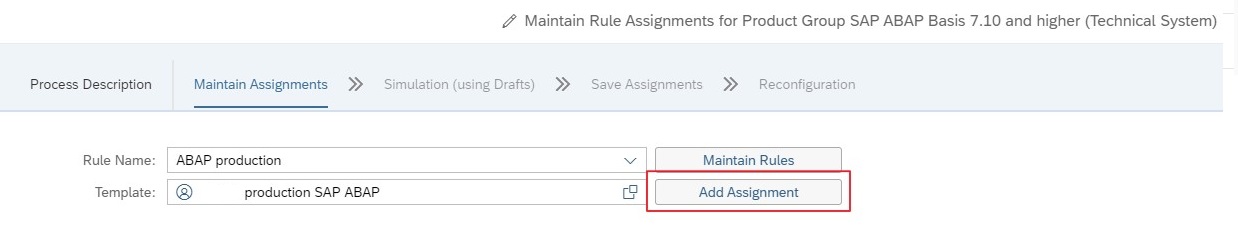
Assign the correct variant.

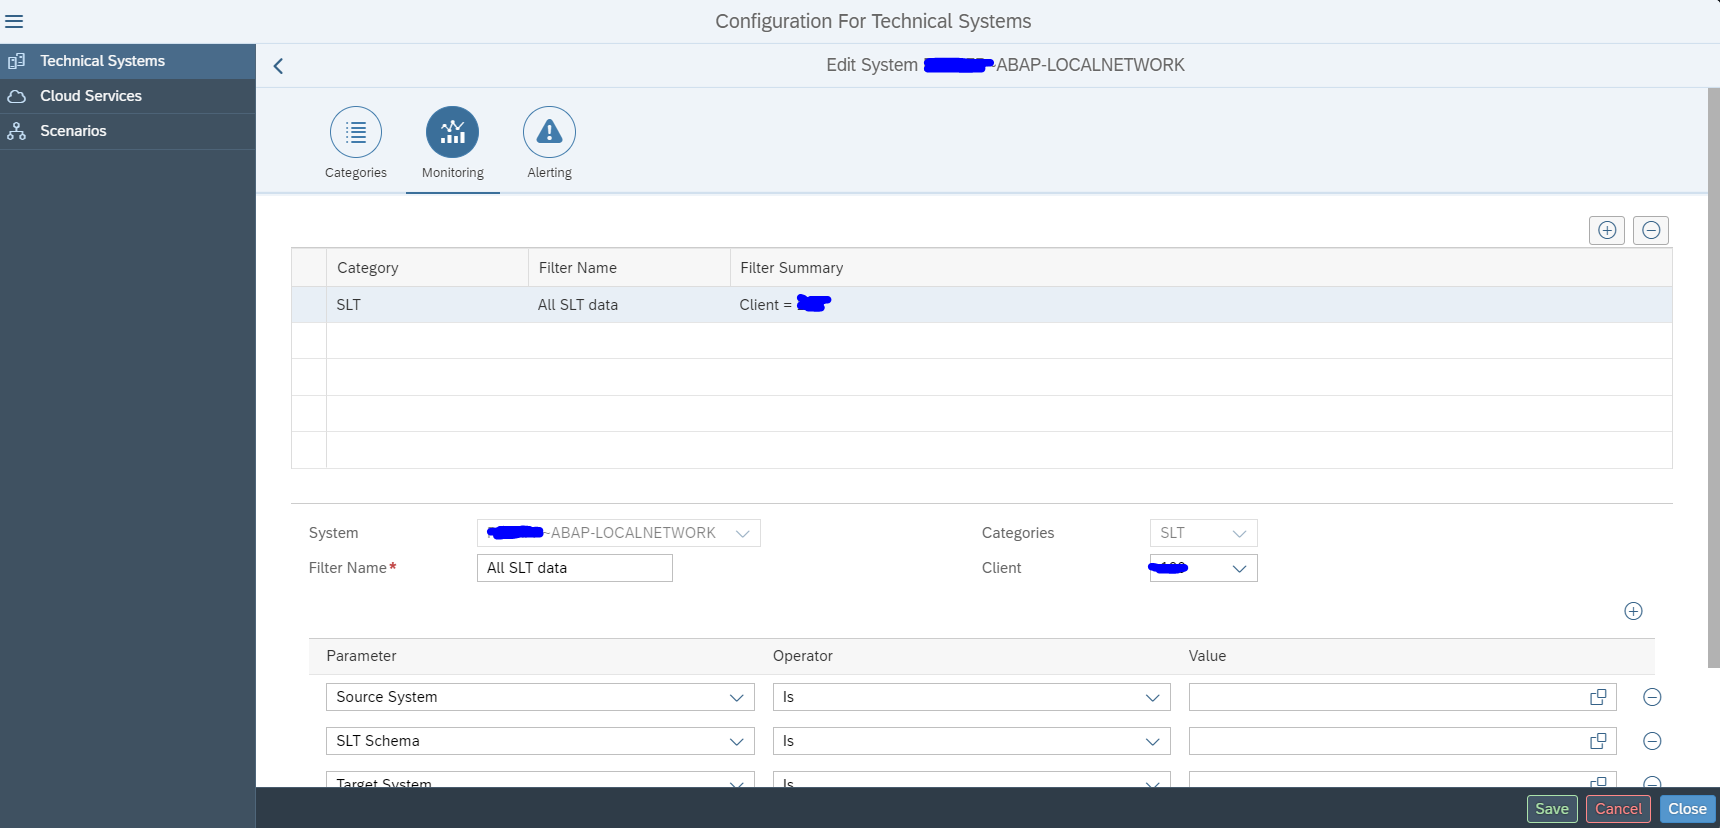
If you click on the variant you go to the variant configuration screen:

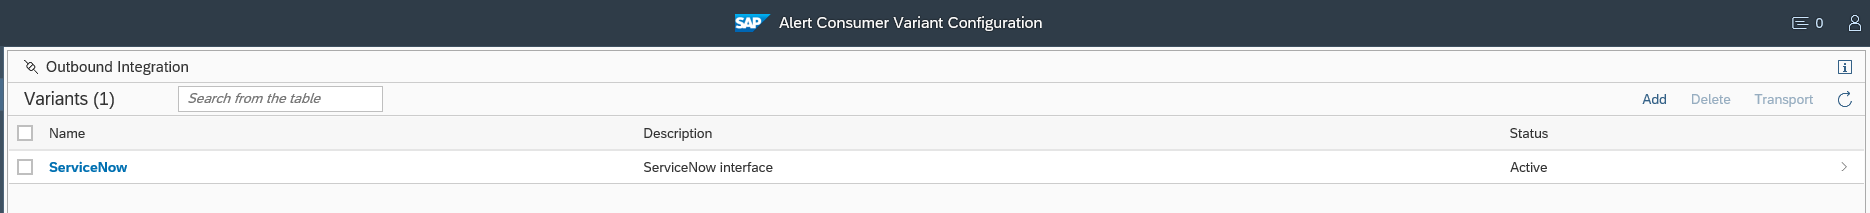
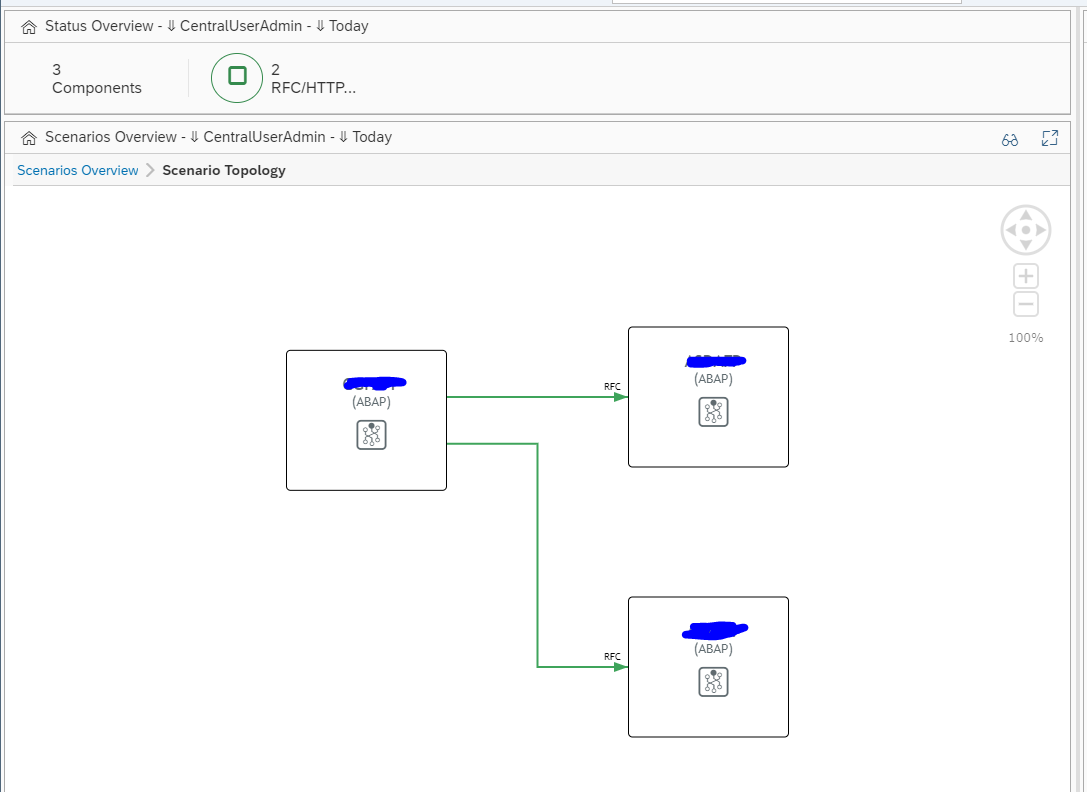
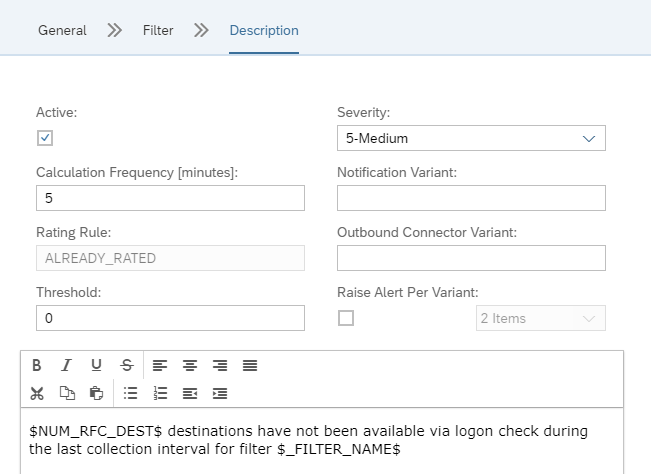
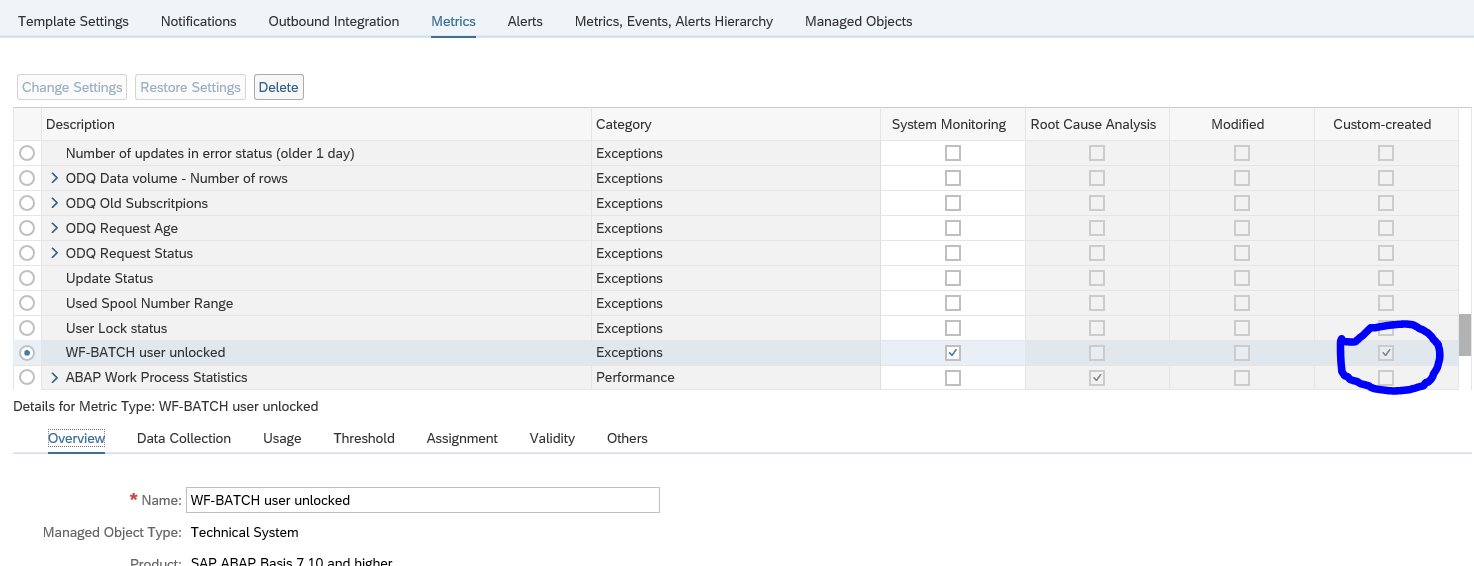
Then select the outbound integration name to see the details:

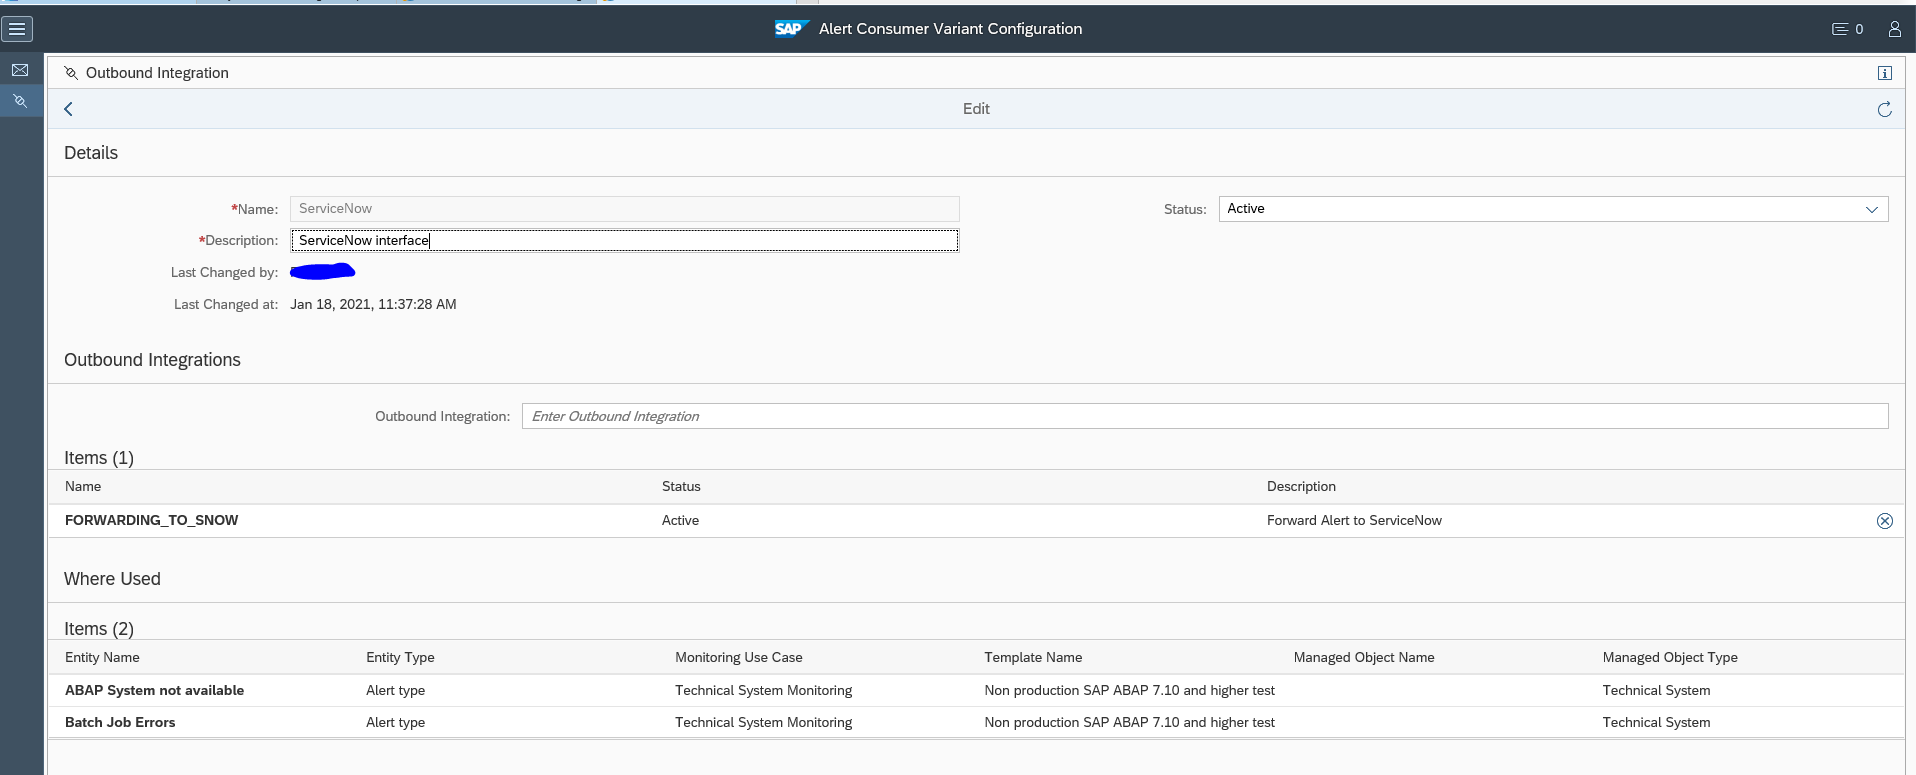
Important here is the where used list, which shows you from which templates and template elements the connector is called.

Whenever the alert is raised, also the outbound integration connector to ServiceNow is called.

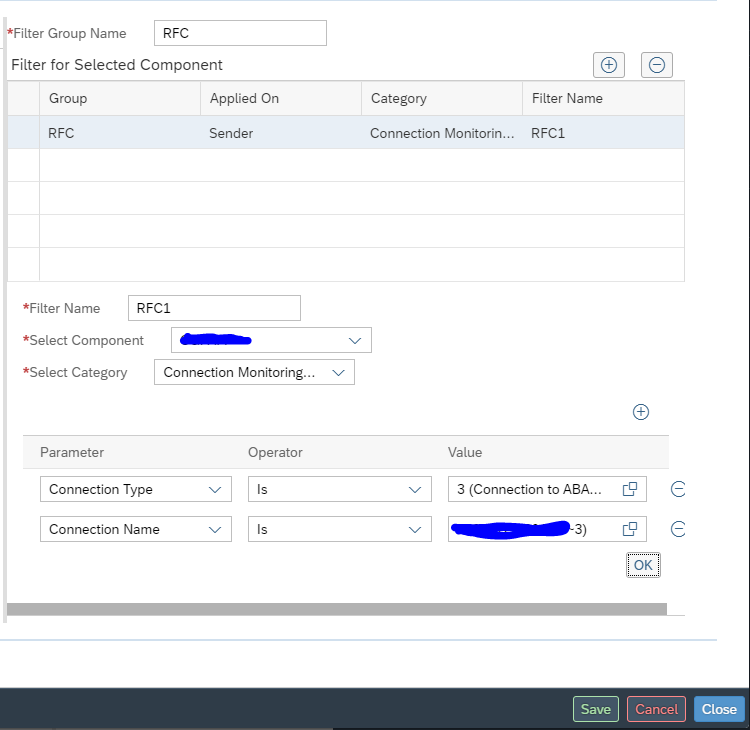
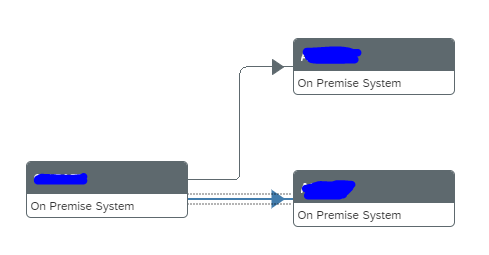
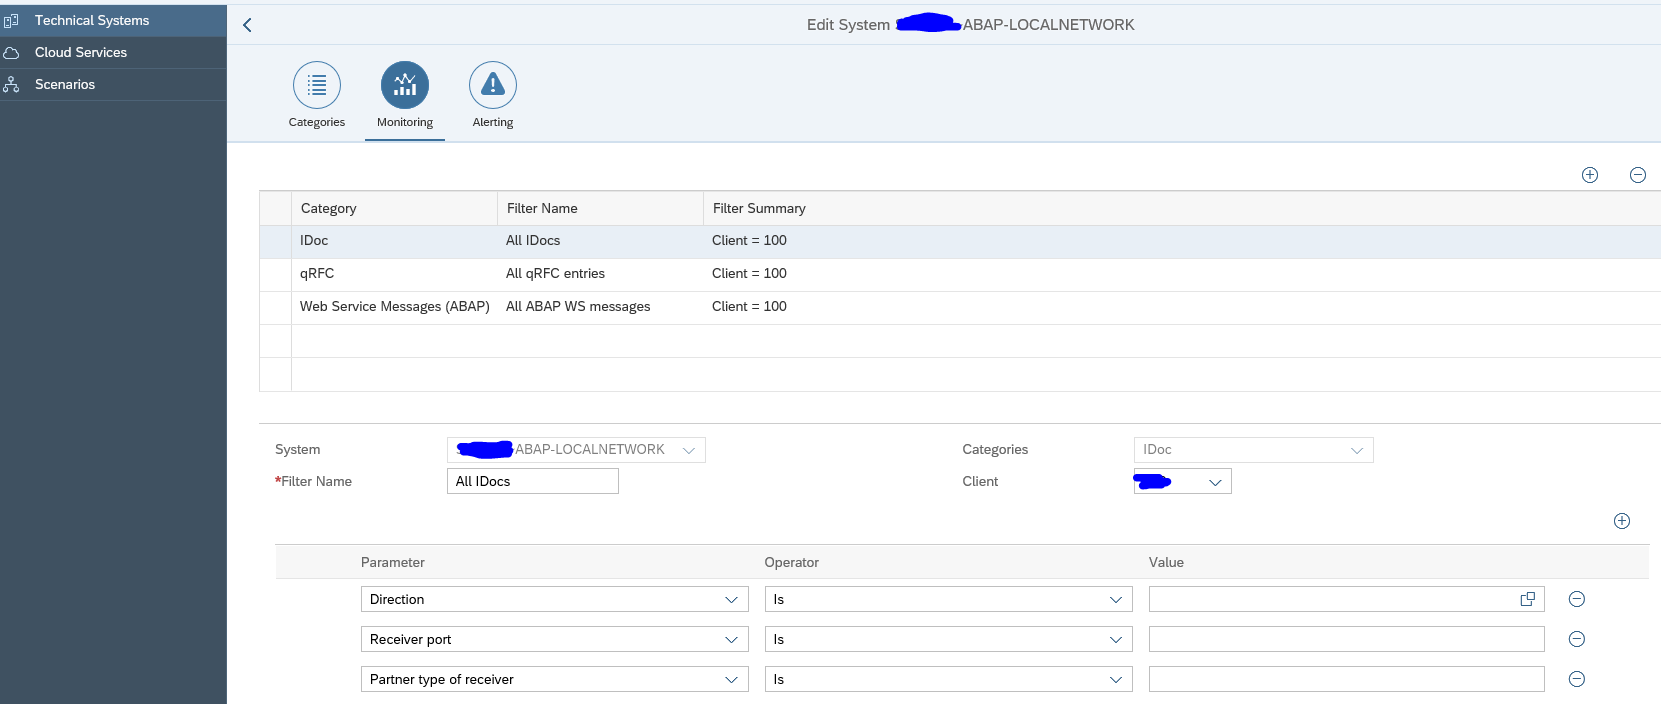
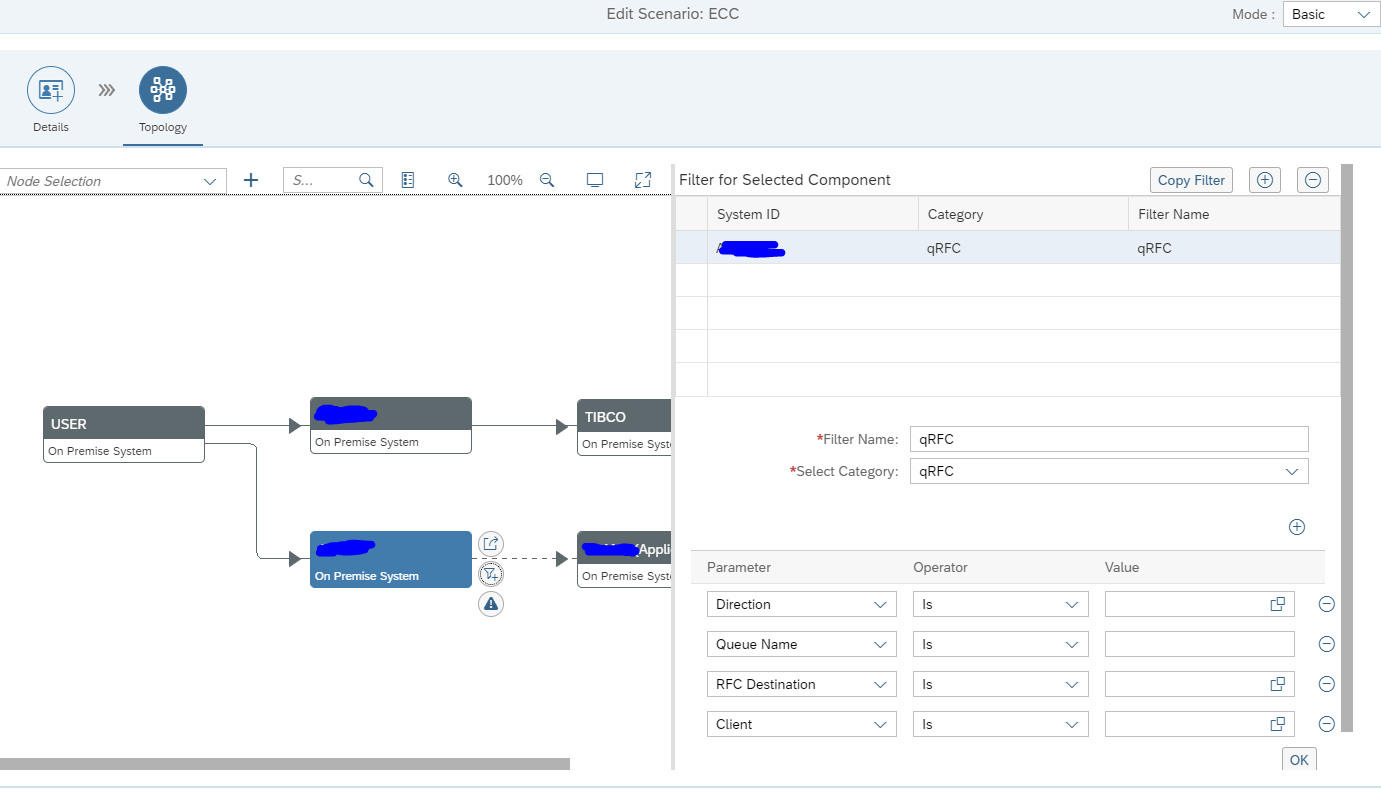
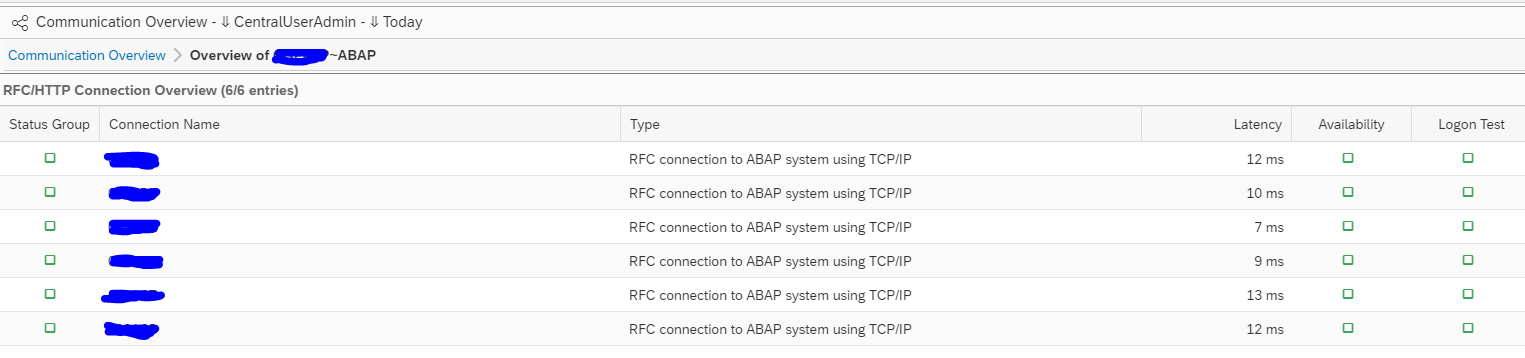
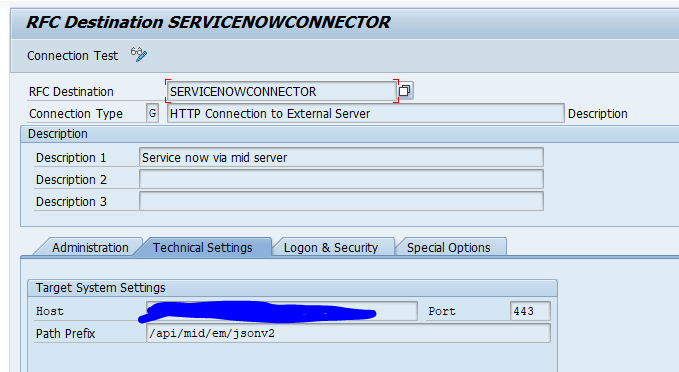
Set up the RFC destination

In SM59 setup the RFC connection towards the MID server as type H RFC connection:

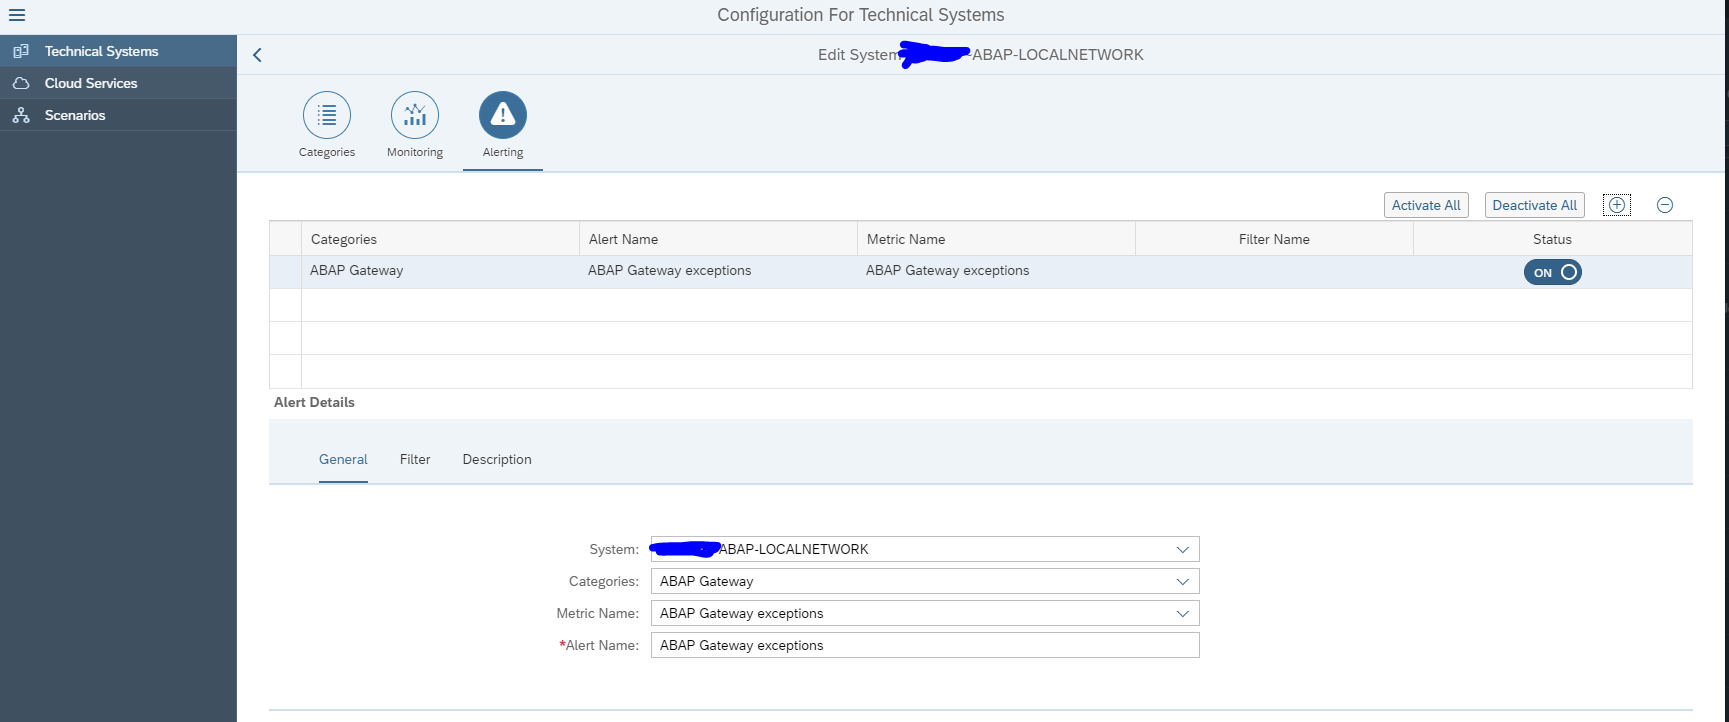
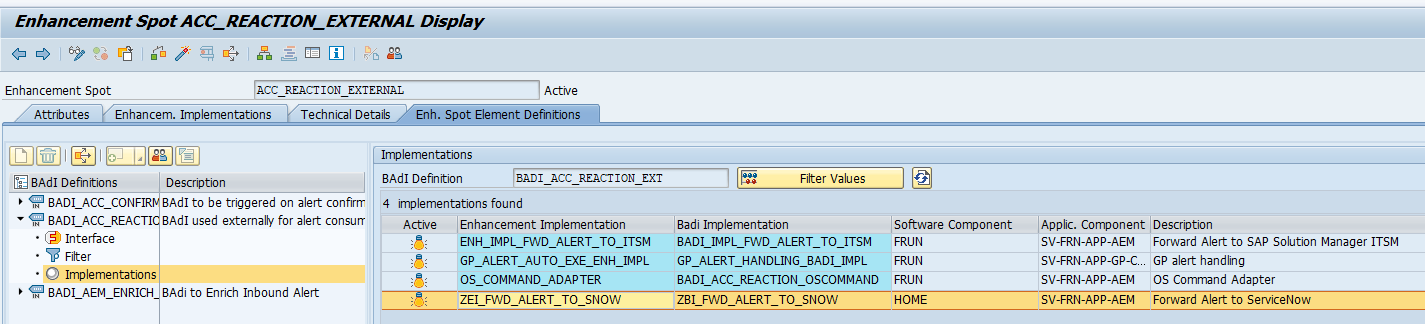
Activation of the enhancement spot and BADI

The details of the enhancement spot and BADI implementation are in the SAP document published on the SAP Focused Run Expert Portal.

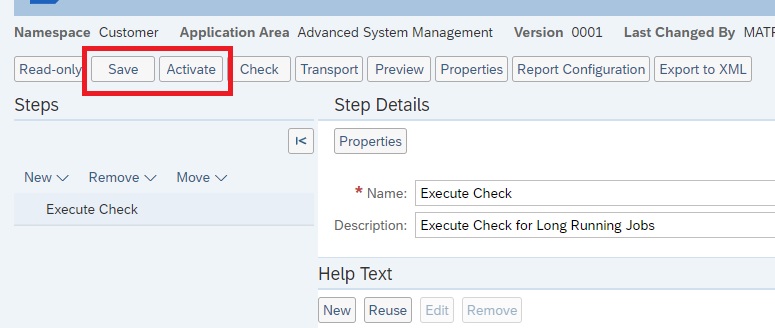
Use transaction SE18 or SE80 to activate enhancement spot ACC_REACTION_EXTERNAL and then activate BADI BADI_ACC_REACTION_EXT.

The result looks as follows:

Double click on the implementation:

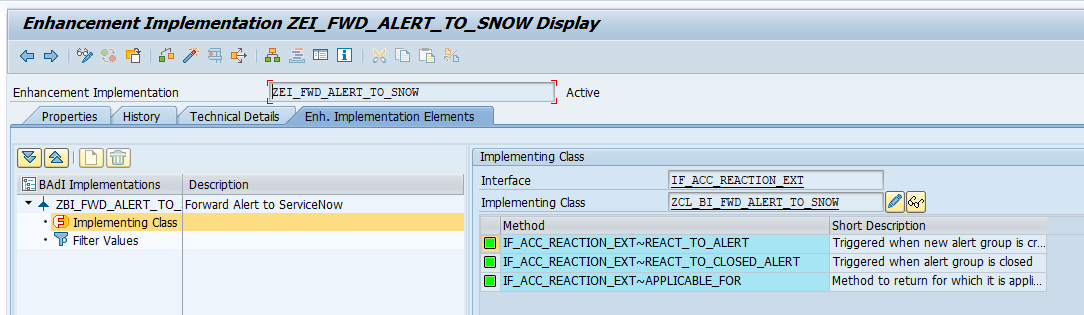
Double click on the REACT_TO_ALERT interface to go to the code. The code we implemented looks as below:

METHOD if_acc_reaction_ext~react_to_alert.     
  IF is_alert-ref->get_type( ) <> 'ALERT'.       
    RETURN.     
  ENDIF.     
" Init. the application log.     
  me->zgo_logger = NEW zcl_snow_bi_logger( ). " Add info message to notify reaction was triggered     
  me->zgo_logger->bal_log_add_message(       
    EXPORTING 
       ziv_msgty = zif_snow_constants=>zgc_message_types-info        ziv_msgno = '002'     
     ).     
" Send message to service now     
  NEW zcl_snow_bi_common( )->zif_snow_bi_common~send_message_to_snow(     EXPORTING         
      zii_logger       = me->zgo_logger       
      zii_snow_message = NEW zcl_snow_event_message( zii_alert = is_alert-ref  )
      ziv_resolution_state = zif_snow_constants=>zgc_resolution_state-new     ).     
" Save the application log     
  me->zgo_logger->bal_log_save( ).   
ENDMETHOD.

What do we do in the code:

  1. We only react on type ALERT
  2. We make an entry in the application log (so we can check later on in SLG1)
  3. We call the actual interface which we have implemented in class ZCL_SNOW_BI_COMMON class

The implementation code

The sending code in method ZIF_SNOW_BI_COMMON~SEND_MESSAGE_TO_SNOW that was just called looks as follows:

  METHOD zif_snow_bi_common~send_message_to_snow.

    " Retrieve JSON body for the request
    DATA(zlv_snow_event_json) = zii_snow_message->get_json( ziv_resolution_state ).

    me->add_json_to_bal_log( EXPORTING zii_logger   = zii_logger
                                       ziv_json     = zlv_snow_event_json ).


    TRY.
        " Execute HTTP Post, send data to the MiD API
        DATA(zlv_http_status_code) = NEW zcl_snow_mid_api( )->post( ziv_event_messages = zlv_snow_event_json ).

        " Add HTTP response code to the log..
        IF zlv_http_status_code-code >= 200 AND zlv_http_status_code-code < 300.
          DATA(zlv_msgty) = zif_snow_constants=>zgc_message_types-success.
        ELSE.
          zlv_msgty = zif_snow_constants=>zgc_message_types-error.
        ENDIF.

        zii_logger->bal_log_add_message(
           EXPORTING
             ziv_msgty = zlv_msgty
             ziv_msgno = '001'
             ziv_msgv1 = |{ zlv_http_status_code-code } { zlv_http_status_code-reason }|
         ).

      CATCH zcx_snow_mid_api INTO DATA(zlo_exception).
        "Add exception to the application log
        zii_logger->bal_log_add_message(
          EXPORTING
            ziv_msgid = zlo_exception->if_t100_message~t100key-msgid
            ziv_msgno = zlo_exception->if_t100_message~t100key-msgno
            ziv_msgv1 = CONV #( zlo_exception->if_t100_message~t100key-attr1 )
            ziv_msgv2 = CONV #( zlo_exception->if_t100_message~t100key-attr2 )
            ziv_msgv3 = CONV #( zlo_exception->if_t100_message~t100key-attr3 )
            ziv_msgv4 = CONV #( zlo_exception->if_t100_message~t100key-attr4 )
        ).
    ENDTRY.

  ENDMETHOD.

What happens here:

  1. Data object is build in the data definition (details follow below)
  2. This is logged
  3. The actual call is performed by calling class ZCL_SNOW_MID_API (details follow below)
  4. The result is checked (200 is http code for Ok)
  5. Error result is logged in case of issues

The code for the message content

For the message content, we first define the message event type:

INTERFACE zif_snow_message
  PUBLIC .

  TYPES:
    BEGIN OF zgts_event,
      "! Source
      source           TYPE string,
      "! Name of the object
      node             TYPE string,
      "! Type of object, host, instance
      type             TYPE string,
      "! Severity
      severity         TYPE string,
      "! Date/Time(YYYY-MM-DD HH:MM:SS)
      time_of_event    TYPE string,
      "! Alert description/name
      description      TYPE string,
      "! SAP System ID
      event_class      TYPE string,
      "! Unique ID
      message_key      TYPE string,
      "! Alert state
      resolution_state TYPE string,
      "! Resource
      resource         TYPE string,
    END OF zgts_event.

  METHODS get_json  IMPORTING ziv_resoultion_state TYPE string
                    RETURNING VALUE(zrv_json)      TYPE /ui2/cl_json=>json.

ENDINTERFACE.

This event is used in the actual message build code:

  METHOD zif_snow_message~get_json.

    DATA zlv_events TYPE /ui2/cl_json=>json.

    " Get current time stamp
    GET TIME STAMP FIELD DATA(zlv_time_stamp_now).

    DATA(zlv_event_json) = /ui2/cl_json=>serialize(
      EXPORTING
        data        =  VALUE zif_snow_message~zgts_event(
          source              = |{ syst-sysid } - FRUN |
          node                = zgi_alert->get_managed_object_name( )
          type                = zgi_alert->get_managed_object_type( )
          severity            = me->convert_severity( zgi_alert->get_severity( ) )
          time_of_event       = me->convert_alert_timestamp( ziv_timestamp = zlv_time_stamp_now )
          description         = COND #( LET custom_description = me->remove_html_tags( zgi_alert->get_custom_description( ) ) IN
                                        WHEN strlen( custom_description ) > 0 THEN custom_description
                                        ELSE me->remove_html_tags( zgi_alert->get_sap_description(  ) ) )
          event_class         = substring( val = zgi_alert->get_managed_object_name( ) off = 0 len = 3 )
          message_key         = zgi_alert->get_type_id( )
          resolution_state    = ziv_resoultion_state
          resource            = zgi_alert->get_name( )
        )
        pretty_name = /ui2/cl_json=>pretty_mode-low_case
    ).

    IF zlv_events IS INITIAL.
      zlv_events = zlv_event_json.
    ELSE.
      zlv_events = zlv_events && ',' && zlv_event_json.
    ENDIF.

    IF zlv_events IS NOT INITIAL.
      zrv_json =  '{ "records": [' && zlv_events && '] }'.
    ENDIF.

  ENDMETHOD.

Simple method codes:

  METHOD if_acc_mea~get_managed_object_name.
    rv_managed_object_name = ms_mea-context_name.
  ENDMETHOD.
  METHOD if_acc_mea~get_managed_object_type.
    rv_managed_object_type = ms_mea-context_type.
  ENDMETHOD.
  METHOD if_acc_mea~get_severity.
    rv_severity = ms_mea-severity.
  ENDMETHOD.
  METHOD convert_alert_timestamp.

    " Convert the timestamp
    CONVERT TIME STAMP ziv_timestamp TIME ZONE 'UTC'
      INTO DATE DATA(zlv_date) TIME DATA(zlv_time)
      DAYLIGHT SAVING TIME DATA(zlv_dls_time).


    zrv_date_time = |{ zlv_date+0(4) }-{ zlv_date+4(2) }-{ zlv_date+6(2) } { zlv_time+0(2) }:{ zlv_time+2(2) }:{ zlv_time+4(2) }|.

  ENDMETHOD.
  METHOD if_acc_mea~get_name.
    rv_name = ms_mea-name.
  ENDMETHOD.
  METHOD if_acc_mea~get_type_id.
    rv_type_id = ms_mea-type_id.
  ENDMETHOD.

Helper method to remove HTML tags:

  METHOD remove_html_tags.

    IF ziv_description IS INITIAL.
      RETURN.
    ENDIF.

    DATA(zlv_description) = ziv_description.

    DATA(zlv_newline) = cl_abap_char_utilities=>newline.

    REPLACE ALL OCCURRENCES OF '<h2>' IN zlv_description WITH '' IGNORING CASE.
    REPLACE ALL OCCURRENCES OF '</h2>' IN zlv_description WITH '' IGNORING CASE.
    REPLACE ALL OCCURRENCES OF '<strong>' IN zlv_description WITH '' IGNORING CASE.
    REPLACE ALL OCCURRENCES OF '</strong>' IN zlv_description WITH '' IGNORING CASE.
    REPLACE ALL OCCURRENCES OF '<p>' IN zlv_description WITH '' IGNORING CASE.
    REPLACE ALL OCCURRENCES OF '</p>' IN zlv_description WITH zlv_newline IGNORING CASE.
    REPLACE ALL OCCURRENCES OF '<b>' IN zlv_description WITH '' IGNORING CASE.
    REPLACE ALL OCCURRENCES OF '</b>' IN zlv_description WITH '' IGNORING CASE.
    REPLACE ALL OCCURRENCES OF '<u>' IN zlv_description WITH '' IGNORING CASE.
    REPLACE ALL OCCURRENCES OF '</u>' IN zlv_description WITH '' IGNORING CASE.
    REPLACE ALL OCCURRENCES OF '<i>' IN zlv_description WITH '' IGNORING CASE.
    REPLACE ALL OCCURRENCES OF '</i>' IN zlv_description WITH '' IGNORING CASE.
    REPLACE ALL OCCURRENCES OF '<ul>' IN zlv_description WITH '' IGNORING CASE.
    REPLACE ALL OCCURRENCES OF '</ul>' IN zlv_description WITH '' IGNORING CASE.
    REPLACE ALL OCCURRENCES OF '<li>' IN zlv_description WITH '' IGNORING CASE.
    REPLACE ALL OCCURRENCES OF '</li>' IN zlv_description WITH zlv_newline IGNORING CASE.
    REPLACE ALL OCCURRENCES OF '<a href="' IN zlv_description WITH '' IGNORING CASE.
    REPLACE ALL OCCURRENCES OF REGEX '">[A-Za-z0-9_\~\-+=&[:space:]]*</a>' IN  zlv_description WITH '' IGNORING CASE.

    REPLACE ALL OCCURRENCES OF ' ' IN zlv_description WITH '_'  IGNORING CASE.
    REPLACE ALL OCCURRENCES OF ':' IN zlv_description WITH ':'     IGNORING CASE.

    zrv_desription = zlv_description.


  ENDMETHOD.

Method to convert severity:

  METHOD convert_severity.

    CASE ziv_sm_severity.
      WHEN 1 OR 2 OR 3 OR 4.
        zrv_sn_severity = 5. " Info
      WHEN 5.
        zrv_sn_severity = 4. " Warning
      WHEN 6.
        zrv_sn_severity = 3. " Minor
      WHEN 7.
        zrv_sn_severity = 2. " Major
      WHEN 8 OR 9.
        zrv_sn_severity = 1. " Critical
      WHEN OTHERS.
        zrv_sn_severity = 0. " Clear
    ENDCASE.

  ENDMETHOD.

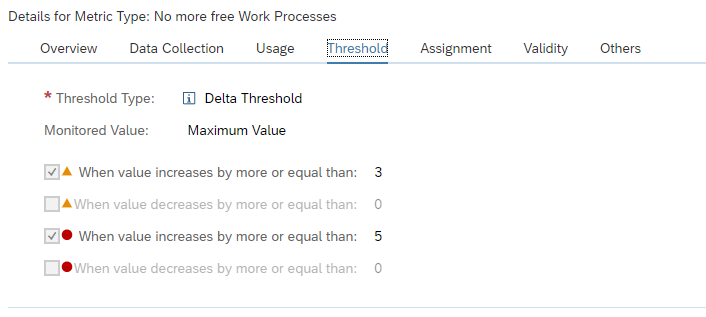
This method convert the SAP Focused Run severity code from 1 to 9 towards the codes in ServiceNow. Adjusts the codes per your requirement.

The sending code

The sending code is as follows (for more details on ABAP REST calls, read this blog):

  METHOD post.

    " Initialize the HTTP client
    me->init_http_client( ).

    " Set header
    me->zgo_http_client->request->set_method( method = me->zgo_http_client->request->co_request_method_post ).

    me->zgo_http_client->request->set_content_type( content_type = zgc_content_type ).

    " Set body
    me->zgo_http_client->request->set_cdata( EXPORTING data = ziv_event_messages ).

    " Send the data (POST)
    me->send( ).

    " Receive the response; needed to get the http status code
    me->receive( ).

    " Get the status code
    me->zgo_http_client->response->get_status(
      IMPORTING
        code   = zrs_status-code      " HTTP status code
        reason = zrs_status-reason    " HTTP status description
    ).

  ENDMETHOD.

Subimplementations of the methods:

  METHOD init_http_client.

    cl_http_client=>create_by_destination(
      EXPORTING
        destination              = zgc_destination      " Logical destination (specified in function call)
      IMPORTING
        client                   = me->zgo_http_client  " HTTP Client Abstraction
      EXCEPTIONS
        argument_not_found       = 1
        destination_not_found    = 2
        destination_no_authority = 3
        plugin_not_active        = 4
        internal_error           = 5
        OTHERS                   = 6
    ).

    IF sy-subrc NE 0.
      me->raise_exception_for_sys_msg( ).
    ENDIF.

  ENDMETHOD.
  METHOD send.

    me->zgo_http_client->send(
      EXCEPTIONS
        http_communication_failure = 1
        http_invalid_state         = 2
        http_processing_failed     = 3
        http_invalid_timeout       = 4
        OTHERS                     = 5
    ).

    IF sy-subrc NE 0.
      me->raise_exception_for_sys_msg( ).
    ENDIF.

  ENDMETHOD.
  METHOD receive.

    me->zgo_http_client->receive(
      EXCEPTIONS
        http_communication_failure = 1
        http_invalid_state         = 2
        http_processing_failed     = 3
        OTHERS                     = 4
    ).

    IF sy-subrc NE 0.
      me->raise_exception_for_sys_msg( ).
    ENDIF.

  ENDMETHOD.
  METHOD raise_exception_for_sys_msg.

    RAISE EXCEPTION TYPE zcx_snow_mid_api
      EXPORTING
        textid = VALUE scx_t100key(
                      msgid = syst-msgid
                      msgno = syst-msgno
                      attr1 = syst-msgv1
                      attr2 = syst-msgv2
                      attr3 = syst-msgv3
                      attr4 = syst-msgv4
                  ).

  ENDMETHOD.

What is important here is that in the constant ZGC_DESTINATION is the definition of the H type RFC destination towards the midserver.

Helper code: zcl_snow_event_message

Method ZIF_SNOW_MESSAGE~GET_JSON with input ZIV_RESOULTION_STATE type STRING and returning ZRV_JSON type /UI2/CL_JSON=>JSON, code:

  METHOD zif_snow_message~get_json.

    DATA zlv_events TYPE /ui2/cl_json=>json.

    " Get current time stamp
    GET TIME STAMP FIELD DATA(zlv_time_stamp_now).

    DATA(zlv_event_json) = /ui2/cl_json=>serialize(
      EXPORTING
        data        =  VALUE zif_snow_message~zgts_event(
          source              = |{ syst-sysid } - FRUN |
          node                = zgi_alert->get_managed_object_name( )
          type                = zgi_alert->get_managed_object_type( )
          severity            = me->convert_severity( zgi_alert->get_severity( ) )
          time_of_event       = me->convert_alert_timestamp( ziv_timestamp = zlv_time_stamp_now )
          description         = COND #( LET custom_description = me->remove_html_tags( zgi_alert->get_custom_description( ) ) IN
                                        WHEN strlen( custom_description ) > 0 THEN custom_description
                                        ELSE me->remove_html_tags( zgi_alert->get_sap_description(  ) ) )
          event_class         = substring( val = zgi_alert->get_managed_object_name( ) off = 0 len = 3 )
          message_key         = zgi_alert->get_type_id( )
          resolution_state    = ziv_resoultion_state
          resource            = zgi_alert->get_name( )
        )
        pretty_name = /ui2/cl_json=>pretty_mode-low_case
    ).

    IF zlv_events IS INITIAL.
      zlv_events = zlv_event_json.
    ELSE.
      zlv_events = zlv_events && ',' && zlv_event_json.
    ENDIF.

    IF zlv_events IS NOT INITIAL.
      zrv_json =  '{ "records": [' && zlv_events && '] }'.
    ENDIF.

  ENDMETHOD.

Method Constructor with input ZII_ALERT type IF_ACC_MEA, code:

  METHOD constructor.

    me->zgi_alert = zii_alert.

  ENDMETHOD.

Method CONVERT_ALERT_TIMESTAMP input ZIV_TIMESTAMP type TIMESTAMP, returning ZRV_DATE_TIME type STRING. Code:

  METHOD convert_alert_timestamp.

    " Convert the timestamp
    CONVERT TIME STAMP ziv_timestamp TIME ZONE 'UTC'
      INTO DATE DATA(zlv_date) TIME DATA(zlv_time)
      DAYLIGHT SAVING TIME DATA(zlv_dls_time).


    zrv_date_time = |{ zlv_date+0(4) }-{ zlv_date+4(2) }-{ zlv_date+6(2) } { zlv_time+0(2) }:{ zlv_time+2(2) }:{ zlv_time+4(2) }|.

  ENDMETHOD.

Method CONVERT_SEVERITY input ZIV_SM_SEVERITY type AC_SEVERITY, returning ZRV_SN_SEVERITY type INT4. Code:

  METHOD convert_severity.

    CASE ziv_sm_severity.
      WHEN 1 OR 2 OR 3 OR 4.
        zrv_sn_severity = 5. " Info
      WHEN 5.
        zrv_sn_severity = 4. " Warning
      WHEN 6.
        zrv_sn_severity = 3. " Minor
      WHEN 7.
        zrv_sn_severity = 2. " Major
      WHEN 8 OR 9.
        zrv_sn_severity = 1. " Critical
      WHEN OTHERS.
        zrv_sn_severity = 0. " Clear
    ENDCASE.

  ENDMETHOD.

Method REMOVE_HTML_TAGS, input ZIV_DESCRIPTION type STRING, returning ZRV_DESRIPTION type STRING. Code:

  METHOD remove_html_tags.

    IF ziv_description IS INITIAL.
      RETURN.
    ENDIF.

    DATA(zlv_description) = ziv_description.

    DATA(zlv_newline) = cl_abap_char_utilities=>newline.

    REPLACE ALL OCCURRENCES OF '<h2>' IN zlv_description WITH '' IGNORING CASE.
    REPLACE ALL OCCURRENCES OF '</h2>' IN zlv_description WITH '' IGNORING CASE.
    REPLACE ALL OCCURRENCES OF '<strong>' IN zlv_description WITH '' IGNORING CASE.
    REPLACE ALL OCCURRENCES OF '</strong>' IN zlv_description WITH '' IGNORING CASE.
    REPLACE ALL OCCURRENCES OF '<p>' IN zlv_description WITH '' IGNORING CASE.
    REPLACE ALL OCCURRENCES OF '</p>' IN zlv_description WITH zlv_newline IGNORING CASE.
    REPLACE ALL OCCURRENCES OF '<b>' IN zlv_description WITH '' IGNORING CASE.
    REPLACE ALL OCCURRENCES OF '</b>' IN zlv_description WITH '' IGNORING CASE.
    REPLACE ALL OCCURRENCES OF '<u>' IN zlv_description WITH '' IGNORING CASE.
    REPLACE ALL OCCURRENCES OF '</u>' IN zlv_description WITH '' IGNORING CASE.
    REPLACE ALL OCCURRENCES OF '<i>' IN zlv_description WITH '' IGNORING CASE.
    REPLACE ALL OCCURRENCES OF '</i>' IN zlv_description WITH '' IGNORING CASE.
    REPLACE ALL OCCURRENCES OF '<ul>' IN zlv_description WITH '' IGNORING CASE.
    REPLACE ALL OCCURRENCES OF '</ul>' IN zlv_description WITH '' IGNORING CASE.
    REPLACE ALL OCCURRENCES OF '<li>' IN zlv_description WITH '' IGNORING CASE.
    REPLACE ALL OCCURRENCES OF '</li>' IN zlv_description WITH zlv_newline IGNORING CASE.
    REPLACE ALL OCCURRENCES OF '<a href="' IN zlv_description WITH '' IGNORING CASE.
    REPLACE ALL OCCURRENCES OF REGEX '">[A-Za-z0-9_\~\-+=&[:space:]]*</a>' IN  zlv_description WITH '' IGNORING CASE.

    REPLACE ALL OCCURRENCES OF ' ' IN zlv_description WITH '_'  IGNORING CASE.
    REPLACE ALL OCCURRENCES OF ':' IN zlv_description WITH ':'     IGNORING CASE.

    zrv_desription = zlv_description.


  ENDMETHOD.

Helper code: zcl_snow_bi_logger

Exception class ZCX_SNOW_MID_API as redefinition of CX_ROOT with re-implementation of constructor; inputs TEXTID type F_T100_MESSAGE=>T100KEY and PREVIOUS type PREVIOUS.

Code:

  METHOD constructor ##ADT_SUPPRESS_GENERATION.

    CALL METHOD super->constructor
      EXPORTING
        previous = previous.

    CLEAR me->textid.

    IF textid IS INITIAL.
      if_t100_message~t100key = if_t100_message=>default_textid.
    ELSE.
      if_t100_message~t100key = textid.
    ENDIF.

  ENDMETHOD.

Helper class zcl_snow_bi_logger.

Method: ZIF_SNOW_BI_LOGGER~BAL_LOG_SAVE:

 METHOD zif_snow_bi_logger~bal_log_save.

    IF me->zgo_bal_log IS BOUND.

      me->zgo_bal_log->save( ziv_commit = abap_true ).

    ENDIF.

  ENDMETHOD.

Method: ZIF_SNOW_BI_LOGGER~BAL_LOG_ADD_EXCEPTION

Import parameter: ZIX_SNOW_EXCEPTION type ref to ZCX_SNOW_MID_API

Code:

  METHOD zif_snow_bi_logger~bal_log_add_message.

    IF me->zgo_bal_log IS BOUND.

      me->zgo_bal_log->add_message(
        EXPORTING
          ziv_msgty = ziv_msgty
          ziv_msgid = ziv_msgid
          ziv_msgno = ziv_msgno
          ziv_msgv1 = ziv_msgv1
          ziv_msgv2 = ziv_msgv2
          ziv_msgv3 = ziv_msgv3
          ziv_msgv4 = ziv_msgv4
      ).

    ENDIF.

  ENDMETHOD.

Method: ZIF_SNOW_BI_LOGGER~BAL_LOG_ADD_FREE_TEXT

Inputs ZIV_MSGTY type SYMSGTY and ZIV_TEXT type ZCL_BC_BAL_LOG=>ZGTV_FREE_TEXT “(which is TYPES zgtv_free_text TYPE c LENGTH 200) .

Source:

  METHOD zif_snow_bi_logger~bal_log_add_free_text.

    IF me->zgo_bal_log IS BOUND.

      me->zgo_bal_log->add_free_text(
        EXPORTING
          ziv_msgty = ziv_msgty
          ziv_text  = ziv_text
      ).

    ENDIF.

  ENDMETHOD.

Constructor code:

  METHOD constructor.

    me->zgo_bal_log = zcl_bc_bal_log=>factory(
        ziv_object     = zif_snow_constants=>zgc_bal_log-object
        ziv_sub_object = zif_snow_constants=>zgc_bal_log-sub_object
    ).

  ENDMETHOD.

Using the ServiceNow web services

The ServiceNow webservices including instructions on how to download the WSDL are published on the ServiceNow help web pages.

Download the WSDL file and follow the instructions from this blog to import the WSDL file inso SE80 and generate the ABAP web service proxy object. In SOAMANAGER setup the logical port towards your ServiceNow installation and make sure the connection is working.

Then implement the ABAP code as above.

In stead of calling the REST service, you now call the ABAP proxy generated:

* Data Declarations
DATA: zcl_proxy TYPE REF TO zco_zbapidemowebservice, " Proxy Class
      zdata_in  TYPE zzbapidemo, " Proxy Input
      zdata_out TYPE zzbapidemoresponse, " Proxy Output
      zfault    TYPE REF TO cx_root. " Generic Fault

* Instantiate the proxy class providing the Logical port name
CREATE OBJECT zcl_proxy EXPORTING logical_port_name = 'ZDEMOWS'.

* Set Fixed Values
zdata_in-zimport = '1'.

TRY .
    zcl_proxy->zbapidemo( EXPORTING input = zdata_in
                          IMPORTING output = zdata_out ).
    WRITE: / zdata_out-zexport.
  CATCH cx_root INTO zfault.
* here is the place for error handling

ENDTRY.

Off course you will use the generated in and out data from the generated service.

<< This blog was originally posted on SAP Focused Run Guru by Frank Umans. Repost done with permission. >>

SAP Focused Run system analysis overview

System analysis is part of the Root Cause analysis functions of Focused Run. It can be used for issues analysis of current issues and for longer term trending.

Questions that will be answered in this blog are:

  • How can I start execute System Analysis for a system?
  • Which type of systems can be analysed with System Analysis?
  • How can I use the System Analysis tool for immediate analysis of issues with a system?
  • How can I use the System Analysis tool for getting insight in the longer term trends inside a system?
  • How to set up System Analysis for performance analysis?

System analysis

Start the system analysis function by clicking on the Fiori tile for System Analysis:

Select the system you need to analyze for issues in the scope selection screen. In the first case we take an ABAP stack with time frame of the last 6 hours:

This overview might be bit overwhelming the first time. But you can see the performance was bad in the middle of the day (see top middle graph on average response time). Bottom middle graph shows CPU of some application servers was at 100%. And at the same time there were many dumps (right middle graph). This gives a clear direction were to look for issues.

The system analysis overview adjusts the information automatically to its content. This is the information for a HANA system:

Note here that the time frame here is from the last month. This is for getting longer term overview of the system behaviour. You can get this longer term overview by changing the time frame of the system analysis tool.

Page catalog

You can select a specific view from the page catalog list on the left button bar on the screen:

So you can easily filter the specific page for the type of system you need to analyze.

Performance analysis in System Analysis

In the system analysis function there is a special function to monitor system performance based on ST03 system data from the managed system.

Choose the menu option for ABAP performance:

The performance overview will now open:

You can click on many items now to get to the details.

Setup of Performance Analysis

To make the above function work;, click on the settings wheel and click on the Configure Collection of ABAP performance data:

Make sure the system you need analysis data from is activated correctly.

If the data collection is not ok, check the Collector Status button and Agent logs. Also check the backend system user used to see if this user has sufficient authorization to fetch the required data.

<< This blog was originally posted on SAP Focused Run Guru by Frank Umans. Repost done with permission. >>

SAP Focused Run license and usage

SAP Focused Run is a licensed product. The metric is amount of GB stored in the application.

If you have more systems, more detailed metrics, with short measurement times and many functions, the more GB you will use.

Questions that will be answered in this blog are:

  • How to check the current license usage?
  • What drives the usage?
  • How can I get a cost estimate?
  • How can I create a business case for Focused Run?

Checking the license usage

In SE38 start program FRUN_USAGE_UPDATE:

Now you can see which Focused Run function uses how many MB’s.

Read this note that explains the slower clean up on system analysis data: 3478938 – Housekeeping of System Analysis data in SAP Focused Run.

What drives the usage?

Usage is driven by:

Getting a cost estimate

Your SAP account manager or the Focused Run team in Germany can give you a good cost estimate. Material number for Focused Run in the price list is 7019453.

Input for cost estimate: sizes and numbers of systems, functions of Focused Run you want to deploy, and the retention period of the data.

Output: cost estimate.

Creating the business case

The business case has 2 aspects:

  • Cost: infrastructure, license, implementation
  • Benefits

Benefits is easier to quantify if your IT service is more mature.

Elements to consider:

  • How much does an hour of outage cost on your main ECC or S4HANA core system? For lager companies, this is easily 10.000 Euro per hour or more.
  • How much does your complaint handling cost per ticket?
  • How much time is currently spent on manual monitoring?

Benefits of SAP Focused Run are then in avoiding half the outages by faster insights and reducing the outage costs. You cannot avoid all outages, but you can act faster.

Benefits of Focused Run are in improved clean up and issue solving. This will both reduce issues in your systems and reduce complaints and tickets you need to handle.

For larger system landscapes (more than 50 systems) the business case is quite easy to create and will be positive fast.

<< This blog was originally posted on SAP Focused Run Guru by Frank Umans. Repost done with permission. >>

SAP Focused Run interface monitoring overview

The integration and cloud monitoring function of SAP Focused Run consists of 2 main functions:

  • Interface monitoring between SAP systems
  • Cloud monitoring between on premise and cloud SAP products (see blog)

This blog will give an overview of the interface monitoring between SAP systems.

Questions that will be answered in this blog are:

  • How does the interface monitoring in SAP Focused Run look like?
  • How much details and history can I see in SAP Focused Run interface monitoring?
  • How can I enable my systems for interface monitoring?
  • How do I set up a scenario to monitor?
  • How do I setup alerting for an interface scenario?
  • How do I setup Idoc monitoring?
  • How do I setup ODATA monitoring?
  • How do I setup qRFC monitoring?
  • How do I setup webservice monitoring?
  • How do I setup RFC monitoring?
  • How do I setup SLT monitoring?

Interface monitoring

To start the interface monitoring click on the Fiori tile:

In the next screen you now select one or multiple integration scenario’s:

Then you reach the scenario overview screen:

You can immediately see with the red colored scenario’s that there is an issue.

Click on the red scenario to open the details of the scenario topology:

The topology indicates most of the interfaces are correct. To see the detailed issue, click on the red line:

Click on the red error for the details:

On the right side of the you can click on the Dashboard icon to get an historical overview:

Link with alert management

Interface errors can be the trigger for an alert in the Alert Management function.

Technical scenario setup

e concept for interface monitoring is unfortunately a bit confusing at first.

There are 2 main things to remember:

  1. Systems data collection and alerting: this is where the action happens
  2. Graphical representation: this is where you make it visible

Unfortunately this means you have to do lot of double work.

Set up systems

Go to the Integration and cloud monitoring Fiori tile. On top right click on the configuration icon to change or add a scenario:

First add the systems:

Select the system:

Select the configuration categories:

Select the monitoring:

Here you must add the connections you want to monitor.

The alerting configuration is empty initially:

We will fill this later if we want alerts for a specific interface connection.

Save this system and repeat for the rest of the systems.

The system determines the actual data collection and actual alerting. The system can be re-used in multiple scenarios.

Scenario configuration

On the configuration screen now add the new scenario. Add a name and description for the scenario:

In the topology screen now add the systems in the drop down for Node Selection and use the + icon to add them to the screen:

Now select the source system (we will have 1 CUA central and 2 child systems) and select the Action box:

Select Add link to and then select the system.

Now add a filter to the link by clicking on the line:

In the dialog screen on the right now add the details:

Start by giving the group a name. Now add the filter. Give the filter a name (in this case RFC1). Select the central component and the category (in this case Connection monitoring SM59). Now add the RFC connection type (3) and connection name to be monitored.

Very important here: press Ok first to transfer the data. Only then press Save. Otherwise your data is lost. SAP UI is not ok for this area.

Repeat for the second scenario. The end result is that the dotted lines are replaced by straight lines:

Then Save.

The scenario is active now:

Reminder: you did have to add the same information in the system level as well in the Technical System as well: this will perform the data collection itself. If this is not done, then the scenario overview will show grey results for missing data collection.

The scenario is used to make the interfaces graphically visible.

Adding alert

When you have monitored the scenario long enough to see it is stable, the next step is to setup alerting so you get notified in the central alert inbox.

First add the alert in the Technical System as shown above. This will be the actual alert definition.

To add an alert to the graphical overview, go to the scenario definition and select the source system. Press the button alerts for component:

On the right hand side now add the alert by clicking the + button:

Then select the wanted Alert Category. And select the filter options. Add the connections for which you want to alert:

Give the filter also a name.

On the Description field you can set the alert to active:

You can also set the frequency of checking, and if an notification is to be send as well (via mail or towards outbound connector).

Also important here: first press Ok, then Save. Otherwise the data is lost. 

Set up Summary and final check

After you have finished the graphical topology, you need to go back to the Systems overview to validate if everything is activated ok for both monitoring and alerting:

Reminder: there is a split in graphical representation in the topology and scenarios and the actual system monitoring and alerting in the Technical System overview.

Interfaces that can be monitored

Full list of interfaces that can be monitored is published on the Focused Run expert portal.

Specific interface monitoring topics are explained below:

  • Idoc monitoring
  • ODATA Gateway monitoring
  • qRFC monitoring
  • RFC monitoring
  • SLT monitoring
  • Web Service monitoring

Idoc monitoring

SAP Focused Run can both report on idoc errors and delays in idoc processing. Delay in idoc processing can cause business impact and is sometimes hard to detect, since the idocs are in status 30 for outbound, or 64 for inbound, but are not processed. SAP Focused Run is one of the only tools I know which can alert on delays of idoc processing.

The monitoring starts with the Integration & Cloud monitoring tile. Then select the modelled idoc scenario (modeling is explained later in this blog):

On the alert ticker you can already see there are alerts for both idocs in error, but also alerts for idocs in delay:

In the main overview screen click on the interface line to get the overview of idocs sent:

You can now see the amount of idocs that were sent successfully, which are still in transit and which ones are in error. Click on the number to zoom in:

Click on the red error bar to zoom in further to the numbers:

Click on the idoc number to get further details:

Unfortunately, you cannot jump from SAP Focused Run into the managed system where the idoc error occurred.

Documents monitor for idocs

A different view on the idocs can be done using the documents monitor. You can select the documents monitor tool on the left side of the screen:

Now you goto the overview:

You can click on the blue numbers to dive into the details. Or you can click the Dashboards icon top right of the card to go into the dashboard mode:

This will show you the summary over time and per message type. Clicking on the bars will again bring you to the details.

Data collection and alerting setup for idoc monitoring

In the configuration for interface monitoring in the Technical System settings, goto the monitoring part and activate the data collection for Idoc monitoring:

In the monitoring filter, you can restrict the data collection to certain idoc types, receivers, senders, etc. Or leave all entries blank to check every idoc:

The graphical modelling for idocs is similar to the explanation of the example above.

Alerting for idoc errors

First alert we set up is the alert for errors.

Create a new alert and select the alert for idocs in status ERROR for longer than N minutes:

Now we add the filter. In our case we filter on outbound idocs of type DESADV:

A bit hidden at the bottom of this screen is the setting for the N for the minutes:

The time setting is depending on your technical setup of idoc reprocessing jobs (see for example this blog), and the urgency of the idocs for your business.

In the description tab add the notification variant in case you want next to the FRUN alert also mail to be sent (setup is explained in this blog).

You can set up multiple alerts. This means you can have different notification groups for different message types, different directions, different receiving parties.

Save the filter and make sure it is activated.

Idoc alert for backlog

Next to alerting on errors, Focused Run can also alert on delay of idocs. This can be done for both inbound and outbound idocs.

To set up an alert for backlog choose the option idocs in status BACKLOG for longer than N minutes:

In the filter tab set the idoc filter and at the bottom fill out the value for N minutes of backlog that should be alerted:

And in the final tab set the notification variant if wanted:

Save the filter and make sure it is activated.

Definition of delayed and error idocs

On the SAP Focused Run expert portal on idocs, there is this definition of the determination of idocs in delay and error:

Data clean up idoc monitoring

If you get too much data for idoc monitoring, apply OSS note 3241688 – Category wise table cleanup report (IDOC, PI). This note delivers program /IMA/TABLE_CLEANUP_REPORT for clean up.

ODATA gateway monitoring

We assume in this use case that end users are using the ODATA in FIORI apps. In case ODATA is consumed by external applications like Tibco, Mulesoft, Mendix, etc., you have to replace USER with the corresponding application.

Model end users in LMDB

Before we can start the scenario modelling, we first need to model the end users in LMDB as a Unspecific Standalone Application System), just like we did for TIBCO in this blog.

Name the ‘system’ USER:

Make sure the status is Active.

Add this new system USER to the Technical System list in the Integration Monitoring setup.

The system will be display only.

Data collection and alerting setup for ODATA interfaces

In the configuration for interface monitoring in the Technical System settings, goto the monitoring part and activate the data collection for Gateway Errors:

In the monitoring settings, you can filter on specific items if wanted, or leave everything blank to report on any error:

In the tab alerting setup the alerting:

The filter for monitoring and alerting can be different. It cloud be you want to monitor all errors, but only activate specific important ones.

Save your monitoring data collection and alerting settings.

Graphical modelling of ODATA interfaces

In the graphical modelling add the backend system and the system created for USER:

Now add the link starting with USER towards the backend system:

Save your changes.

Also here: first scroll down to see the OK button. Press first OK before pressing Save, or you might loose the data and have to re-enter it. This it bit annoying in the UI.
Monitoring usage of ODATA interfacing

The end result in operations looks as follows:

In the graphical overview click on the red line. The screen with the exceptions opens. Click on the red number to see the overview:

Here you can see the trends and zoom into the specific errors:

qRFC monitoring

qRFC connections are frequently used in communication from ECC to EWM and SCM systems. For generic tips and tricks for qRFC handling, read this blog.

OSS notes for bug fixing qRFC monitoring

Please make sure bug fix OSS note 3014667 – Wrong parameter for QRFC alerts is applied before starting with qRFC monitoring.

Other OSS notes:

Data collection and alerting setup for qRFC monitoring

In the configuration for interface monitoring in the Technical System settings, goto the monitoring part and activate the data collection for qRFC Errors:

In the monitoring settings, you can filter on specific queues, direction and RFC name, or leave everything blank to report on everything:

In the alerting part check you can choose between age of qRFC entries and number of entries:

And set the filters for which ones, and the metric threshold for CRITICAL errors:

The filter for monitoring and alerting can be different. It could be you want to monitor all errors, but only activate specific important ones.

Save your monitoring data collection and alerting settings.

Queued RFC’s are normally back and forth between 2 systems. If this is the case you have to make the settings for both systems.

Graphical modelling of qRFC interfaces

In the graphical modelling add the filter between two systems for the qRFC monitoring:

Also here: first scroll down to see the OK button. Press first OK before pressing Save, or you might loose the data and have to re-enter it. This it bit annoying in the UI.

Queued RFC’s are normally back and forth between 2 systems. If this is the case you have to make the settings for both systems. You model first one direction and then model the direction back:

Monitoring qRFC usage

The end result in operations looks as follows:

You can see here qRFC is modelled back and forth between 2 systems. The blue line indicates messages in process. The red line is clicked on. Here you can see both messages in process and errors. Click on the red error number gives the details:

Monitoring RFC’s between SAP systems

RFC’s with fixed user ID

See the example above on CUA idoc monitoring.

Trusted RFC’s

If you have to setup an RFC monitoring for a trusted RFC (for example between Netweaver Gateway system and ECC system), then you have to take care of the user ID’s and rights. The system from which the SM59 test will run, will use that Focused Run user ID to log on to the other system. If your user ID’s are unique for each system you have to create the user ID in the other systems with the rights to be able to execute a ping and logon for the test.

End result RFC checks

The end results of the RFC is list of RFC’s with the latency time, availability and logon test overview:

Transactional RFC towards external system

To monitor transactional RFC (type T) towards an external system like TIBCO, Mulesoft, etc, you first need to model the external system in the LMDB. To do this goto the LMDB maintenance Fiori app:

Then select Single Customer Network and select the option Technical Systems. In this section choose the Type Unspecific Standalone Application System:

And press Create:

Fill out the details and Save. Make sure the status is Active.

Now the system can be added in the configuration of technical systems in the Interface monitoring configuration:

Now you can model the tRFC interface connection monitoring:

OSS notes for RFC monitoring

Relevant OSS notes:

SLT integration monitoring

This blog focuses specifically on SLT integration monitoring. Monitoring an SLT system itself is explained in this dedicated blog.

Set up SLT integration scenario

Start the integration and exception monitoring FIORI tile:

On the configuration add the SLT system:

Select SLT as specific scenario:

On the Monitoring part you can filter on a specific source system and/or SLT schema:

On the 3rd tab you can set the Alerting in cases of errors:

Now save and activate. The monitoring is active now.

Next step is to use this system in a model for your scenario:

Using the SLT integration monitor

If you open the Fiori tile and you have selected your scenario, you still need to perform an extra click to go to the SLT monitor:

First you get overview of your system(s):

You need to click on the blue numbers to drill down:

This gives overview of errors, source connection status and target connection status.

You cannot drill down further on this tile. If you see an error, you need to go to your SLT server and start transaction LTRO to see all detailed error and start fixing from there. Transaction LTRO can have errors shown that are not visible in transaction LTRC. Focused Run uses LTRO data.

Web service monitoring

Web services monitoring automates the monitoring in transaction SRT_MONI, which is extensively explained in this blog.

This monitoring does not check the connection availability of the web service. To make that happen, you would need to install a custom program from this blog, that writes an entry to SM21. From the SM21 entry, you can create a custom monitoring metric that alerts on the connection issue. How to setup custom metrics is explained in this blog.

SAP reference for web service monitoring can be found here.

Data collection and alerting setup for web service monitoring

In the configuration for interface monitoring in the Technical System settings, goto the monitoring part and activate the data collection for Web Service Errors:

In the monitoring settings, you can filter on specific criteria, or leave everything blank to report on everything:

In the alerting part check you can choose between amount of entries and number of error entries:

And set the filters for the alerting:

The filter for monitoring and alerting can be different. It could be you want to monitor all errors, but only activate specific important ones.

Save your monitoring data collection and alerting settings.

Graphical modelling of web services monitoring

In the graphical modelling add the filter between two systems for the web service monitoring:

Also here: first scroll down to see the OK button. Press first OK before pressing Save, or you might loose the data and have to re-enter it. This it bit annoying in the UI.
Monitoring usage of web services

The end result looks as follows:

You can click on the errors or success messages and zoom all the way down to individual messages:

<< This blog was originally posted on SAP Focused Run Guru by Frank Umans. Repost done with permission. >>

SAP Focused Run batch job monitoring overview

This blog will explain SAP Focused Run capabilities for batch job monitoring. The first part of the blog explains the functional capabilities. The second part covers the technical setup of batch job monitoring.

Batch job monitoring

Batch job monitoring in SAP Focused Run is part of Job and Automation monitoring:

After opening the start screen and selecting the scope you get the total overview:

Click on the top round red errors to zoom in to the details (you can’t drill down on the cards below):

Click on the job to zoom in:

Systems overview

Click on the system monitoring button:

On the screen, zoom out on the overview by clicking the blue Systems text top left:

Now you get the overview per system:

Batch job analysis

Batch job analysis is a powerful function. Select it in the menu:

Result screen shows 1 week data by default:

The default sorting is on total run time.

Useful sortings:

  1. Total run time: find the jobs that run long in your system in total. These most likely will also be the ones that cause high load, or business is waiting long for to finish to give results.
  2. Average run time: find the jobs that take on average long time to run. By optimizing the code or batch job variant, the run time can be improved.
  3. Failure rate: find the jobs that fail with a high %. Get the issues known and then address them.
  4. Total executions: some jobs might simply be planned too frequently. Reduce the run frequency.

By clicking on the job trend icon at the end of the line you jump to the trend function.

Job trend function

From the analysis screen or by selecting the Trend graph button you reach the job trend function:

Select the job and it will show the trend for last week:

You can see if execution went fine, or not, and bottom right see average time the job took to complete.

Technical setup of job monitoring

For batch job monitoring settings, open the configuration and start with the global settings:

Here you can see the data volume used and set the retention time for how long aggregated data is kept.

You can also set generic rating rules:

Activation per system

In the activation per system select the system and it will open the details:

First switch on the generic activation for each system

Activation for specific jobs to be monitored

Now you can start creating a job group. First select left Job groups, then the Plus button top right:

Add a job by clicking the plus button and search for the job:

Press Save to add the job to the monitoring.

Grouping logic

You can group jobs per logical block. For example you can group all basis jobs, all Finance jobs, etc. Or you can group jobs per system. Choice is up to you. Please read first the part on alerting. This might make you reconsider the grouping logic.

Adding alerting to job monitor

The jobs added to the group are monitored. But alerting is a separate action.

Go to the Alerting part of the job group. And an alert. First select the Alert type (critical status, delay, runtime, missing a job). Assign a notification variant (who will get the alert mail), and decide on alert grouping or atomic alerts.

If you do not specify a filter it will apply for the complete group. You can also apply a filter here to select a sub group of the job group.

Based on the alerting you might want to reconsider the grouping.

Monitoring Number of Long Running Jobs

In SAP Focused Run there is no standard way of monitoring number of long running jobs either in System Monitoring or in Job Monitoring

With Job Monitoring you can monitor if a specific job is running for more than specific amount of time, but we can’t monitor if there are more than a specific number of jobs that are running for more than a specific amount of time.

And in System monitoring we can only monitor if there are more than a specific number of cancelled jobs or job in status running but we can’t monitor long running jobs.

However, the Focused Run Guided Procedure Framework provides a pre-build plugin by which you can create a custom guided procedure to check the number of long running batch jobs in a managed system.

Setup of long running jobs

To access Guided Procedures App navigate to Advanced System Management area on the Focused Run launchpad and click on the System Management Guided Procedure App.

Then on the Guided Procedure app navigate to Guided Procedure Catalog page.

On the Catalog Page click on the + button to create a new custom guided procedure.

In the next pop-up screen provide a name and description. Optionally you need to select a package if you want to transport your guided procedures e.g. from DEV Focused Run system to PROD Focused Run system.

Then back in the Guided Procedure Catalog screen click on the guided procedure you just created to open it for editing.

In the guided procedure edit screen click on Edit button.

In the Properties section provide a name for the step and a description as shown below.

Then in the Step Content section click on New button to add a step.

In the next popup select the plugin ABAP Long Running Jobs and provide the threshold for time range as long running Job. You can also specify the graphic type as a table or as a bar chart. After selecting, click on Ok button to continue.

Then Save and Activate the custom guided procedure.

Now your custom guided procedure is available for execution.

Go back to Guided Procedures Instances page to execute your guided procedure. Click on the + button to start a new execution.

In the next popup, select the guided procedure you just created and then click on + button to add managed systems for scope of execution.

After selecting the managed system click on Perform Manually to create the instance of the guided procedure for the selected scope.

Then click on the instance to start the guided procedure page.

Click on Perform to execute the guided procedure.

Now you will see the result as shown below.

For more information regarding available plugins you can refer the SAP documentation here.

Relevant OSS notes

<< This blog was originally posted on SAP Focused Run Guru by Frank Umans and Manas Tripathy (Simac). Repost done with permission. >>

SAP Focused Run creation of custom metrics for system monitoring

In most cases a fine tuning of an existing SAP template is sufficient for your needs.

In some cases you want to have your own metric defined to monitor a special part of the SAP system. This own created metrics are also called custom metric.

SAP, when you read this blog, please feel free to copy any of the custom metrics below into the standard SAP set. This will help everybody.

Questions that will be answered in this blog are:

  • How do I create a custom monitoring metric?
  • Do I need to re-create the custom metric per monitoring template?
  • What are examples of custom metrics?

Creating custom metric

In this example we create a custom metric to make sure that the background user WF-BATCH is not locked by accident.

There is already a metric in the ABAP template that is called User Lock Status. This can be used as a basis for our custom metric.

Goto your template into change mode and on top left choose Create (you need to be in Expert mode first):

And select Metric. Now the screen opens for a new metric creation:

Fill out the details, and create a custom description:

Now go to the tab Data Collection:

Copy the data from your reference metric here. Don’t forget to fill out the Parameter Value. In this case WF-BATCH. Also make sure you have a reasonable Collection Interval timing. Not everything is need to be collected every 5 minutes.

Now go to the tab Threshold:

Configure your threshold setting.

Now press the Next button and assign the metric to the correct group:

Now press Finish to save the metric.

The new custom metric is now available in the monitoring template:

You see that this one has the Custom created marked. Later you can use the filter on Custom created column to quickly find it again.

Deploying custom metric to other templates

If you have to deploy the custom metric to other templates: so far this is a manual action. Per template you have to re-create the same custom metric. I have not found a nice way of re-using custom metrics yet.

List of other custom metrics

See below:

  • Checking for certificates that are about to be expired and already expired certificates (in stead of only one out of the box metric that contains both)
  • Checking web dispatcher URL
  • Detecting errors in table locking of TBTCO
  • Detecting if file system is mounted
  • Detecting long running DIA processes
  • Detecting no more free work processes
  • Detecting OS signals
  • Detecting PRIV modes
  • Detecting message server disconnects
  • Detecting missing hardware ID
  • Detecting resource exhaustion in ABAP system
  • Detecting specific ABAP short dumps
  • User lock status of DDIC and SAP*
SAP, when you read this, please feel free to add these to standard SAP metrics.

Other interesting ones:

For system log message read OSS note 3391086 – Grey Metrics for ABAP Syslog.

Detecting errors in table locking of TBTCO

From availability perspective, you want to detect as quickly as possible if you are suffering from locking errors of table TBTCO. TBTCO table is used for printing. If the locking error situation occurs the printing function will fail, and even worse, it can impact the complete SAP ABAP system.

You can create a custom monitoring metric to measure and act on this.

Create technical name Z_METRIC_ERR_LOCK_TBTCO:

In the data collection:

Data to enter: RFC on diagnostics agent (push). Select ABAP System Log Stats. Filter on message text *TBTCO*. This captures severe errors for TBTCO like the locking error.

Define the threshold for alerting:

And assign the metric to the ABAP Instance not available alert group:

Detecting if file system is mounted

Some filesystems are critical to a business, such as those used in interfaces. This custom metric group will alert if a filesystem is not mounted.

Create the Bash Script to Check the Filesystem Status

Firstly, we need to create a bash script that takes the filesystem as its input argument and then checks its status. Create the following script called /sbin/checkfilesystemmounted.sh (owner is root, permissions 755). You may put this script somewhere else if you prefer, but be sure to refer to the correct location later on in this post.

#!/bin/bash
findmnt $1 >/dev/null && echo \{type:integer, name:FileSystemMounted, value:1\} || echo \{type:integer, name:FileSystemMounted, value:0\}

The findmnt command returns the mount details if the filesystem is mounted. The filesystem is passed as a script argument in variable $1. If the filesystem is mounted, the script returns integer 1. If the filesystem is not mounted, the script returns integer 0. For example, to check your desired filesystem, execute it like this as root:

/sbin/checkfilesystemmounted.sh /the/filesystem/you/want/to/check

The output will be in JSON format. If the filesystem is mounted, the value will be 1, as follows:

{type:integer, name:FileSystemMounted, value:1}

The name:FileSystemMounted is the name of the value to be picked up by saphostctrl, as described next.

Create the Custom Operation for saphostctrl

To load these values into Focused Run, we create a custom operation for saphostctrl. Create the following custom operations conf file:

/usr/sap/hostctrl/exe/operations.d/checkfilesystemmounted.conf

This contains:

Command: /sbin/checkfilesystemmounted.sh $[FILESYSTEM]
Workdir: /home/sapadm
Description: Check if filesystem is mounted
ResultConverter: flat
Platform: Unix

To test the custom operation, execute the following command:

/usr/sap/hostctrl/exe/saphostctrl -function ExecuteOperation -name checkfilesystemmounted FILESYSTEM=/the/filesystem/you/want/to/check

The result should be as per the following example:

Webmethod returned successfully
Operation ID: 0A02C69098121EDDA68C041B50FE858D

----- Response data ----
description=Check if filesystem is mounted
{type:integer, name:FileSystemMounted, value:1}
exitcode=0
Create the Custom Alert in SAP Focused Run

In Focused Run, we create an alert in a Linux host monitoring template. For example, the alert name is “Interface Filesystem not Mounted”. The Alert should be in Category “Exceptions” and the Severity is up to you. In this case it is 9.

Create the Custom Metric Group in SAP Focused Run

Next, we create the custom Metric Group . A Metric Group allows variants to be created, and each variant corresponds to a filesystem you wish to monitor.

Overview Tab:
  • Name: “Interface Filesystem not Mounted”
  • Category: Exceptions
  • Class: Metric Group
  • Data Type: Integer
  • Technical Name: INTERFACE_FILESYSTEM_NOT_MOUNTED

Data Collection Tab:
  • Data Collector Type: Diagnostic Agent (push)
  • Data Collector Name: OS: ExecuteOperation
  • Collection Interval: 5 Minutes (depending on the criticality)
  • CUSTOM_OPERATION_NAME: checkfileystemmounted – This corresponds to the custom operation for saphostctrl created earlier
  • METRIC_NAME: FileSystemMounted – This corresponds to the name of the metric in the JSON output by the bash script
  • RETURNFORMAT: JSON – This is the output format of the bash script

Usage Tab:

Threshold Tab:

As the script returns a numeric value 0 if the filesystem is not mounted, then the threshold will alert if the value is 0.

Assignment Tab

Assign to the custom alert created earlier.

Add Variants

The variable passed to the saphostctrl operation is “FILESYSTEM”. We can add the rest of the filesystems as individual variants. The format for the operation parameters is as follows:

FILESYSTEM:/the/filesystem/you/want/to/check

For example:

You can enter as many filesystems as you like as separate variants.

Activate Alert

Go to the “Metrics, Events, Alerts Hierarchy” tab, and activate System Monitoring.

Testing the Metric

In a non-Production environment, try to unmount a filesystem, and at most 5 minutes later, there should be an alert produced.

Detecting no more free work processes

From availability perspective, you want to detect as quickly as possible if you don’t have any free work processes left.

The template to be adjusted is the technical instance SAP ABAP 7.10 and higher template. Don’t forget to tick it on for monitoring otherwise it is not active.

In expert mode create a custom metric.

Create technical name Z_NO_FREE:

In the data collection:

Data to enter: RFC on diagnostics agent (push). Select ABAP System Log Stats. Filter on message number QoG with text *NOWP*.. For more information on system log messages, read this blog.

Define the threshold for alerting:

And assign the metric to the ABAP Resource Shortage alert group:

Detecting long running DIA process

In some exceptional cases you can have a DIA process that runs for a long time without action and still occupies the resources.

You can create a custom monitoring metric to measure and act on this. The template to be adjusted is the technical system SAP ABAP 7.10 and higher template. Don’t forget to tick it on for monitoring otherwise it is not active.

In expert mode create a custom metric. Create technical name Z_METRIC_LONGRUN_DIA_WP_36HRS:

Now setup the definition for the data collection:

It is using the Push.

And set the usage:

Last but not least: you need to set the alerting threshold:

The alert is raised if a single DIA work process is running longer than 36 hours.

Save the custom metric and make sure the template reassignment is done to activate the custom metric for your systems.

Detecting OS signals

In some cases the OS system will give critical signals to the SAP system that are visible in the ABAP system log. An example is the signal 11. When this happens, the system is in trouble and you as admin need to check fast to see what is going on to stop the system from full collapse, crash or very poor performance.

You can create a custom monitoring metric to measure and act on this.

The template to be adjusted is the technical instance SAP ABAP 7.10 and higher template.

Don’t forget to tick it on for monitoring otherwise it is not active.

In expert mode create a custom metric.

Create technical name Z_METRIC_OS_SIGNAL_RECEIVED:

In the data collection:

Data to enter: RFC on diagnostics agent (push). Select ABAP System Log Stats. Filter on MSG_ID QoE. This captures severe errors for OS signals.

Define the threshold for alerting:

And assign the metric to the system message alert group:

Detecting PRIV modes

The template to be adjusted is the technical system SAP ABAP 7.10 and higher template. Don’t forget to tick it on for monitoring otherwise it is not active.

Create technical name Z_METRIC_DIA_WP_PRIV:

Now setup the definition for the data collection:

This will collect the PRIV dialog processes in percentage.

Mark the custom metric as relevant for monitoring:

And set the assignment:

Last but not least: you need to set the alerting threshold:

Save the custom metric and make sure the template reassignment is done to activate the custom metric for your systems.

Detecting message server disconnects

From availability perspective, you want to detect as quickly as possible if you are suffering from message server disconnects.

Creation of the custom metric for message server disconnects

Create technical name Z_MESSAGE_SERVER_DISCONNECT:

In the data collection:

Data to enter: RFC on diagnostics agent (push). Select ABAP System Log Stats. Filter on message number Q0L, Q0M and Q0N. Any of those indicate message server errors. For more information on system log messages, read this blog.

Define the threshold for alerting:

And assign the metric to the ABAP Instance not available alert group:

Detecting missing hardware ID

From availability perspective, you want to detect as quickly as possible if you are suffering from missing hardware ID.

The template to be adjusted is the technical instance SAP ABAP 7.10 and higher template. Don’t forget to tick it on for monitoring otherwise it is not active.

In expert mode create a custom metric.

Create technical name Z_METRIC_MSG_SRV_HW_ID_MISSING:

In the data collection:

Data to enter: RFC on diagnostics agent (push). Select ABAP System Log Stats. Filter on message number Q16. This indicates missing hardware ID. For more information on system log messages, read this blog.

Define the threshold for alerting:

And assign the metric to the ABAP Instance not available alert group, create a custom alert group:

detecting resource exhaustion in ABAP system

From availability perspective, you want to detect as quickly as possible if you are suffering from resource exhaustion.

You can create a custom monitoring metric to measure and act on this.

Creation of the custom metric for resource exhaustion

Create technical name Z_EXHAUST:

In the data collection:

Data to enter: RFC on diagnostics agent (push). Select ABAP System Log Stats. Filter on message number Q40. This is the message for resources exhausted. For more information on system log messages, read this blog.

Set the usage to monitoring:

Define the threshold for alerting:

And assign the metric to the ABAP Instance not available alert group:

User lock status of DDIC and SAP*

From security perspective, you want to validate that 2 important users are locked in the main system clients: SAP* and DDIC. For more background you can read this blog.

Create technical name ZUSER_LOCK_STATUS:

In the data collection:

Data to enter: RFC diagnostics agent (push). User Lock status Data collector. Enter as parameters the user ID (DDIC) and the COLLECTOR_CONTEXT_ID as TECHNICAL_SYSTEM.

Set the threshold as a text threshold:

Set the red rating in case the string contains the word ‘not locked’ and set to green in case it contains the word ‘locked’.

Now assign it to Alert group for locked users:

Save the metric.

Repeat the same for SAP*.

Checking web dispatcher URL

When you are using a web dispatcher, you want to check that the main URL is available. You can achieve this via URL monitoring in health monitoring (see blog).

In some cases you want to integrate this vital start URL into system monitoring, since that is your main central tool.

You can create a custom monitoring metric to measure and act on this.

In the use case below we will setup URL monitoring for web dispatcher for SAP Netweaver Gateway serving FIORI pages.

Creation of the custom metric for web dispatcher URL monitoring

The template to be adjusted is the technical system SAP Web Dispatcher template. Don’t forget to tick it on for monitoring otherwise it is not active.

In expert mode create a custom metric. Create technical name Z_WEBDISPATCHER_URL_AVAILABILITY:

In the data collection:

Data to enter: RFC on diagnostics agent (push). Select SRSM Ping Http Unsp. Select the HTTPS protocol and setup the URL to monitor: /sap/bc/ui2/flp?sap-client=xxx&sap-language=EN. This is the main FIORI start URL. The port number is taken from the LMDB settings of the web dispatcher: $SAP_WebDispatcherIPServicePort->SAP_IPServicePort.PortNumber$.

Define the threshold for alerting:

We take here three measurements. If we don’t do this, a single glitch in the network will cause an alert to be triggered.

And assign the metric to the system message alert group:

Monitoring specific ABAP dumps

In System Monitoring of ABAP systems in Focused Run, with the standard monitoring template, we can monitor the frequency of ABAP dumps.

For monitoring if there are dumps of a specific type we have to create a custom metric. In this blog we explain how.

For creating a custom metric in the monitoring template, open the Template Maintenance App in the Advanced System Management area of Focused Run Launch-pad.

Open your custom ABAP instance level template in edit mode.

Switch to expert mode for template maintenance.

Click on Create –> Metric to create a custom metric.

Provide a Name, a Technical Name and metric type in the Overview tab as shown below.

In the Data collection tab enter details as shown below. Here for the parameter Error_ID you can provide the ID of the specific ABAP dump that you want to monitor.

Navigate to Threshold tab to specify the Threshold type and Threshold. For instance in this example we have specify the threshold to rate the metric as reed if there is 1 or more of the specific dump.

Now you can click on Next and then Finish button to save the metric.

Next you need to create a custom alert to generate a specific alert for this specific dump.

In the expert mode maintenance go to the Create button and then from the drop down select Alert.

Enter the details as shown below and click on Next button.

Then in the Assignments tab you will see the custom metric you just created. Select the check box for this metric and click on Finish to save the alert.

Now your custom metric is ready together with alerting active.

To activate this template update on all managed systems navigate to Managed Objects tab for the template and click on Apply and Activate button.

Now you can see custom metric under instance level in system monitoring.

Overview of custom metrics

A total overview of all custom metrics you created can be found using the System Monitoring Advanced Configuration tile:

On the left hand side click the icon Custom Metric Management:

Now you get the total overview:

<< This blog was originally posted on SAP Focused Run Guru by Frank Umans, Tony Swietochowski (DXC) and Manas Tripathy (Simac). Repost done with permission. >>

SAP Focused Run security baseline validation

With the help of Security and Configuration validation you can quickly get an overview of the security compliance of your systems.

Questions that will be answered in the blog are:

  • How to convert your security baseline into a SAP Focused Run Policy XML file?
  • Does SAP provide best practices for security baseline?
  • How can I run a check against many systems?
  • How can I see which security parameters are ok and which ones are not ok in one overview?
  • Can I apply a temporary exemption to the policy?
  • Can I be alerted if a security parameter is changed from compliant to non-compliant value?
  • How many security policies should I create?

SAP Security baseline

SAP publishes a generic SAP security baseline template. For more information on this template, read this blog.

On the SAP github for Focused Run, SAP has put the XML policy files that correspond to this security baseline:

The formally published version of the SAP security baseline is version 2.4.1. The published github files are only updated until version 2.4.0.

Company security baseline

The SAP security baseline can be used as a quick start. But it still needs to be tailored to your company:

  • Values might need to be altered (example; length of password)
  • Values might not be relevant for you (this normally not the case, but it could be)
  • Extra checks that are not in the SAP baseline need to be added

Exemptions

We will explain later below in the blog how to deal with exemptions. A good example of an exemption is that you have a rule, but cannot apply it to all systems. Example is the login/disable_multi_gui_login parameter. By definition you want to set it to 1 to forbid multiple logons. But for 1 older system this is not possible and you have agreed with security team on an exemption. In this case, you don’t want to have a new policy. You keep the single policy but apply the exemption.

Creating the policy file(s)

With the help of the examples in the SAP security baseline, you can build your own company security baseline policy XML file.

In this file I have made an example which contains a lot of password and logon parameter related checks for the ABAP stack:

Goto the Policy Management FIORI tile:

Create a new policy and give it a meaningful name and description:

Now press the edit button and copy and paste the content:

Now Save the policy, Check and Generate. Now you are ready to run.

You can modify the existing values in the XML sample to your need. After it is changed, Save, Check and Generate again.

Running the baseline policy

Start the Configuration and Security Analytics tile:

Select the Policy, and let the system run to get the results:

By clicking on the tab Checks you can zoom in on which items are not ok:

By clicking on a specific check you get the details for that check, which systems are not ok, and what the current value is in the system:

In this case the value 0 for special character is not ok. It should have been 1.

The tab System/Checks gives you an overview of all systems and all checks in one shot (you do need to expand the columns to more values):

Applying an exemption

Ideally you want to solve all the issue by changing the security parameters to meet the security baseline. This is not always possible. After agreement with your security team an exemption can be applied.

When you have done the security baseline run, click on the bottom left the Links icon and select Exemptions for Policies:

In the next screen press the create button to create an exemption:

Select the policy and the specific check you want to exempt (in our case we use the logon password compatibility as example) and set a due date or date range for which the exemption is valid. By setting the due date, it is valid for all systems.

With a date range, you can make the exemption applicable for selected system(s):

Remark: this one is using date range!

Now you can run the security policy again:

You can see in the text exemption have been applied. Also the tick box for Apply Exemptions has appeared. You can untick the box to run the policy without the exemptions.

Alerting on non-compliant changes

Once you have everything under control and all green (meaning all systems are compliant to baseline, or exemptions are applied), you can set up alerting to inform you that a security parameter was changed into a non-compliant value.

When running the check, go to Links on bottom left of the screen and select the Configuration Validation Alert Management option:

In the next screen now create a new alert:

Important here: carefully set the frequency. Do select the System Scope. If you want to check ABAP systems for production only, do set this into the scope section. And Set it to Active. And Save.

Every day the check will run and you will get an alert upon detecting a new non-compliant item for this policy.

More information on using the alert management function can be read in this blog.

How much policies should I create?

You can have as much policies as you like.

As a best practice, create one big one for your companies security baseline per system type:

  • All ABAP security parameters
  • All JAVA security parameters
  • All HANA security parameters

The initial setup might be quite some work, but once setup and cleaned up, the system will do all the work for you, and you need to check the alerts only.

For ABAP OSS notes you can also create policy files. See this dedicated blog.

For special cases you can create dedicated policies.

Use case for checking existance of client 001 and 066

Security & configuration validation can be used to check for the existence of clients 001 and 066.

The 066 early watch client and old delivery clients 001 are only security risks (unless in rare cases 001 has been chosen as execution client). Best to delete them from security point of view (see reference blog).

<?xml version="1.0" encoding="utf-8"?> 
<targetsystem xmlns:xsi="http://www.w3.org/2001/XMLSchema-instance" desc="Test CLIENTS Store" id="TEST_CLIENTS" multisql="Yes" version="0000" xsi:schemaLocation="csa_policy.xsd"> 
  <configstore name="CLIENTS"> 
    <checkitem desc="CLIENTS_CHECK" id="1.0.0.0"> 
      <compliant>
        MANDT = '000' or MANDT = '010' or MANDT = '100'
      </compliant> 
      <noncompliant> 
        MANDT = '001' or MANDT = '066' 
      </noncompliant> 
    </checkitem> 
  </configstore> 
</targetsystem>

In the compliant section add more clients that are valid and/or change the numbers to your own situation.

Basically the rule says: 001 and main client(s) listed are compliant. 001 and 066 are not compliant.

Result:

<< This blog was originally posted on SAP Focused Run Guru by Frank Umans. Repost done with permission. >>

SAP Focused Run security notes validation

In the blog on security and configuration validation overview, we have explained to run a validation of ABAP security notes against your systems using Focused Run configuration and security validation.

Questions that will be answered in this blog are:

  • How can I quickly run an entire year of security OSS notes versus my systems?

SAP github with security policy source files

SAP publishes files for the ABAP security notes each month on the SAP Focused Run Best Practices GitHub:

Here the policy files for the ABAP security notes are stored per year and per month.

Not all security notes for ABAP stack are in these files: only the ABAP notes which can be applied via SNOTE. Security notes for ABAP stacks which require parameter changes or patches are not part of this check!

For convenience I have collected the files per year.

These files are for convenience only. It can be I made a mistake in assembling them.

Uploading the files

Goto the Configuration validation policy maintenance Fiori tile:

Create new policy and copy paste the text from the file:

Do this by choosing Edit and copy and paste the text in the editing section:

Now Save the policy. Check the XML. Generate the policy and check it by pressing Test Policy. Note that these are large files with many checks, so the testing can take some time. Run can be done via the Validate button or by following the instructions below.

Running the Security notes checks against the connected systems

To run the checks, goto the Configuration and Security Analytics Fiori tile:

Select the policy file to run:

Now be patient until the results are ready.

Make sure you expand the amount of columns.

If an ABAP notes is not applied it does not mean your system is not safe. You have define for which CVSS score and which systems you want to apply the security OSS notes, within which timeframe.

More on CVSS score see OSS note 2463332 – Security Note CVSS vector computation – SAP Solution Manager 7.1 and 7.2 and this SAP blog explaining the CVSS scoring in general.

<< This blog was originally posted on SAP Focused Run Guru by Frank Umans. Repost done with permission. >>

SAP Focused Run alert management overview

The alert management function is a central alert inbox function for SAP Focused Run. All alerts from all tools are coming together in the alert inbox.

Questions that will be answered in this blog are:

  • How does the alert inbox work?
  • How can I get a good overview of all the alerts?
  • How can I mail an alert?
  • Which actions can I perform on an alert?
  • Can I set up my own alert dashboard?
  • Can I have Focused Run automatically confirm some of the alerts, when the system detects all is ok again?
  • Which alerts are sent to the Alert inbox?
  • How to organize alert handling?
  • How to execute alert review?
  • How to reduce the amount of open alerts?
  • How can I configure Focused Run to send mails for specific alert situations?
  • How can I setup multiple mail receivers?
  • How can I setup multiple mail groups?
  • How can I change the layout of the mail?

Alert inbox

To open the Alert Inbox, click on the Fiori tile:

Don't let yourself be distracted by the high number. This is the total unfiltered amount of alerts. It will contain alerts from production and non-production systems. It will be important and non-important alerts.

Now the open alert overview dashboard will open:

There is a lot of information on this screen.

Top left are the open alerts by source. This means the open alerts by application, instance, database. In the middle top are the open alerts by category (like availability, exceptions, etc.). Top right is the open alerts by current rating. Bottom left is the top type of open alert by type of metric that is causing the alert. Bottom right is the distribution of open alerts by age.

The alerts are centralized and can have diverse sources:

Processing an alert

From the overview you can choose two ways to start:

  1. On the top right section click on the Critical alerts that are currently still open.
  2. On the left, select the open alert list icon:

Both options will bring you to the list of open important alerts:

The sorting is done from Very High and then High, etc, already. The most important open current alerts are on top. This list can also be exported to Excel.

Clicking on an alert will open the details:

Here you can see the history and current status. It can be that the alert is till red, but it can also be that Focused Run detects that the current situation is now ok. It will still leave the alert open for you to analyse and confirm.

You can click on the Actions button to get the follow up action menu:

  • Confirm the alert will close the alert.
  • Add a comment: add text to the alert.
  • Add or change a processor: assign a user ID who should pick up the alert and is responsible for the alert.
  • Trigger an alert reaction (for example to SAP solution manager IT service desk or outbound integration to for example ServiceNow)
  • Send notification will give you the option to mail the alert:

Using the action log button:

you can see the action log for the alert:

Alert handling

An alert is sent to the alert inbox. But for each alert you can configure as well if an alert is e-mailed, and/or send to external tool like ServiceNow.

The alert inbox has a scope filter just like all the other Focused Run tools. Use it to filter the alerts for you most important systems (most likely the productive systems, or even filter on the core S4HANA and/or ECC systems).

Depending on your organizational structure and amounts of systems, you need to agree on how you handle the alerts. Aspects to be taken care of:

  • Prioritization of alerts; which ones go first? Solutions:
    • Use filters for important systems
    • First red alerts, then yellow alerts
      • Fine tune alert thresholds to reduce invalid red alerts
  • Assign processor or not: for larger teams do assign a processor to keep track
  • Fill out comments for alerts that take longer to solve, so you track what has been done
  • Consider to postpone alerts that require a change to get fixed (and the change takes a longer time to implement)
  • Using the SLA functions or not?
  • Who is allowed to confirm an alert?

Alert review

You can use the initial alert dashboard, or the alert reporting overview, or create your own dashboards:

The overview shows the open alerts:

Clicking on any colored bar will bring you to the detailed list. From the list you can filter down to the details.

At the start of your SAP Focused Run implementation you should at least weekly review this. It gives you insights into:

  • The type of alerts most frequently popping up
  • The systems that generate the most alerts
  • The average time an alert is open

When you are getting more mature and used to solving the issues

Open alert reduction

To reduce the open alerts consider this sequence:

  • Solve the issues in the systems: clean up, apply permanent solutions
  • Fine tune the metric thresholds for false alerts, and classify not so important alerts as yellow: keep red for the important alerts
  • Work on the resolution time: also here, focus on the red alerts which are important

Bad practices (often deployed by KPI drive service providers):

  • Increase thresholds, without clean up or without solving the issues permanently
  • Simply close each repetitive alert fast without checking and solving the root cause for repetitive failure
  • Only look at subsection of the alerts
  • Don’t look at self monitoring items (without solving self monitoring issues)
  • Blame Focused Run for having bugs (without looking for OSS notes and without reporting issues)
  • Don’t confirm the alerts (so they keep open and don’t send new mails, or don’t create new ServiceNow tickets)

If you are confronted with such a service provider, use the alerting reporting tools also for the closed alerts to find evidences of such behaviors.

Missed alerts

After incidents you have (mainly in your productive system), check if Focused Run generated the proper alert or not.

Cases that can happen:

  • Focused Run did alert the situation, but it was not picked up fast enough by the processors: organizational measures, or consider the mail sending option
  • Focused Run did measure the situation, but the alert was not configured (for example batch job alert was not set)
  • Focused Run did measure the situation, but the threshold was not reached: lower the threshold in the template
  • Focused Run did measure the situation, but it was not specific enough. This can happen with SM21 system messages. Consider creation of very specific custom metrics for specific messages (for example for application server connectivity loss to database).
  • Focused Run did not measure the situation: check if you can activate an out-of-the-box monitoring item for the situation. Not all measurements are active in the templates by default. If no out-of-the box exists, consider creating a custom metric. Or check if you can monitor side-effects of occurring bad situations.

The goal of this analysis is to keep improving the alerting accuracy: alerts should not be missed and valid (not false).

Automatic confirmation of alerts

For some type of alerts, you might want to activate the automatic confirmation. This automatic confirmation is set at template level. Read this blog on the details. If it is set, the alert will still be created. The alert will remain open until the system detects the issue is gone. If gone, the system will automatically close the alert.

Alert management search

With the looking glass left you goto the Alert search overview. Here you can search in any way you want on the alerts, including free text search:

Top right you select extra specific filter criteria:

Custom alert page

By clicking on the + icon on the left button bar, you can add your own alert page:

The UI is the same as for the tactical dashboards.

More on the Alerting dashboards in this dedicated blog.

Mailing alerts

Setting up alert consumer

First we will set up the alert consumer. Goto the Alert Consumer Variant configuration tile:

In the next screen click on the Plus symbol to create a new Alert Consumer:

Initially there is no mail template and no recipient list.

We will create these in the steps below. When these are created, they can be used in the drop downs. Save the consumer and don’t forget to put the status to Active.

Maintain recipient list

From the alert consumer screen create a new recepient list:

Give it a name and add the e-mail addresses for the group. There can be one or multiple. Save the list.

Maintain e-mail template

Create a new e-mail template:

On the left hand side you can see the variables you can use. On the right hand side you construct the mail template. Preview is possible but shows limited functionality only. Save after you are happy with the mail.

Using the alert consumer

Now we have created the alert consumer with the mail template and recipient list. We can goto the monitoring template maintenance to assign the alert consumer. In the alerts tab of the template that you want to alert on, goto the Alerts tab:

For the type of alert switch the Automatic notification to Use Variant. In the Notifications tab below, you can now assign the created variant. Save the settings.

After the template change: do not forget to Apply and Activate the template for use.

Testing and mail sending

To test your settings: use a development system or sandbox to test your event. Then check in SOST that the mail is properly created:

<< This blog was originally posted on SAP Focused Run Guru by Frank Umans. Repost done with permission. >>

SAP Focused Run fine tuning of monitoring templates

This blog explains about the fine tuning of monitoring templates.

Questions that will be answered are:

  • How to update the SAP content for templates?
  • What is a good rule of thumb for the amount of templates to create and maintain?
  • Should I transport the templates or maintain them locally?
  • How to create your own template?
  • How to fine tune a single metric?
  • How to change the alerting settings of a metric?
  • How to assign the template to a system?
  • How to update the template of a system?
  • Which tools can I use to perform fine tuning of alert thresholds?
  • Can I perform a forecast based on the data?
  • Can I perform a sensitivity analysis?
  • Which installation activities are required to enable the forecast and sensitivity functions?
  • How do I define rule bassed template assignments?

SAP content updates

As a starting point you use the SAP pre-delivered content. Also the SAP content gets updated. OSS note 3275006 – Manual content update for FRUN-CONT 400 in SAP Focused Run. is keeping track of the updates. It also explains where to download the content files.

Use program RCSU_MANUAL_UPLOAD to upload the downloaded content. Then use the FIORI tile Content management to activate the new content:

And update the content or see it is already up-to-date:

Before you start fine tuning your own templates, make sure the standard SAP content is up-to-date.

Amount of templates to fine tune

In principle it is up to you to generate as much templates as needed. Initially it seems a good idea to have many different templates. The setback is that fine tuning a specific metric that is valid for all templates, you need to repeat this action. Also when you have fine tuned a template, you need to update the attached systems.

A good starting point for fine tuning is to have 2 templates to start with:

  1. Template for productive system
  2. Template for non-productive system

The template for productive system can have more metrics activated with sharper thresholds for generating alerts.

The main goal for a non-productive template can be focused on system availability only.

For productive system you want to manage all aspects of a system including performance and all content exceptions.

Local maintenance or transport

The template maintenance can be done on a productive Focused Run system directly. Or you can choose to maintain the templates on a trial/test Focused Run system, test it there, and then transport it to the productive Focused Run system. The transport is the best approach that gives the most control.

Who should fine tune a template?

This is an organisational question. If you let everybody maintain the templates and metric content of the templates, you will quickly loose control. Best to limit the amount of people to maintain the template settings. Be careful when handing out template control to a service provider. They tend to change the thresholds to very high levels, so they get less alerts. In stead of solving the alerts….

Creation of own template

Open the template maintenance Fiori tile:

Select the template you want to fine tune. In this example we will fine tune the Technical System template for ABAP 7.10 and higher:

Press the Edit button and then the button Create Custom Template:

Give the template a good name. The most descriptive text must be at the beginning.

Fine tuning the template

Case 1: include or exclude in monitoring

Goto the metrics tab:

In the system monitoring you can switch on or off metrics. Press save after each change to save your setting changes.

Case 2: fine tune data selection

In the standard SAP delivery there is an alert for Number of long running Dialog Work Processes. Goto the Expert mode (button top rights), then select the tab data collection:

Go into edit mode via the Change Settings button, and you can update the field value in parameter value for WP_MIN_RUNTIME to your needs:

This is just an example. You can fine tune a lot of metrics in this way.

Case 3: fine tune threshold and alert settings

If you want to change the thresholds, first click on the expert mode button on the top right corner. Then press the Change setting button to edit the Threshold tab settings:

In this example we changed the type from Numeric (green/red) to Numeric (green/yellow/red) and we changed the values. The modified column indicates that we have changed a metric and

that the definition is different from the standard SAP one.

On the Alerts tab you can make changes to the alert settings:

You can change the following:

  • If an alert is to be generated or not (Active means, alert is generated)
  • Severity of the alert
  • If an alert will be automatically confirmed when the system detects that the issue is solved
  • If an automatic notification will be send or not

In the last tab Managed Objects you can see there are no systems assigned yet to the newly created template:

How to fine tune an alert in practice

In our example we will look at the Dialog Response Time metric. The current threshold for red alert is set to 5000 ms (5 seconds). The alert is triggered too often. But the question to answer now: what is a good threshold to set based on the historical data?

First click the Open metric in new window icon to enlarge the screen:

The enlarged screen now opens:

As you can see 2 times the red threshold was hit. We want to fine tune now. First select the calendar icon and select last 7 days to get full week overview:

You can use the forecast button to let the system create a forecast:

The forecast will now show mean, mean low and mean high forecast:

In this specific use case the prediction is that the maximum is 3300 ms (3.3 seconds).

Now open the statistics button to see the statistics and the recommended threshold tool button:

By changing the Sensitivity slider, the system will calculate different proposal for the alert threshold. In our case when we move sensitivity to 4 the new recommended threshold value is recalculated:

In this case it is 7669 ms.

So we now have collected following facts:

  • Current threshold of 5 seconds is reached too often
  • Average forecast based on history has a mean value of 3.3 seconds
  • Performing the sensitivity analysis the threshold recommendation is about 7.7 seconds

Based on this data the red threshold is best to increase from 5 to 8 seconds to get a good alert function. It will not reach too soon, hence limiting false alerts, but it will still alert in time in case poor performance happens.

Enabling forecast and sensitivity analysis

The forecast and sensitivity analysis function use the Application Function Library (AFL) and SAP HANA Automated Predictive Library (APL). These must be installed separately. The installation details and post steps for granting permissions are described in the Focused Run master guide in the section “Predictive Analytics Setup – Metric Forecasting”.

After the installation you must activate and assign PFCG role SAP_FRN_APP_PAS_DISP to be able to see the buttons.

Assigning custom template to a system

To assign a new custom template to a system, goto the Individual maintenance Fiori tile:

Select the system and press the button Change assignment and assign the wanted new template:

Now press the button Reconfigure to effectuate the template change.

Automation of template assignments can be configured as well by using rules.

Template updates

If you have systems assigned to a template, and you have executed template changes, goto the tab Managed objects in the template maintenance screen:

Select the systems and press the Apply and Activate button. The system will apply the updated template now.

If you use transport mechanism for template updates: after transport import, you need to go to the updated templates, and still to the update assignment. This is not automatically done after the transport.

Compare templates

In the main screen of template maintenance you can select the button Compare to start the template comparison app. Select the templates to compare:

You now see the delta’s between the templates:

Creating custom metrics

Creation of custom metrics is possible to have metrics for your specific needs.

The setback of custom metric is that it needs to be created each time for each template. This is another reason to keep the amount of custom templates as low as possible.

Read all about custom metrics in this blog.

Rule Based Template Assignment

When we perform Simple System Integration (SSI) on a managed system , it automatically activates the SAP default monitoring template on the managed system. However, in most of the SAP Focused Run (FRUN) implementation scenarios, we create customer defined monitoring templates (Custom Templates), which we then manually assign/activate on the managed system.

Rule Based Template Assignment is a feature in FRUN by which we can define based on managed system category which custom monitoring template to be assigned and activated directly when we perform SSI on the managed system.

Defining Rule Based Template Assignment

For Rule Based Template Assignment navigate to the Fiori tile Individual Maintenance in the Advanced System Management section of Fiori launch-pad.

In the Individual Maintenance App navigate to the Rule Maintenance by clicking on the button as shown below.

In the Rule Rule Based Assignment Screen, on the left hand side panel, select the specific Managed Object type for which you want to define the Rule Based Template Assignment.

In this blog we take the example of defining a Rule Based Template Assignment for managed system of type SAP ABAP BASIS 7.10 and higher and specify the custom template for System Level monitoring template. So we select Technical Systems upon which the right side panel now gives a list of all product types. In the right side panel we scroll down and select SAP ABAP BASIS 7.10 and higher.

Now we need to define the Rule based on which the Custom Defined Template to be defined. In this blog we take the example that we have defined 2 custom templates one for Production Systems and one for Non Production Systems. So we will need to define rule to assign template based on filters System Type ABAP and IT Admin role defined in LMDB. For more information on this function read this blog.

In the subsequent screen select Maintain Rules.

In the Maintain Rule screen we select the following filters.

Name your Rule and Save.

Similarly you can create Rule ABAP Non production, just ensure to select the following IT Admin Roles.

Now back in the main screen select the Rule you created from the drop down.

And for Template select the custom template you want to select for the assignment.

Add the assignment.

Now click in “Continue with Next Step” button until you come to the Reconfiguration tab and then close. This will allow you to save your Rule Assignment.

Once you have assigned the ABAP Production and ABAP Non production rules in the main screen you will see the following assignments listed.

After the assignments done, the next time SSI performed on any ABAP system will take up the custom monitoring template as defined in these rules.

In Individual Maintenance system list you can also see whether current assignment is SAP default or Rule Based Template Assignment.

OSS notes

<< This blog was originally posted on SAP Focused Run Guru by Frank Umans and Manas Tripathy (Simac). Repost done with permission. >>