As ABAP developer you need to search for a user-exit and/or BADI for a certain transaction.
The helper program below can help you here. Copy and paste the source code and run the program:
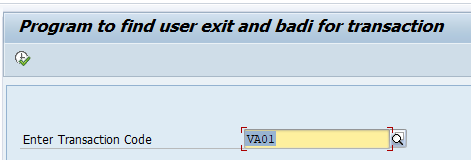
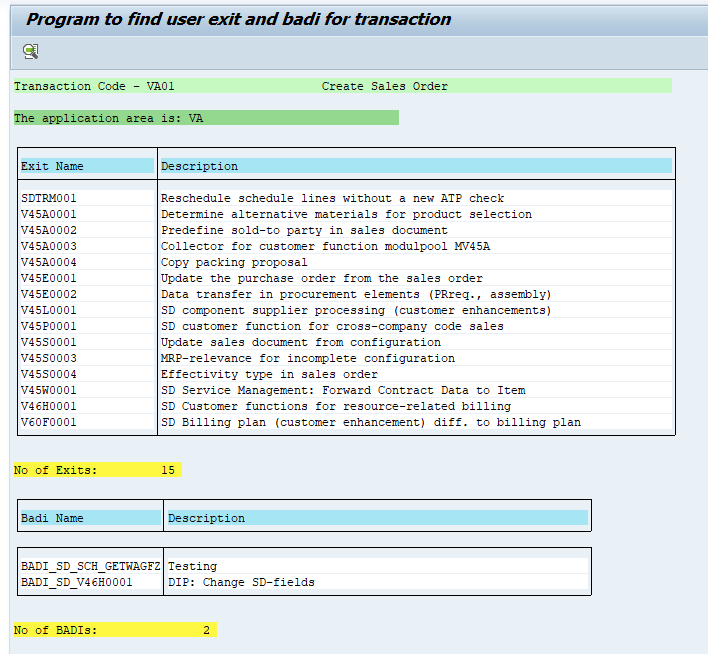
Enter the transaction code and let the program search. Results will show:
You can click on the exit or badi name to jump to the definition.
The program to search for BADI or user-exit
REPORT zbadi NO STANDARD PAGE HEADING.
*& Enter the transaction code that you want to search through in order *
*& to find which Standard SAP User Exits exists. *
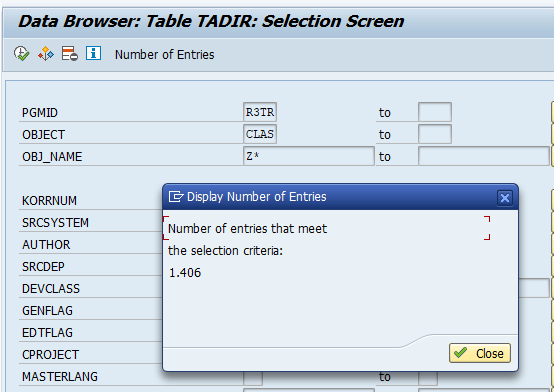
TABLES : tstc, "SAP Transaction Codes
tadir, "Directory of Repository Objects
modsapt, "SAP Enhancements - Short Texts
modact, "Modifications
trdir, "System table TRDIR
tfdir, "Function Module
enlfdir, "Additional Attributes for Function Modules
tstct, "Transaction Code Texts
rsstcd,
trkey.
*&---------------------------------------------------------------------\*
*& Definition of Types *
*&---------------------------------------------------------------------\*
TYPES: BEGIN OF t_badi_list,
obj_name TYPE sobj_name,
devclass TYPE devi_class,
dlvunit TYPE dlvunit,
imp_name TYPE exit_imp,
packname TYPE devclass,
dlvunit2 TYPE dlvunit,
text TYPE sxc_attrt-text,
END OF t_badi_list.
TYPES: BEGIN OF t_badi_list2,
obj_name TYPE sobj_name,
devclass TYPE devi_class,
dlvunit TYPE dlvunit,
END OF t_badi_list2.
*&---------------------------------------------------------------------\*
*& Data Declaration *
*&---------------------------------------------------------------------\*
DATA: lt_badi_list TYPE TABLE OF t_badi_list,
lt_badi_list2 TYPE TABLE OF t_badi_list2,
ls_badi_list TYPE t_badi_list OCCURS 0 WITH HEADER LINE,
ls_badi_list2 TYPE t_badi_list2.
RANGES: r_badi FOR tadir-obj_name ,
rt_badi FOR tadir-obj_name .
*&---------------------------------------------------------------------\*
*& Variables *
*&---------------------------------------------------------------------\*
DATA : jtab LIKE tadir OCCURS 0 WITH HEADER LINE,
p_trkey LIKE trkey.
DATA : field1(30),
badiname(20),
count TYPE p.
DATA : v_devclass LIKE tadir-devclass,
p_devclass LIKE tadir-devclass,
p_old_langu LIKE sy-langu,
p_mod_langu LIKE sy-langu.
*&---------------------------------------------------------------------\*
*& Selection Screen Parameters *
*&---------------------------------------------------------------------\*
SELECTION-SCREEN BEGIN OF BLOCK a01 WITH FRAME TITLE TEXT-001.
SELECTION-SCREEN SKIP.
PARAMETERS : p_tcode LIKE tstc-tcode OBLIGATORY.
SELECTION-SCREEN SKIP.
SELECTION-SCREEN END OF BLOCK a01.
*&---------------------------------------------------------------------\*
*& Start of report *
*&---------------------------------------------------------------------\*
START-OF-SELECTION.
* Validate Transaction Code
SELECT SINGLE * FROM tstc WHERE tcode EQ p_tcode.
*Find Repository Objects for transaction code
IF sy-subrc EQ 0.
SELECT SINGLE * FROM tadir WHERE pgmid = 'R3TR'
AND object = 'PROG'
AND obj_name = tstc-pgmna.
MOVE: tadir-devclass TO v_devclass.
IF sy-subrc NE 0.
* This section is used if a FGR is involved\!
CALL FUNCTION 'RS_ACCESS_PERMISSION'
EXPORTING
global_lock = 'X'
object = p_tcode
object_class = 'TRAN'
mode = 'SHOW'
language_upd_exit = 'RS_TRANSACTION_LANGUAGE_EXIT'
suppress_language_check = space
IMPORTING
new_master_language = p_old_langu
modification_language = p_mod_langu
transport_key = p_trkey
devclass = p_devclass
EXCEPTIONS
canceled_in_corr = 1
OTHERS = 2.
IF sy-subrc = 0. " Success
MOVE: p_devclass TO v_devclass.
ELSE. " For the case that nothing is found\!
SELECT SINGLE * FROM trdir WHERE name = tstc-pgmna.
IF trdir-subc EQ 'F'.
SELECT SINGLE * FROM tfdir WHERE pname = tstc-pgmna.
SELECT SINGLE * FROM enlfdir WHERE funcname = tfdir-funcname.
SELECT SINGLE * FROM tadir WHERE pgmid = 'R3TR'
AND object = 'FUGR'
AND obj_name = p_devclass.
MOVE: tadir-devclass TO v_devclass.
ENDIF.
ENDIF.
ENDIF.
*Find SAP Modifactions
SELECT * FROM tadir INTO TABLE jtab
WHERE pgmid = 'R3TR'
AND object = 'SMOD'
AND devclass = v_devclass.
SELECT SINGLE * FROM tstct WHERE sprsl EQ sy-langu
AND tcode EQ p_tcode.
FORMAT COLOR COL_POSITIVE INTENSIFIED OFF.
WRITE:/(19) 'Transaction Code - ', 20(20) p_tcode, 45(50) tstct-ttext.
FORMAT COLOR COL_POSITIVE INTENSIFIED ON.
SKIP.
WRITE:/1 'The application area is:', v_devclass.
SKIP.
IF NOT jtab[] IS INITIAL.
WRITE:/(95) sy-uline.
FORMAT COLOR COL_HEADING INTENSIFIED ON.
WRITE:/1 sy-vline, 2 'Exit Name', 21 sy-vline, 22 'Description', 95 sy-vline.
WRITE:/(95) sy-uline.
LOOP AT jtab.
SELECT SINGLE * FROM modsapt
WHERE sprsl = sy-langu
AND name = jtab-obj_name.
FORMAT COLOR COL_NORMAL INTENSIFIED OFF.
WRITE:/1 sy-vline, 2 jtab-obj_name HOTSPOT ON, 21 sy-vline , 22 modsapt-modtext,
95 sy-vline.
ENDLOOP.
WRITE:/(95) sy-uline.
DESCRIBE TABLE jtab.
SKIP.
FORMAT COLOR COL_TOTAL INTENSIFIED ON.
WRITE:/ 'No of Exits:' , sy-tfill.
SKIP.
WRITE:/(83) sy-uline.
FORMAT COLOR COL_HEADING INTENSIFIED ON.
WRITE:/1 sy-vline, 2 'Badi Name', 22 sy-vline, 23 'Description', 83 sy-vline.
WRITE:/(83) sy-uline.
* select the BAdI Definitions from the tables sxc_exit and sxc_attr
SELECT t~obj_name t~devclass tc~dlvunit sx~imp_name sat~text
INTO CORRESPONDING FIELDS OF TABLE lt_badi_list
FROM ( ( ( ( tadir AS t
INNER JOIN
tdevc AS tc ON t~devclass = tc~devclass )
INNER JOIN
sxc_exit AS sx ON sx~exit_name = t~obj_name )
INNER JOIN
sxc_attr AS sa ON sx~imp_name = sa~imp_name )
INNER JOIN
sxc_attrt AS sat ON sx~imp_name = sat~imp_name )
WHERE t~pgmid = 'R3TR'
AND t~object = 'SXSD' "means BAdI
AND t~devclass = v_devclass "narrow down seach with Dev.Class
AND sat~sprsl = sy-langu.
SORT lt_badi_list.
DELETE ADJACENT DUPLICATES FROM lt_badi_list.
* create Ranges
LOOP AT lt_badi_list INTO ls_badi_list .
r_badi-sign = 'I' .
r_badi-option ='EQ' .
r_badi-low = ls_badi_list-imp_name .
r_badi-high = ls_badi_list-imp_name .
APPEND r_badi TO rt_badi .
ENDLOOP.
* select the implementations
SELECT t~obj_name t~devclass tc~dlvunit
INTO CORRESPONDING FIELDS OF TABLE lt_badi_list2
FROM tadir AS t
INNER JOIN
tdevc AS tc ON t~devclass = tc~devclass
FOR ALL ENTRIES IN rt_badi
WHERE t~obj_name = rt_badi-low
AND t~pgmid = 'R3TR'
AND t~object = 'SXCI'.
FORMAT COLOR COL_NORMAL INTENSIFIED OFF.
WRITE:/(83) sy-uline.
count = '0'.
LOOP AT lt_badi_list INTO ls_badi_list .
WRITE:/1 sy-vline, 2 ls_badi_list-obj_name HOTSPOT ON, 22 sy-vline,
23 ls_badi_list-text, 83 sy-vline.
count = count + 1.
ENDLOOP.
WRITE:/(83) sy-uline.
DESCRIBE TABLE ls_badi_list.
SKIP.
FORMAT COLOR COL_TOTAL INTENSIFIED ON.
WRITE:/ 'No of BADIs:' , count.
ELSE.
FORMAT COLOR COL_NEGATIVE INTENSIFIED ON.
WRITE:/(95) 'No User Exit exists'.
ENDIF.
ELSE.
FORMAT COLOR COL_NEGATIVE INTENSIFIED ON.
WRITE:/(95) 'Transaction Code Does Not Exist'.
ENDIF.
*&---------------------------------------------------------------------\*
*& Call SMOD or SE18 to lead the user to the selected exit or badi *
*&---------------------------------------------------------------------\*
AT LINE-SELECTION.
GET CURSOR FIELD field1.
IF field1(4) EQ 'JTAB'.
SET PARAMETER ID 'MON' FIELD sy-lisel+1(10).
CALL TRANSACTION 'SMOD' AND SKIP FIRST SCREEN.
ELSEIF field1(12) EQ 'LS_BADI_LIST'.
CALL FUNCTION 'SXO_BADI_SHOW'
EXPORTING
exit_name = sy-lisel+1(20)
EXCEPTIONS
action_canceled
access_failure
badi_not_exixting.
ELSE.
ENDIF.