This blog will explain the ways to find information about SAP support for browsers.
Questions that will be answered in this blog are:
- Where do I find overall information about SAP support on browsers?
- Which OSS notes are relevant for specific browsers?
- When does SAP internet explorer 11 (IE11) browser support stop?
SAP support on browsers
The main OSS note for browser support in SAP Netweaver is OSS note 1728946 – Browser: Browser Support Strategy for NetWeaver. For FIORI SAP UI5 technology, the main note is 1716423 – SAPUI5 Browser Support.
Most of the browser fixes are delivered in the Unified Rendering patch updates. Read more on this topic in this dedicated blog.
A common source of browser issues is the Active Component Framework. Read in this blog why it is best to NOT use this framework at all.
SAP netweaver browser support
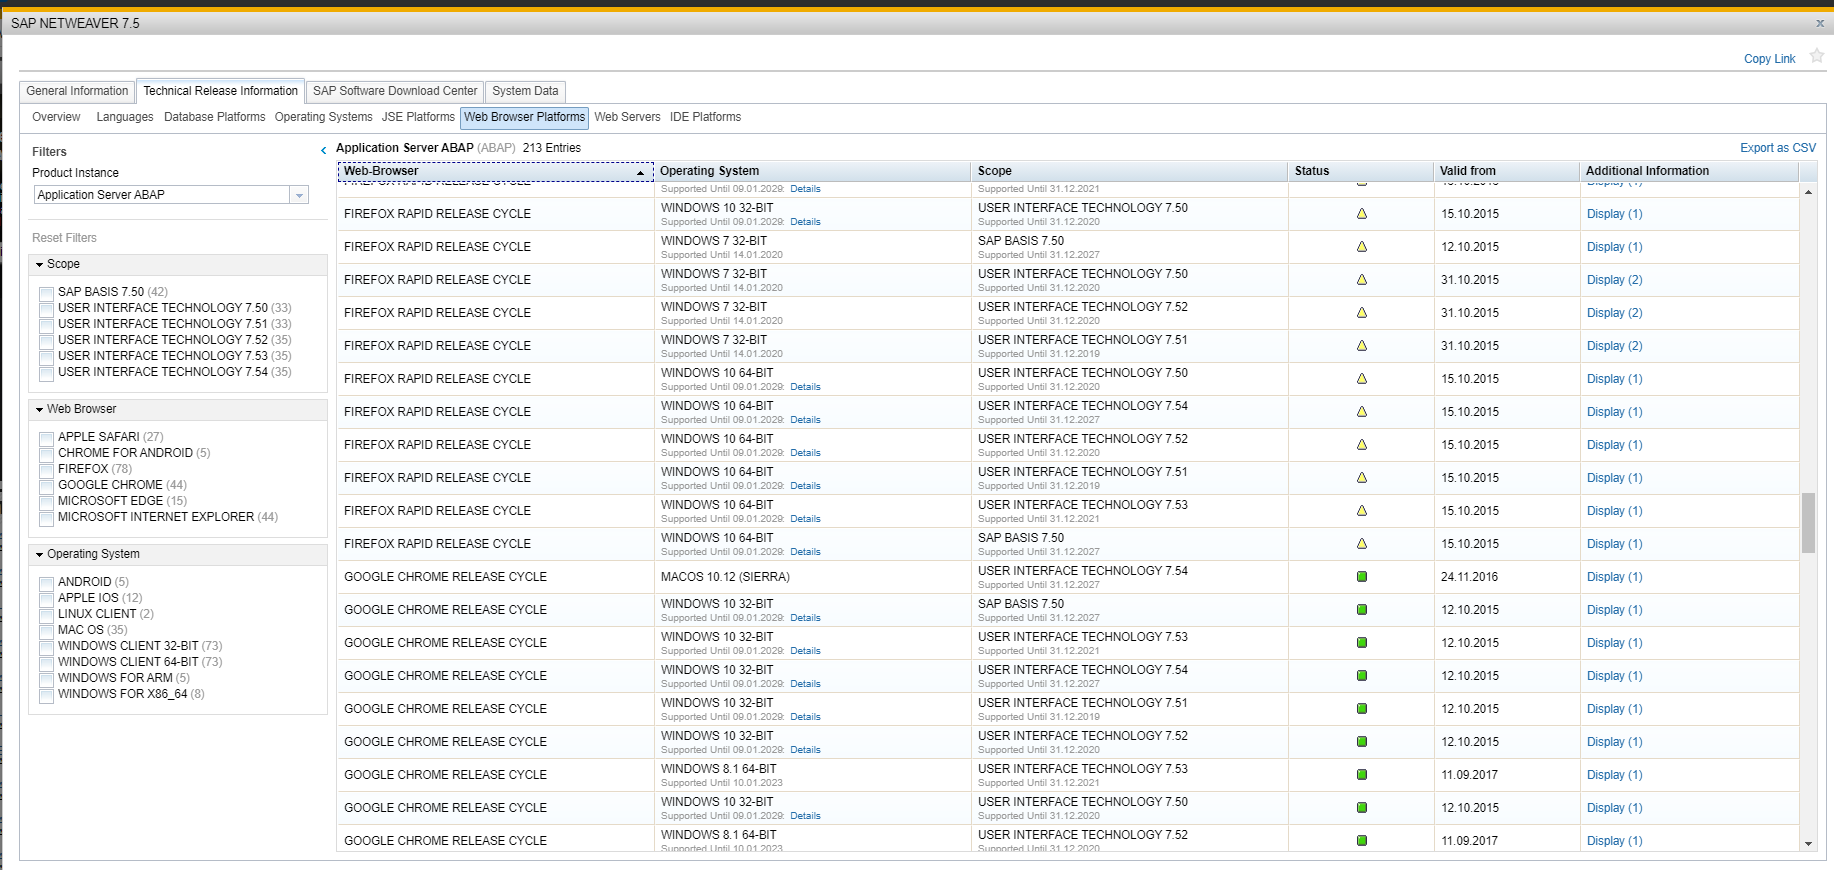
On the SAP support PAM site you can find the specific browser support for each browser and netweaver combination:
Stop support of Internet Explorer
Microsoft stops support of Internet Explorer by 15th of June 2022 and will remove it with upcoming patches after that date. Impact on SAP GUI: 3058309 – End of support for Internet Explorer by Microsoft – impact on SAP GUI for Windows. Basic summary from this note: “This means as long as you are not running SAP GUI embedded in a browser window, the de-support of Internet Explorer does not have any functional impact on you.”.
Specific browser notes
Main notes for specific browsers:
Chrome:
Safari:
Firefox:
Internet explorer: support is still there but will end towards the end of 2021:
- 1672817 – Browser: Microsoft Legacy Edge and Internet Explorer Support Policy Note
- 2569081 – IE browser support in SAPUI5 after 2021
Detailed specification of IE11 end of support can be found in the official SAP blog.
Microsoft Edge:
- 2884143 – Browser: Support policy for the new Microsoft Edge (EdgeOnChromium)
- 3006905 – Microsoft Edge Chromium support for Enterprise Portal
Browsers on mobile devices:
Issues with SAP and browsers
Issues with SAP and browsers can be on both side: SAP and browser side. A new security note on SAP can suddenly block correct working of an SAP browser based function. A new security patch on the browser can also suddenly block it. Testing all combinations is a very hard process and almost impossible to do. The best way is to allow the users at least 2 different browsers. If one browser is having issue with an update, usually the other browser still works, which can be used as a workaround. It is not nice and pretty, but it gives you time to fix the issue. For issues on the SAP side: best to yearly patch the UI rendering notes (see this blog), and to carefully test notes that impact the web part (like security notes which are meant to close security holed in the netweaver web part).