This blog is about number ranges.
Questions that will be answered in this blog are:
- How to maintain number ranges?
- How to transport number ranges?
- How to clean up old number ranges?
- How to check if number ranges are full or almost full?
- Which notes can help me when we have performance issues issues with number ranges?
SNRO number range maintenance
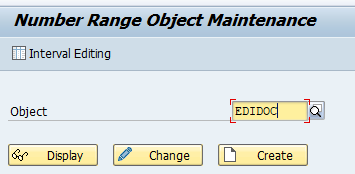
Number ranges can be maintained with transaction SNRO. After starting select the number range to maintain:
Now press the button Interval Editing:
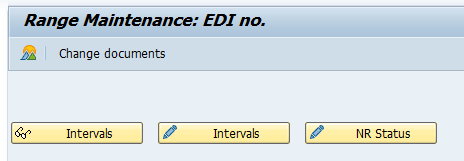
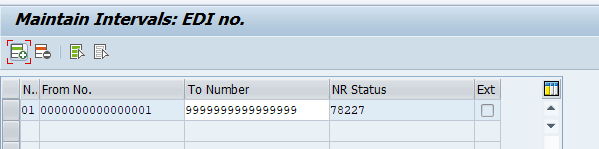
Now you can display or change the intervals or current number:
Transport of number ranges
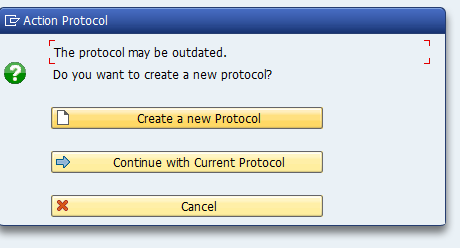
Number ranges are not directly put into a transport. If you want to transport them, select from the range maintenance screen the menu option Ranges / Transport. You will get this warning screen:
After pressing Yes, the popup for the transport request will come.
Number range fill up check
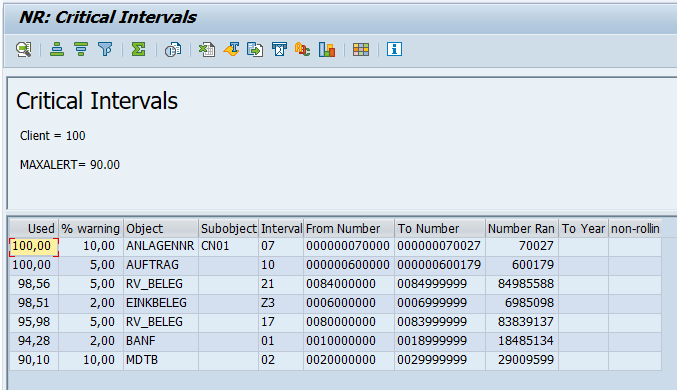
Program RSNUMHOT can be used to check if any number range is full or is at a certain percentage.
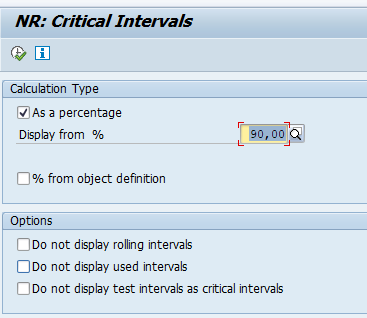
Output example:
For background running read the KBA note 2485249 – How to see the spool results of report RSNUMHOT.
Clearing abandoned number ranges: 3286395 – RSNUMHOT | Critical intervals are reported for abandoned number ranges.
Number range buffer
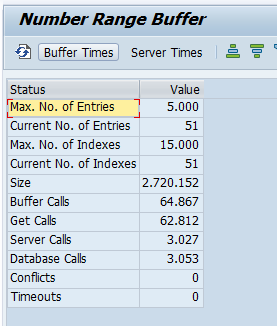
Using transaction SM56 you can check the number range buffer settings:
See also OSS note 2586414 – NUM: Increase default of number range buffer size.
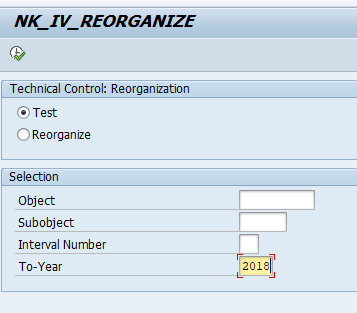
Number range clean up
If you have an older SAP implementation, the amount of number ranges can go very high. There are many number ranges per year, especially in finance. The result can be that transaction SNRO gets very slow. If this is the case install OSS note 2931837 – NR: Reorganization of interval table. This will bring program NK_IV_REORGANIZE to reorganize the number range table:
Number range issues
Number ranges are know to have issues in 2 areas:
- Performance (mainly on very large systems): can be seen in SM66 or SM50 with long updates on table NRIV
- Gaps in number ranges where legal requirements exist
OSS notes to check when having number range issues:
- 1524325 – Poor performance due to locks on table NRIV – Buffering of billing documents
- 1843002 – Gaps and jumps in number range assignment
- 2200503 – FAQ Number ranges (BC-SRV-NUM component)
- 2284857 – Number ranges – trace
- 2469364 – Locks in table NRIV
- 2530392 – NR: Very large number of entries in table NRIVSHADOW
- 2562670 – NR: Performance of parallel buffering
- 2685162 – NR: Trace for main memory buffering
- 2787435 – Number Range Objects inconsistencies [Troubleshooting]
- 2841586 – Parallel buffering: No number is returned
- 2853060 – NR: Deletion of intervals without object
- 2874600 – NR: Interval limits larger than defined number length
- 2883680 – NR: TIME_OUT dump for function module NUMBER_RANGE_INTERVAL_INIT
- 2891720 – Deadlock during update of intervals
- 2955996 – Locks in table NRIV_LOKAL
- 3009263 – NR: Empty number returned in case of parallel buffering
- 3055954 – NR: Long runtime for parallel buffering
- 3068082 – NR: Authorization check for interval maintenance
- 3070186 – NR: Additional trace entries if no number returned