This blog will explain how to set up trusted RFC connection.
Questions that will be answered are:
- How to setup a trusted RFC connection?
- How to edit generated RFC in SM59 using the TOGL function?
Setting up trusted RFC
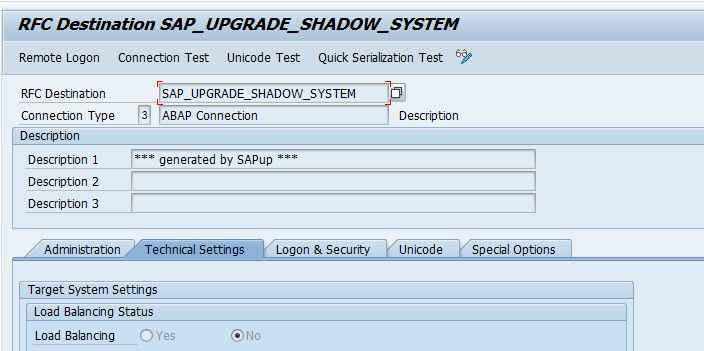
Start in transaction SM59 to create an RFC to the destination system:
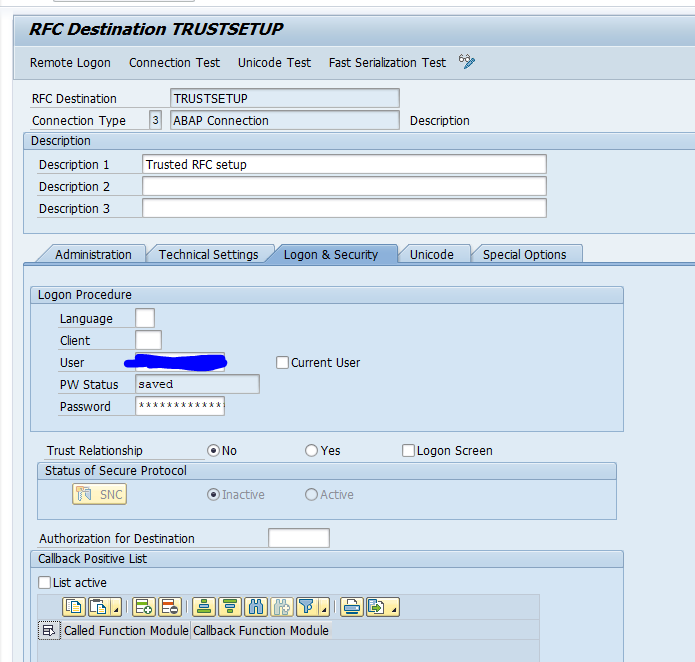
Fill out your own user ID first. Make sure your user ID is existing in the destination system and is having sufficient S_RFCACL rights in the destination system. See OSS note 128447 – Trusted/trusting systems for the details.
Test the connection including the remote logon.
If that is ok, start transaction SMT1 and start the roadmap for setting up the trusted connection:
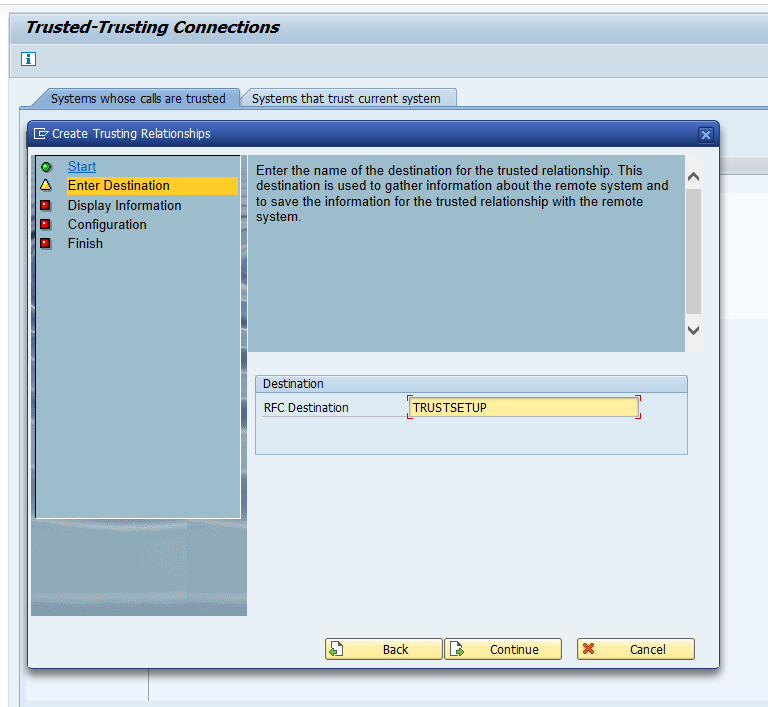
Enter the destination and finish the roadmap:
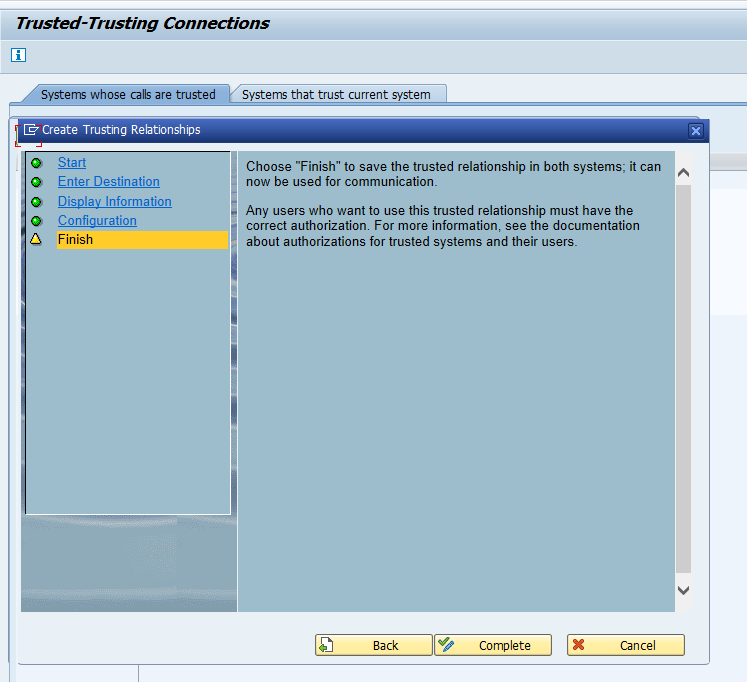
Complete the roadmap.
Now return to SM59 for the destination and remove the user ID, tick the box “Current User” and switch the Trust Relationship to Yes:
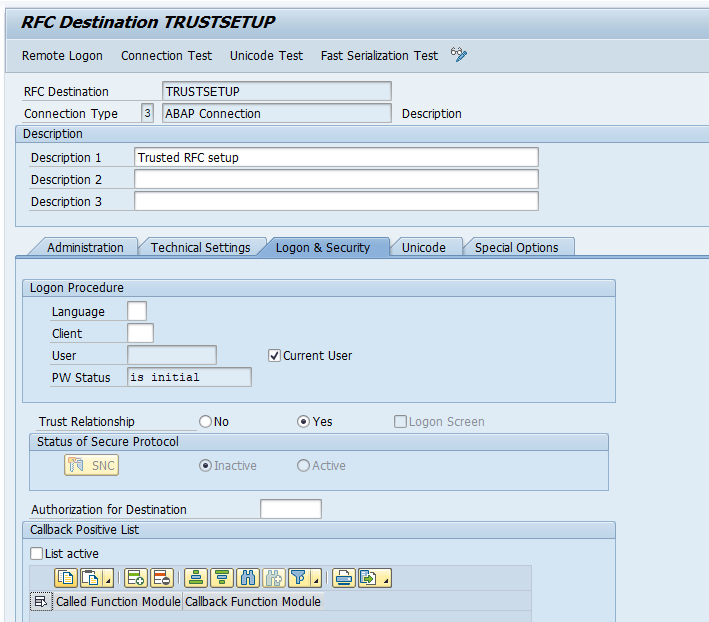
Now test again. All should work.
Background SAP wiki can be found in this link.
Background notes:
Testing trusted RFC
A trusted RFC can be tested via the Remote Logon button:
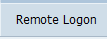
If you now can jump from the current system to the connected system without password prompt: then all is fine.
If it is not working: check in the target system in ST22 for a remote logon failure dump. Must likely your user does not have sufficient rights in the target system.
RFC security settings
For checking RFC security settings, read this dedicated blog.
RFC Access Control List
In the newer S4HANA versions, you can switch from an authorization check towards a full Access Control List setup. Use transaction SMTACL and select the trust connection:
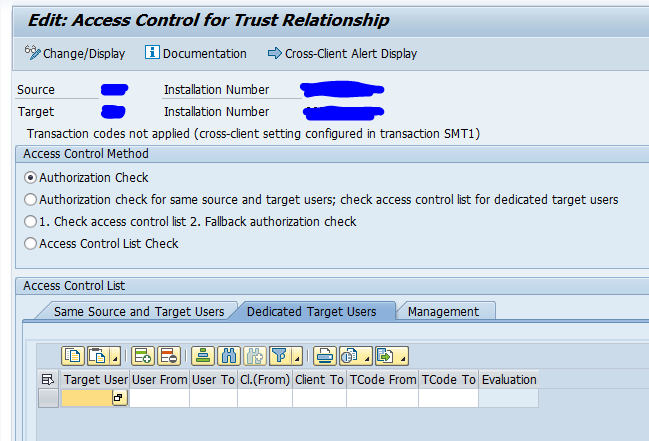
Switch here to Access Control List Check.
RFC hacking
Be aware that RFC’s and especially trusted RFC’s can be misused for hacking. Read this dedicated blog on how, and how to protect.
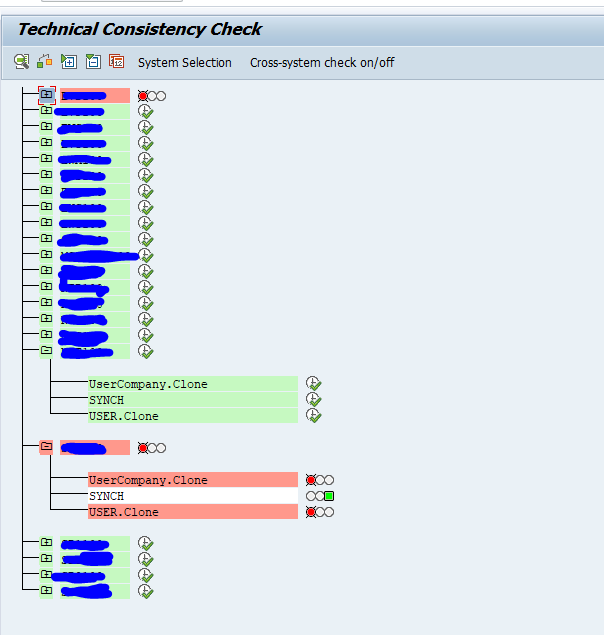
Checking which systems you trust
With transaction SMT2 you can check which systems have a trusted system setup towards the system you are currently logged in to.
Editing trusted connections
Trusted connections are generated. In case of emergency you might need to edit this, in the command bar enter keyword TOGL to go to SM59 edit mode:
See note 3212943 – How to edit the settings of unchangeable RFC destinations.
Trusted systems and installation number changes
If you have trusted systems and want to change an installation number of one of the systems, carefully read this OSS note: 2849941 – SMT1/SMT2 configuration after SID or installation number change.
Issues with trust certificates
In exceptional cases you might face issues with cache refresh of replaced certificates. See OSS note 2947038 – Error SOAP:1033 CheckPSE occurs in STRUST/STRUSTSSO2. Solution is to run program SRT_CFG_CLEAR_DESIGNTIME_CACHE.
Trusted RFC security note 3157268
Unfortunately SAP released security note 3157268 – How-To-Guide: Migration of Trusted/Trusting Relationships. Along with the FAQ note 3281854 – FAQ for Security Note 3089413. If you did not migrate your existing trusted RFC’s to the new setup, do it fast within reasonable time (which includes proper testing).
After migration is done, or when you have a new setup, make sure you have set parameter rfc/allowoldticket4tt to the value no.